HAL Id: hal-01205114
https://hal.archives-ouvertes.fr/hal-01205114
Submitted on 27 May 2020
HAL is a multi-disciplinary open access
archive for the deposit and dissemination of
sci-entific research documents, whether they are
pub-lished or not. The documents may come from
teaching and research institutions in France or
abroad, or from public or private research centers.
L’archive ouverte pluridisciplinaire HAL, est
destinée au dépôt et à la diffusion de documents
scientifiques de niveau recherche, publiés ou non,
émanant des établissements d’enseignement et de
recherche français ou étrangers, des laboratoires
publics ou privés.
common sole (Solea solea) transcriptomes: integration in
a database and design of a microarray.
Hicham Benzekri, Paula Armesto, Xavier Cousin, Mireia Rovira, Diego
Crespo, Manuel Alejandro Merlo, David Mazurais, Rocío Bautista, Darío
Guerrero-Fernández, Noe Fernandez-Pozo, et al.
To cite this version:
Hicham Benzekri, Paula Armesto, Xavier Cousin, Mireia Rovira, Diego Crespo, et al.. De novo
assembly, characterization and functional annotation of Senegalese sole (Solea senegalensis) and
com-mon sole (Solea solea) transcriptomes: integration in a database and design of a microarray.. BMC
Genomics, BioMed Central, 2014, 15, pp.952. �10.1186/1471-2164-15-952�. �hal-01205114�
R E S E A R C H A R T I C L E
Open Access
De novo assembly, characterization and functional
annotation of Senegalese sole (Solea senegalensis)
and common sole (Solea solea) transcriptomes:
integration in a database and design of a
microarray
Hicham Benzekri
1,2, Paula Armesto
3, Xavier Cousin
4,5, Mireia Rovira
6, Diego Crespo
6, Manuel Alejandro Merlo
7,
David Mazurais
8, Rocío Bautista
2, Darío Guerrero-Fernández
2, Noe Fernandez-Pozo
1, Marian Ponce
3, Carlos Infante
9,
Jose Luis Zambonino
8, Sabine Nidelet
10, Marta Gut
11, Laureana Rebordinos
7, Josep V Planas
6, Marie-Laure Bégout
4,
M Gonzalo Claros
1,2and Manuel Manchado
3*Abstract
Background: Senegalese sole (Solea senegalensis) and common sole (S. solea) are two economically and evolutionary important flatfish species both in fisheries and aquaculture. Although some genomic resources and tools were recently described in these species, further sequencing efforts are required to establish a complete transcriptome, and to identify new molecular markers. Moreover, the comparative analysis of transcriptomes will be useful to understand flatfish evolution.
Results: A comprehensive characterization of the transcriptome for each species was carried out using a large set of Illumina data (more than 1,800 millions reads for each sole species) and 454 reads (more than 5 millions reads only in S. senegalensis), providing coverages ranging from 1,384x to 2,543x. After a de novo assembly, 45,063 and 38,402 different transcripts were obtained, comprising 18,738 and 22,683 full-length cDNAs in S. senegalensis and S. solea, respectively. A reference transcriptome with the longest unique transcripts and putative non-redundant new transcripts was established for each species. A subset of 11,953 reference transcripts was qualified as highly reliable orthologs (>97% identity) between both species. A small subset of putative species-specific, lineage-specific and flatfish-specific transcripts were also identified. Furthermore, transcriptome data permitted the identification of single nucleotide polymorphisms and simple-sequence repeats confirmed by FISH to be used in further genetic and expression studies. Moreover, evidences on the retention of crystallins crybb1, crybb1-like and crybb3 in the two species of soles are also presented. Transcriptome information was applied to the design of a microarray tool in S. senegalensis that was successfully tested and validated by qPCR. Finally, transcriptomic data were hosted and structured at SoleaDB. Conclusions: Transcriptomes and molecular markers identified in this study represent a valuable source for future genomic studies in these economically important species. Orthology analysis provided new clues regarding sole genome evolution indicating a divergent evolution of crystallins in flatfish. The design of a microarray and establishment of a reference transcriptome will be useful for large-scale gene expression studies. Moreover, the integration of
transcriptomic data in the SoleaDB will facilitate the management of genomic information in these important species. Keywords: Soles, Transcriptome, Microarray, Orthology, Molecular markers, SoleaDB
* Correspondence:manuel.manchado@juntadeandalucia.es
3
IFAPA Centro El Toruño, IFAPA, Consejeria de Agricultura y Pesca, 11500 El Puerto de Santa María, Cádiz, Spain
Full list of author information is available at the end of the article
© 2014 Benzekri et al.; licensee BioMed Central Ltd. This is an Open Access article distributed under the terms of the Creative Commons Attribution License (http://creativecommons.org/licenses/by/4.0), which permits unrestricted use, distribution, and reproduction in any medium, provided the original work is properly credited. The Creative Commons Public Domain Dedication waiver (http://creativecommons.org/publicdomain/zero/1.0/) applies to the data made available in this article, unless otherwise stated.
Background
The term“Soles” refers to a wide group of flatfish species belonging to the Soleidae (true soles) and Cynoglossidae (tongue soles) families. Common sole (Solea solea) and Senegalese sole (Solea senegalensis) are two economically important species highly appreciated worldwide due to the excellent quality of their flesh (low-fat, firm and white) and heavily exploited in industrial fisheries. As a result, sole overfishing has had a profound effect on some life-history traits observing a shift towards earlier sexual mat-uration and a decline of the spawning biomass [1,2]. Therefore, aquaculture efforts have focused on S. senega-lensisas one of the most promising species for diversifica-tion in Southern Europe due to its fast growth rates [3-5]. However, Solea aquaculture is facing several bottlenecks such as the production of high-quality larvae, the im-provement and optimization of nutrition for better growth rates and the development of strategies for the control of infectious diseases. In addition, the failure to reproduce successfully soles of the F1 generation in captivity pre-cludes the development of selection programs [4,6]. More-over, soles are an excellent model to study development and metamorphosis in fish. Soles undergo drastic morpho-logical, physiological and ethological changes early during development for a short period of time (between 12–18 days after hatching in S. senegalensis). Therefore, sole spe-cies have become a suitable model to study larval ontogeny, skin pigmentation, hormonal and epigenetic mechanisms controlling development, sex differentiation, nutritional requirements, asymmetrical development as well as comparative genomics in flatfish [7-10].
In this context, development of large-scale genomic resources is a priority to facilitate the implementation of new technological approaches such as RNA-seq and genome-wide mapping studies, that can assist in the identification of signalling networks controlling meta-morphosis, growth, reproduction or disease resistance to advance in the knowledge of their biology and to im-prove rearing techniques and selective breeding [7]. Sev-eral studies have focused previously on the development of genomic resources in S. senegalensis and S. solea spe-cies. Molecular markers, including microsatellites (or Single Sequence Repeats; SSRs) and Single Nucleotide Polymorphisms (SNPs), and Bacterial Artificial Chromo-somes (BAC) libraries have been developed [2,7,11-18]. Being scarce, more polymorphic markers are required for population management and breeding programs. Moreover, a limited set of expressed sequence tags (ESTs) has been described in each species that were used for the design of species-specific oligo-DNA microarrays [19,20]. Consequently, the number of available ESTs is still far to conform a representative transcriptome as de-scribed in other teleosts and further sequencing efforts are required.
Next generation sequencing technologies (NGS) have drastically transformed the way researchers can address genomic questions on non-model species, including soles. The NGS platforms are able to generate quickly an enor-mous bulk of cost-effective genomic information, even for those species with limited or no previous genomic infor-mation available [7]. Although NGS offers different appli-cations, cDNA/RNA sequencing (RNA-seq) has become very popular for genome-wide transcriptome profiling and de novo sequencing of transcriptomes. The high-volume of transcriptomic reads generated constitute a rich and important source of potential molecular markers, includ-ing SSRs and SNPs, as well as for transcript processinclud-ing, making possible the design and implementation of other techniques such as microarray hybridization or qPCR [7,20]. In aquaculture, several studies have described the implementation of 454 pyrosequencing for de novo tran-scriptome sequencing of some Mediterranean species such as seabream [21,22], common sole [20] or seabass [23]. Most of these studies have focused on the characterization of transcriptomes under specific developmental stages, pathogen challenge or tissue-specific profiles. Neverthe-less, the design of a dedicated species-specific database would be useful for easier management of genomic infor-mation (detailed annotations, tissue-specific and whole transcriptomes) and development of complementary tech-niques such as microarrays or RNA-seq.
The main aim of this work was the generation of a representative transcriptome for S. senegalensis and S. solea after processing an important large set of tran-scriptomic information produced by Roche/454 and Illu-mina paired-end NGS technologies covering a large number of developmental stages associated to physio-logical challenges. The main transcriptome features and characteristics were identified. Comparative analysis be-tween soles allowed for the identification of orthologs, new genes and molecular markers. Finally, a browseable database referred to as SoleaDB was constructed and a new microarray tool was designed and validated.
Results and discussion
Pre-processing and assembly of NGS data
A total of 37 and 43 Illumina libraries (1,800 million reads) were prepared for S. senegalensis and S. solea, re-spectively, and additional Roche/454 sequences (5.6 mil-lion reads) were prepared for S. senegalensis (Table 1, Additional file 1). Most paired reads were useful after pre-processing (83.3% and 79.5% in S. senegalensis and S. solea, respectively). The most important source of reads removed were ribosomal and mitochondrial sequences (Table 1, Additional file 1). Other contaminants less repre-sented in the Illumina data were reads from live preys and microalgae used in larvae feeding (Artemia (8-21%), roti-fers (2-4%) and T-iso (2-3%) and some microorganisms,
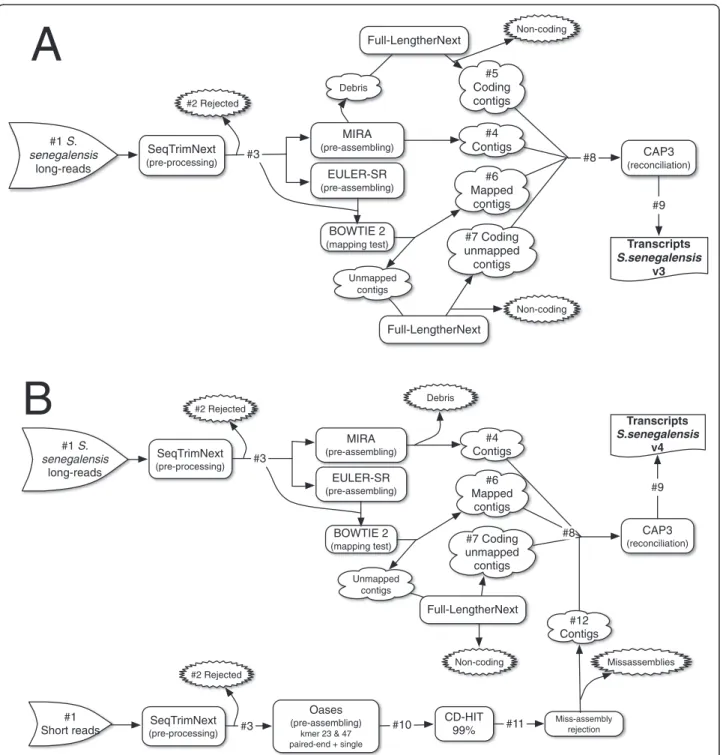
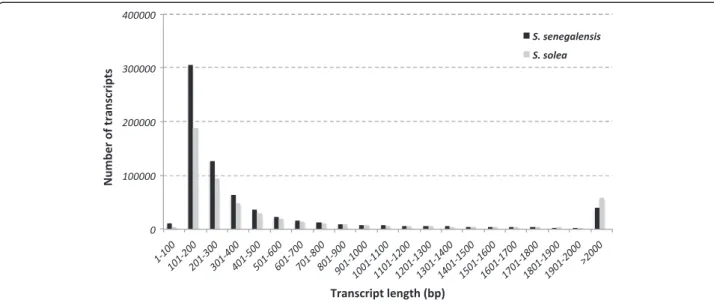
mainly fungi (13-21%). Assuming that the putative number of genes occurring in Solea might range between 21,516 and 26,206 protein-coding genes, as reported in Cynoglos-sus semilaevis and Danio rerio, respectively [24-26], with an average transcript length of 2,841 nt, the estimated tran-scriptome coverage of useful reads ranged from 1,384× to 1,686× for S. senegalensis, and from 2,088× to 2,543× for S. solea. Therefore, the number of high quality reads was suf-ficient to assemble a reliable transcriptome in both species. The S. senegalensis transcriptome was initially assem-bled using only the Roche/454 reads, following the workflow depicted in Figure 1A (Additional file 2, S. senegalensis v3). Interestingly, the assembly resulted in a large number of transcripts longer than 500 bp, slightly higher than expected for a teleost [24,27]. The addition of Illumina libraries to improve transcriptome assembly (S. senegalensis v4 final transcriptome) required the workflow depicted in Figure 1B, where the long read strategy was slightly modified (essentially, all MIRA3 debris were discarded). The S. solea transcriptome (named S. solea v1) was assembled using the short read strategy depicted in Figure 1B, except that k-mers used were 25 and 69 due to longer raw reads (Table 1). S. solea v1 and S. senegalensis v4 transcriptomes were com-parable with respect to (i) the frequency distribution of transcript length (Figure 2), (ii) the total number of scripts (Additional file 2) and (iii) the number of tran-scripts longer than 500 bp (Additional file 2). However, mean length and N50 were clearly longer in S. solea (Additional file 2), which may be explained by the longer input reads (89 vs 66 nt in S. solea and S. senegalensis, re-spectively, Table 1) and a low relative contribution of Roche/454 reads in S. senegalensis v4. This low contribution
may be explained by the fact that Roche/454 libraries were normalized to reduce highly abundant transcripts which might have led to more fragmented assemblies limiting the contribution of Roche/454 reads to the final transcriptome [28].
Previous reports that focused on de novo transcrip-tome assembly used a variable number of input reads (from 2 up to 368 million reads [29-31]). However, a total of 20–30 million reads were considered sufficient to generate a de novo transcriptome, even though assem-bly is highly influenced by factors such as species or type of sample (whole-body or a specific tissue) [31]. For ex-ample, the number of transcripts in six different marine invertebrates varied from 86,897 to 338,254 in spite of the fact that the number of input of reads was similar (56.2-80 million reads). Moreover, more transcripts were discovered using whole-body samples [31]. In this study, a joint analysis of the complete set of samples compris-ing a wide range of organs and developmental stages was performed to facilitate a maximal gene representa-tion into the final transcriptome assembly. As a whole, more than 1,800 million reads were assembled in each sole species, representing the highest number of reads reported to date for any organism.
Transcriptome characteristics
The main characteristics of the assembled transcriptomes are depicted in Table 2. A detailed analysis of the assembled transcriptomes reveals, first, that the number of artifacts was very low in spite of the extraordinarily large number of transcripts assembled. Second, that the S. senegalensis v4 transcriptome was improved over the S. senegalensis v3 transcriptome in terms of transcript length and number of
Table 1 Pre-processing summary of raw reads
NGS platform
Reference to Figure1 Illumina 454
Species S. senegalensis S. solea S. senegalensis
Total Input Reads #1 1,800,249,230 2,101,324,072 5,663,225
Mean length 76 100 757 Rejected (total) #2 N 237,941,945 345,251,849 1,562,661 % 13.5 17.1 26.8 By contamination N 144,247,943 226,627,909 156.921 % 8.2 11.2 3.0 Useful reads #3 1,561,416,814 1,746,258,741 3,774,412 86.7 83.1 67.6 Paired reads N 1,503,882,050 1,676,160,406 -% 83.3 79.5 -Single reads N 57,534,764 70,098,335 3,774,412 % 3.2 3.3 67.6 Mean length 66 89 184
complete ORFs, but both transcriptome versions pre-sented a similar number of different orthologous IDs, sug-gesting that the high number of juvenile tissues pooled to prepare the Roche/454 libraries could have importantly contributed to obtain a better gene representation. Third, that the number of different complete ORFs was high and similar between the transcriptomes of the two sole species (Table 2,“Different, complete ORFs”), suggesting that sole
transcriptomes are equally reliable. Finally, that S. senega-lensis v4 had a higher number of orthologous IDs and a lower number of different complete ORFs than S. solea v1, which may be due to a greater transcript fragmentation in S. senegalensis because Roche/454 data only contributed to increase the orthology in the final assembly.
The extremely large number of reads used to assemble the two sole transcriptomes could favour the accumulation
Figure 1 Schematic representation of the pre-processing, assembling and reconciliation approach to obtain the final transcriptome. A, strategy for a set of only long reads. B, strategy combining long and short reads. The numbers with“#” serve as a reference for
Figure 2 Representation of transcript abundance with respect of their lengths in the S. senegalensis (dark) and S. solea (grey) transcriptomes.
Table 2 Overview of assembled transcriptomes in S. senegalensis and S. solea
S. senegalensis S. solea
v3 v4 v1
Transcripts % Transcripts % Transcripts %
Transcripts 252,416 - 697,125 - 523,637 -Artifacts2 nc - 7,095 1.02 10,086 1.92 Valid transcripts 252,416 100.00 701,767 100.00 531,463 100.00 >500pb 37,593 14.90 156,083 22.24 165,860 31.22 >200pb 168,914 66.92 385,411 54.92 338,967 63.89 Longest transcript 6,050 - 40,163 - 30,526
-Transcripts with ortholog1 81,348 32.23 147,536 21.02 121,696 22.90
Different orthologous IDs 41,792 51.37 45,063 30.54 38,402 31.56
Complete ORFs 6,742 8.31 39,727 26.93 52,051 42.77
Different, complete ORFs 4,376 5.38 18,738 12.70 22,683 18.64
C-terminus 14,757 18.14 27,080 18.35 19,579 16.09
N-terminus 11,298 13.88 27,638 18.73 25,131 20.65
Internal 47,529 58.43 53,091 35.99 24,935 20.49
Putative ncRNAs 539 0.21 1,252 0.18 1,075 0.20
Transcripts without ortholog1 171,067 67.56 545,491 77.73 408,692 76.90
Putative new transcripts 22,612 13.21 39,812 7.30 34,194 8.37
Non-redundant new transcripts nc – 14,451 2.65 15,603 3.55
Unknown 147,916 86.48 505,679 92.70 374,498 91.63
Reference transcriptome nc – v4.1: 59,514 8.48 v1.1: 54,005 10.16
The values were calculated using FullLengtherNext software. The minimum number of transcripts that can be considered as a reference transcriptome is shown in bold.
1
Percentages for subclassifications of this category were calculated using this line as 100% reference.
2
Artifacts refer mainly to misassemblies and chimeric contigs. nc: Non-calculated.
of assembly errors [28,31]. Evaluation of transcript accuracy was initially based on mapping useful reads of two ran-domly selected libraries of each sole transcriptome using Bowtie2 (not shown). Since 96.7-98.7% of the reads mapped onto assembled transcripts, the assembly errors can be con-sidered negligible. Interestingly, the longest transcript in S. senegalensis v4 and S. solea v1 transcriptomes (Additional file 2,“Longest transcript”) is clearly not an artifact: in both species, it corresponded to a titin-like protein highly similar to a long mRNA (94,446 bp) previously assembled in tilapia (Acc No XM_005460929). Titin is a giant filamentous pro-tein highly abundant in muscle that forms a separate myo-filament system in both skeletal and cardiac muscle [32]. The fact that this transcript is 6-fold longer in S. senegalen-sis v4 than in S. senegalensenegalen-sis v3 supports the significant con-tribution of Illumina short-reads to the final assembly.
SoleaDB, a database for browsing Solea transcriptomes
Genomic databases are extremely useful for target se-quence retrieval, Blast comparisons, sese-quence manage-ment and compilation of all information that can help to a better understanding of the function and roles of genes. A preliminary database devoted to host Sanger EST information, microarray data and ISH pictures was developed for S. senegalensis [19]. Nevertheless, this database was not suitable to manage the important vol-ume of information generated using NGS. Hence, a new database, SoleaDB, was built to host all the information for S. senegalensis and S. solea transcriptomes, following the same architecture as reported for EuroPineDB [33] and SustainPine [34]. SoleaDB was structured and de-signed in a user-friendly manner showing all information regarding experimental conditions, NGS libraries charac-teristics and processing pipelines to clean, assemble and annotate the transcriptomes. Navigation is very intuitive with information structured by assemblies including glo-bal assemblies (with history versions) and by experimen-tal conditions. A search tool to find specific transcript information by different fields and a Blast tool was also incorporated.
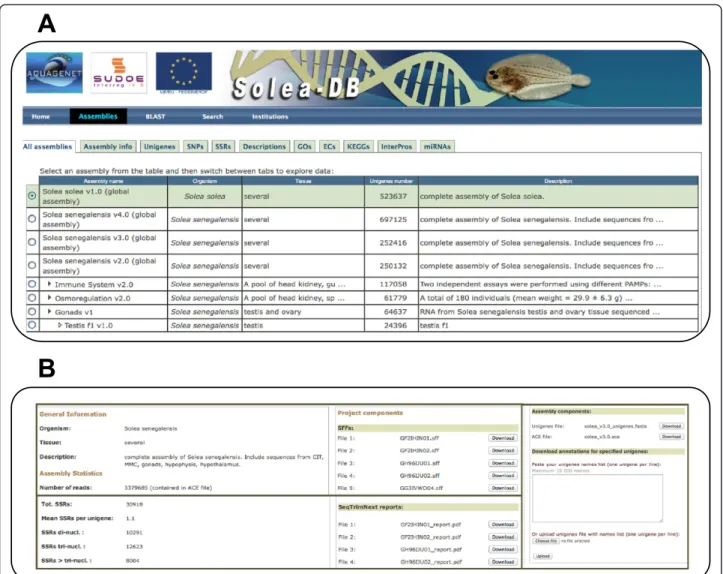
In the “Assemblies” tab, different transcriptome ver-sions can be browsed (Figure 3A). For each assembly (i.e., transcriptome version), there is a brief description (“Assembly info” tab) of experimental conditions as well as assembly, markers and annotation statistics. Raw se-quencing reads, pre-processing reports, Fasta and ACE files, as well as annotations for functional analysis can be downloaded from the same tab (Figure 3B). In the “Uni-genes” section, users can search for specific transcripts and browse their specific information. Information avail-able for each transcript includes the consensus sequence, the corresponding contig, functional annotations, full-length status, ORF prediction, and putative markers. By means of KEGG and EC annotations, genes in specific
pathways can also be retrieved. All annotations incorpo-rated in SoleaDB are freely downloadable for the scien-tific community.
Therefore, SoleaDB can be extremely useful for data comparison across experiments allowing for the identifica-tion of paralogues, alternative spliced transcripts and novel genes. It represents a new, easy-to-use, valuable tool to host NGS data and for sharing genomic information be-tween users applying these techniques. Moreover, whole and reference transcriptomes will be a useful tool for downstream applications such as RNA-seq. Examples of usefulness of SoleaDB can be found in the next sections.
Transcripts without ortholog as a source of putative new sole transcripts
The high number of transcripts without ortholog (Table 2) deserved a deeper analysis. Based on their low testcode index, >91% of the unknown transcripts did not encode for proteins (Table 2; “Unknown”), which could explain in part the lack of orthology. To check the ac-curacy of these unknown transcripts, genome reads (from several shotgun genomic libraries of S. senegalen-sis available in our laboratory) were mapped onto the unknown transcripts of S. senegalensis v4, resulting in 462,568 (91.25%) unknown transcripts mapped (440,385 with more than 10 reads). These high mapping percent-ages indicate that these sequences were not assembly ar-tifacts and that they might correspond to co-purified genomic fragments or immature transcripts.
Among the 7.30% and 8.37% of transcripts without ortholog in S. senegalensis v4 and S. solea v1, respectively, some showed a testcode index >0.94 (Table 2, “Putative new transcripts”) and, therefore, are likely coding tran-scripts. Those transcripts referred to as non-redundant new transcripts (14,451 and 15,503 transcripts in S. sene-galensis v4 and S. solea v1, respectively; Table 2), based on the absence of orthologs in UniProtKB database, may rep-resent“new” proteins (or fragments) in sole.
A reference transcriptome for each sole species
The high number of assembled transcripts indicated an overestimation of sole transcriptomes when compared to other teleosts [24-26]. Probably, a certain number of transcripts could actually represent alleles, paralogs, fragmented transcripts, spliced forms, immature mRNAs and even a combination of them. Therefore, identifica-tion of representative transcripts from these transcrip-tomes would be a useful tool to be used as a reference for future gene expression studies. For this purpose, rep-resentative transcripts were selected from (i) the longest transcripts with unique, different orthologous ID and (ii) the putative, non-redundant new transcripts (Table 2). Hence, the reference transcriptome for S. senegalensis
(named S. senegalensis v4.1) consisted of 59,514 tran-scripts and the S. solea (named S. solea v1.1) reference transcriptome contained 54,005 transcripts (Table 2, last row). When useful reads (Additional file 1 and Table 1) were mapped onto these reference transcriptomes, 82.3-87.5% of reads were mapped onto transcripts, while 76.5-93.3% of transcripts received more than one read, suggesting that they represent adequately the tome. Additional verification of the reference transcrip-tomes (v4.1 and v1.1) was based on an orthology analysis using zebrafish (43,132 entries available in RefSeq and 42,555 in ENSEMBL). In S. senegalensis v4.1, 39,851 reference transcripts were found to be orthologs to 21,542 RefSeq and to 20,753 ENSEMBL zebrafish entries, and in S. solea v1.1 34,949 reference transcripts were found to be orthologs to 20,594 RefSeq and to 19,632 ENSEMBL zebrafish entries (Additional
file 3). These numbers suggest that a certain number of al-leles, immature mRNAs and lineage-specific genes (or even some non-detected chimeric assemblies) may have been in-cluded in the reference transcriptome. Moreover, since the number of RefSeq and ENSEMBL IDs nearly corresponds to half the number of sole transcripts, it is likely that both alleles for each gene were included in the sole reference transcriptomes. This hypothesis is also supported by the fact that most of the samples analyzed corresponded to wild animals or larvae, being mostly heterozygous. It is worth noting that the number of different zebrafish IDs in RefSeq or ENSEMBL (Additional file 3) is close to the ~21,000 genes recently reported for half-smooth tongue sole [26] and not so different from the 26,206 genes that have been recently reported in zebrafish [24,27]. Therefore, it can be suggested that most sole genes have been covered in the sole reference transcriptomes.
Figure 3 Screen captures of SoleaDB interface. A, illustration of the“Assemblies” tab containing all information about all transcriptome versions and subversions. B, capture of the part of the screen corresponding to the“Assembly info” tab where general information about the transcriptome as well as downloadable files and other useful tools can be found.
S. solea and S. senegalensis show clear functional similarity, are highly orthologous, and contain sole- and flatfish-specific transcripts
S. solea and S. senegalensis are two closely-related spe-cies with similar morphology (differing mainly in the pigmentation pattern of pectoral fin), ecology (they usu-ally live in sympatry in estuarine and coastal areas) and feeding habits and preys [35-37]. In silico genome com-parisons previously performed among fish species to identify orthologous gene groups identified a high per-centage of shared genes (90.5%) and only a small num-ber of species-specific gene families (ranging from 271 in tetraodontiformes to 601 in zebrafish) [26]. Therefore, a comparative analysis of sole transcriptomes could re-veal new clues about their biology and evolution and also can provide supporting evidence of reference tran-scriptome accuracies.
The 21.68% and 22.63% of annotation success in the S. senegalensis v4 and S. solea v1 transcriptomes, respectively, is in concordance with the analysis of Full-LengtherNext (Table 2,“Transcripts with ortholog”). Comparison of GO terms between the two sole species revealed that they were similar (Additional file 4). The highest number of anno-tated transcripts by biological process was associated with metabolic (15.2%) and cellular (22.2%) processes. By cellu-lar components, the most represented categories were cell (36.3%) and organelle (22.1%). By molecular function, the highest number of annotated transcripts was within the catalytic activity category (30.4%). Interestingly, the channel regulator and antioxidant activity categories were only rep-resented in S. senegalensis. In conclusion, both sole tran-scriptomes appear to be very similar from a biological and functional point of view.
Another comparison of sole transcriptomes was based on orthology with zebrafish. Figure 4 shows that 78,4% of orthologous transcripts in soles with an identified ortholog in zebrafish had a similarity ≥95% at the nu-cleotide level with 1,437 transcripts being 100% identical. As expected, transcripts without zebrafish orthology had a lesser degree of identity, as evidenced by the plateau at 92-96% identity (Figure 4). Interestingly, 41 transcripts without ortholog had the same sequence and 49 tran-scripts showed a 99% identity between the two sole spe-cies. All these data evidenced a high level of similarity between the two sole transcriptomes. Assuming that sole transcripts that share the same zebrafish ortholog could also be considered sole orthologs, a total of 39,851 refer-ence transcripts in S. senegalensis and 34,949 referrefer-ence transcripts in S. solea shared 17,562 IDs for RefSeq and 17,031 IDs for ENSEMBL, which clearly reflects the high level of orthology between these two sole species.
True orthologs between both sole species were ob-tained after performing a reciprocal Blast using the ref-erence transcriptomes. In this analysis, two transcripts
were considered as Blast-based, true orthologs when a highly restrictive reciprocal Blast (>97% identity) always resulted with their sequences giving the best score and E values [38]. A total of 26,291 reference transcripts of S. senegalensis were highly homologous to reference tran-scripts of S. solea, and 21,238 reference trantran-scripts of S. soleawere highly homologous to reference transcripts of S. senegalensis. Of these homologous sequences, only 11,953 could be considered as true, Blast-based ortho-logs (data not shown). These include 210 unannotated transcripts with an average length of 900 nt in S. senega-lensisand 1,199 nt in S. solea. More interestingly, 137 of them had a testcode ≥0.94, indicating that they likely code for a specialized protein (Additional file 5, “new-transcripts” tab). To confirm this hypothesis, they were compared to other fish proteins (Gadus morhua, Oryzias latipes, Oreochromis niloticus, Tetraodon nigroviridis, Gasterosteus aculeatus) and only 35 (25.5%) failed to find any orthology (Additional file 6). Moreover, 75 tran-scripts (54.7%) showed a clear ortholog only in the flat-fish C. semilaevis, suggesting that these they might represent flatfish-specific transcripts. In conclusion, 11,953 transcripts were identified as true, Blast-based orthologs between both sole species, from which 75 are likely to be flatfish-specific transcripts and 35 are puta-tive new sole transcripts.
Transcriptome comparison across teleosts revealed a set of lineage-specific genes
The 11,743 sole Blast-based orthologs with annota-tion (excluding the 210 unannotated transcripts, see above) were investigated based on their RefSeq and/or ENSEMBL ortholog for zebrafish. As shown in Figure 5, most Blast-based orthologs (93.8%) had a zebrafish ortholog. However, the most interesting finding is the small subset of sole orthologs lacking zebrafish similarity (Figure 5; 701 in S. senegalensis and 492 in S. solea, with 351 transcripts present in both species; Figure 5). Some of these transcripts without zebrafish ortholog were re-lated to the immune system such as hepcidin antimicro-bial peptides and some interleukins (e.g. IL11b, IL17A/ F-1, IL8, IL22, IL7). Hepcidins appear as a highly diversi-fied family in acanthopterygians (HAMP2-like group) that favoured the radiation of teleosts in marine and brackish environments [39,40]. Similarly, IL11b duplica-tion appeared later during evoluduplica-tion not occurring in zebrafish [41]. These data suggest that this subset of sole orthologs without zebrafish orthology might represent lineage-specific genes that have appeared, subfunctiona-lized or neofunctionasubfunctiona-lized later during teleost evolution. To check the presence of these transcripts in other tele-osts, proteins deduced from reference transcripts were compared (Additional file 6, “Annotated transcripts”), observing that most of them were also present in the C.
semilaevis genome (287; 81.8%). Only 18 transcripts (5.1%) lacked any orthology in the teleosts analyzed con-firming that this collection of transcripts could corres-pond to genes acquired or fixed during fish evolution (Additional file 5,“lineage-specific genes” tab).
Sole transcriptomes confirmed the retention of crystallin genes
Recently, it has been suggested that the visual system had evolved in relation to their benthic way of life [26]. This observation is based on the loss of genes related with vi-sion such as crystallins crybb2 and crybb3 in C. semilaevis [26]. Five crybb orthologs have been identified in S. sene-galensis and S. solea transcriptomes that grouped into
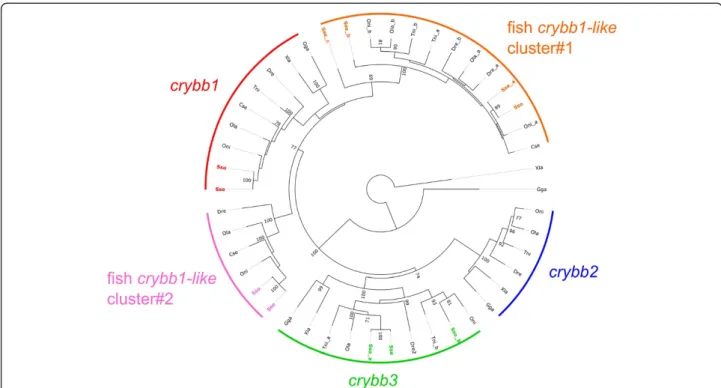
crybb1 and crybb3 clusters (with two distinct crybb3-en-coding transcripts in S. solea similarly to T. nigroviridis) and none to the crybb2 clade (Figure 6 and Additional file 7). Moreover, additional crybb-like transcripts could be grouped into two crybb1-related clusters that seem to be fish-specific sequences. Extension of the analysis to closely related crybb-like sequences revealed that additional crybb sequences exist in all three flatfish C. semilaevis (two se-quences), S. solea (two sequences) and S. senegalensis (four sequences). Moreover, EST sequence analysis from Atlantic halibut (Hippoglossus hippoglossus) suggested that this flat-fish also possesses crybb1, crybb2 and several crybb1-like sequences (X. Cousin, personal communication). Taken to-gether these results suggest that flatfish have indeed lost
Figure 4 Distribution of the level of similarity between both sole reference transcriptomes for those transcripts with (dark bars) or without (grey bars) a zebrafish ortholog.
Figure 5 Venn’s diagrams reflecting coincidences by Solea species among sole, Blast-based orthologs and transcripts with RefSeq/ ENSEMBL ortholog for zebrafish. Diagrams are comparing the 11,743 Blast-based orthologs with the unique zebrafish RefSeq identifiers in SoleaDB for S. senegalensis (39,851) and S. solea (34,949) and with the unique zebrafish ENSEMBL identifiers in SoleaDB for S. senegalensis (39,270) and S. solea (34.389). Within the Venn’s diagrams, the numbers refer to the amount of transcripts in SoleaDB for S. senegalensis (Sse) and S. solea (Sso), the number of transcript in SoleaDB with a zebrafish RefSeq identifier (R) of with a zebrafish ENSEMBL identifier (E).
and retained specifically some crybb genes likely as a conse-quence of independent events indicative of divergent evolu-tion and do not support a decay of the visual system as previously hypothesized in flatfish based on the set of crystallin-encoding genes [26].
Sole transcriptomes as a source of molecular markers
A transcriptome represents an important source of mo-lecular markers, mainly SSRs and SNPs. A total of 37 SSR markers in Senegalese sole derived from ESTs in public databases were applied to evaluate SSR evolution in flatfish species [13]. Sole transcriptomes described here will surely add more molecular markers suitable for a wide range of genetic applications. SSRs were deter-mined in the whole sole transcriptomes (S. senegalensis v4 and S. solea v1), the reference transcriptomes (S. sene-galensis v4.1 and S. solea v1.1) and the set of sole Blast-based orthologs (Table 3 and Additional file 8). It is noteworthy that in whole transcriptomes, dinucleotide repeats were the most abundant SSRs followed by tri-nucleotide repeats and tetra-tri-nucleotide repeats. Never-theless, the reference transcriptome was enriched in SSRs bearing a tri-nucleotide motif (Table 3). This differ-ence in motif abundance can be explained by the select-ive constraints imposed by protein-coding DNA, more
abundant in the latter transcriptome. In fact, di-nucleotide and tetra-nucleotide SSRs were mainly located in the UTR, whereas tri-nucleotides were in the ORF (Additional file 8). These results agree with genome-wide analyses that identified a bias distribution of tri- and hexa-nucleotide repeats in protein-coding exons of vertebrate, inverte-brates, plants and fungi [42,43]. The most common SSR motifs were AC/GT for di-nucleotides (74.6% in both sole species), AGG/CCT in S. senegalensis and AGC/GCT in S. soleafor tri-nucleotides (21.5 and 23.1% in S. senegalen-sisand S. solea, respectively), and AAAC/GTTT for tetra-nucleotides (17.4 and 15.6% in S. senegalensis and S. solea, respectively). Similar percentages were estimated for the reference transcriptome except for the fact that AGC/ GCT was more abundant than AGG/CCT. FISH analysis using GT, GTTA and GATA probes confirmed the relative abundance of these SSRs on the genome (Additional file 9). The AC/GT motif has been reported as the most frequent SSR repeat in the intergenic regions and introns of vertebrates [42,44]. The AC/TG motif has been identi-fied as the most frequent SSR in Roche/454 assembled se-quences of S. solea [20]. Also, G + C-rich tri-nucleotides (mainly in exons) and tetra-nucleotides with <50% of G + C (mainly in introns and intergenic regions) are characte-ristic of vertebrates [42]. It is worth mentioning the low
Figure 6 Phylogenetic tree of Crybb and Crybb-like proteins in vertebrates. A neighbor-joining tree based on the alignment of vertebrates Crybb and Crybb-like sequences was built. Species are indicated as Sse (Solea senegalensis), Sso (Solea solea) Dre (Danio rerio), Tni (Tetraodon nigroviridis), Oni (Oreochromis niloticus), Ola (Oryzia slatipes), Cse (Cynoglossus semilaevis), Xla (Xenopus laevis) and Gga (Gallus gallus; see Additional file 7 for accession numbers). Solea sequences are indicated according to the transcript name assigned in SoleaDB. Clusters are indicated as arcs of a circle. The tree obtained was rooted using Xenopus laevis Cryga. Numbers adjacent to nodes indicate percentage bootstrap support; only values larger than 70% (over 1,000 replicates) are shown.
representation of GATA repeats (<0.2% total repeat mo-tifs) confirmed by FISH analysis (Additional file 9). Com-parison of SSRs Blast-based orthologs in soles (Table 3 and Additional file 8) identified 6,596 sole-conserved SSRs in S. senegalensis and 6,772 in S. solea, out of which 1,273 and 4,803 SSRs in S. senegalensis and S. solea, respectively, can be considered species-specific as they were only found in the orthologs of only one species. This analysis provides new and very useful SSR markers for development of multiplex assays, genetic mapping and deciphering gen-ome evolution in flatfish as well as species identification in processed fish.
A total of 337,315 SNPs were identified in S. senegalensis and 381,404 in S. solea transcriptomes. A significant pro-portion of SNPs occurred in transcripts containing an ORF (109,235 [32.4%] and 115,746 [30.3%], respectively) with approximately half occurring within the ORF (53,265 and 46,599, respectively). These figures for SNP location in coding regions are similar to those found in other fish species ranging from 17.4 to 24.7% [45-47]. Although SNP prediction is only based on bioinformatic analysis and re-quires empirical validation to eliminate false positives and sequencing errors [45,48], these SNPs can also be used as a source of putative molecular markers.
Design and validation of an oligonucleotide microarray for S. senegalensis
Microarrays have become a cost-effective technique for gene expression profiling and whole-transcriptome studies
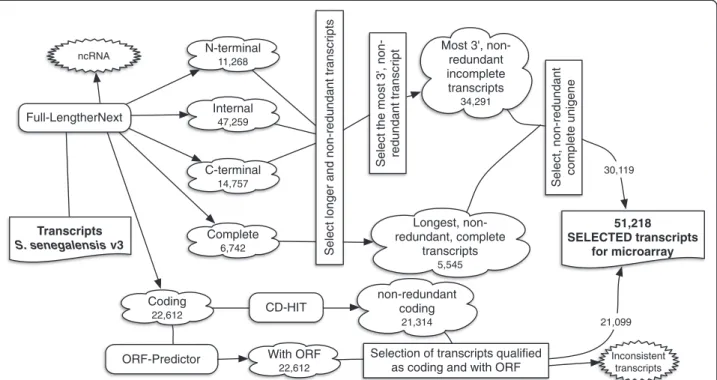
[7]. Two species-specific oligo-DNA microarrays have been reported in S. senegalensis and S. solea containing a limited number of unique transcripts due to the limited number of ESTs available in soles [19,20]. This limitation was compensated to some extent using heterologous mi-croarrays [49]. The sole transcriptomes described in this study have overcome these restrictions. The strategy to se-lect sole-specific probes is depicted in Figure 7. Briefly, the 5,545 complete non-redundant transcripts were added to the 34,291 longest, non-redundant, incomplete trans-cripts. Clustering them resulted in 30,119 longest, non-redundant transcripts (Figure 7) that were combined with 13,284 selected“Coding” transcripts, providing a total of 43,303 probes. The final panel of probes included genes related to reproduction, cell differentiation, response to stress, growth, biosynthetic and catabolic processes, trans-port, embryonic development and immune system, among other functions.
The microarray was tested with larvae incubated at two salinities (10 and 36 ppt). Hybridization signal was de-tected for 42,469 probes. A total of 2,816 probes were found differentially expressed (p <0.05) of which 2,641 were up-regulated and 175 down-regulated at 10 ppt com-pared to 36 ppt. Application of a cut-off value of log2 (expression ratio) > ±1 filtered 1,484 up-regulated and 61 down-regulated probes. The differentially expressed genes (DEGs) were involved in osmoregulation (including trans-porters and the renin-angiotensin system), inflammation and innate immune system (including cytokines and their receptors, genes of the complement and interferon ways, g-type lysozyme, prostaglandin biosynthesis path-way), chaperones, antioxidant enzymes, catabolic enzymes (several proteases, lipases and amylase), vitamin A and ret-inoic acid metabolism and scavenging and bone and cartil-age metabolism (biological significance of the results is beyond the scope of this article). To validate these results, a panel of 15 genes involved in different physiological functions were selected: ace2, agt and nkcc2 in osmoregu-lation; tf and fth in iron metabolism, hsp90aa, a stress chaperone; try1a, try2, ctr2, cela1 and cela4 in digestion; c3and lyg related to the innate immune system; tshb, a pi-tuitary regulator of pipi-tuitary-thyroid axis; and taldo, an en-zyme of the pentose phosphate pathway (Table 4). All the selected 15 DEGs selected in the microarray analysis were validated using qPCR. A correlation analysis between aver-age absolute fold-changes for all 15 genes showed a low Pearson’s correlation coefficient (r = 0.27) probably due to differences in fold-change between the two techniques used, but if c3 (the gene for which fold-change differences between microarray and qPCR were greater) was removed from the correlation analysis, the r value raised to 0.92. As a whole, these data indicate that the developed microarray was suitable to be applied in gene expression studies in S. senegalensis. Moreover, at least 42,469 probes of the
Table 3 SSR summary statistics for whole and reference transcriptomes
Type of SSR S. senegalensis S. solea
Whole transcriptome 266,434 316,388 Di-nucleotide 107,828 126,260 Tri-nucleotide 96,076 114,198 Tetra-nucleotide 39,102 44,118 Others 23,428 31,812 Reference transcriptome 49,955 67,610 Di-nucleotide 16,405 22,371 Tri-nucleotide 22,394 29,764 Tetra-nucleotide 6,935 8,829 Others 4,221 6,646 Blast-based orthologs 12,418 18,486 Species-specific SSR1 1,273 4,803 Conserved SSR 11,145 13,683
Same repeat motif2 6,596 6,772
Different repeat motif 4,549 6,911
Total number of SSRs and frequency according to their repeat motif are indicated.
(1)
SSRs present in one species but not in orthologs of the other species.
(2)
Exactly the same SSR repeat motif was found in both orthologs; in a few cases, SSR occurs once in one ortholog and twice in the other.
microarray provided repetitive and consistent positive hybridization signals.
Conclusions
De novo transcriptomes of S. solea and S. senegalensis covering their main developmental stages and organs were
described based on a combined assembly approach that can be applied to other transcriptomic studies. The huge volume of reads processed in each species (>1,800 millions, the highest number of reads reported to date for any or-ganism) produced a high number of transcripts that were mined to obtain a representative reference transcriptome
Transcripts S. senegalensis v3 Complete6,742 N-terminal 11,268 Internal 47,259 C-terminal 14,757 Coding 22,612 With ORF 22,612 ncRNA non-redundant coding 21,314 Inconsistent transcripts 51,218 SELECTED transcripts for microarray
Select the most 3', non- redundant transcript
Select, non-redundant complete unigene
Most 3', non-redundant incomplete transcripts 34,291 Longest, non-redundant, complete transcripts 5,545
Select longer and non-redundant transcripts
CD-HIT
as coding and with ORF ORF-Predictor
Full-LengtherNext
21,099 30,119
Figure 7 Schematic representation of the probe selection strategy for the construction of the Senegalese sole oligonucleotide microarray. The number of transcripts that resulted after the described filtration is indicated.
Table 4 Validation of microarray data using qPCR
Microarray qPCR
SoleaDBcode Gene Gene name FC p-value FC p-value
Unigene18736 Angiotensin I converting enzyme 2 ace2 4.5 <0.001 4.9 <0.05
Unigene49603 Angiotensinogen agt 3.5 <0.01 4.7 <0.05
Unigene39473 Na-K-Cl cotransporter2 nkcc2 2.5 <0.01 3.13 <0.01
Unigene252320 Transferrin tf 15.6 <0.001 10.5 <0.01
Unigene214993 Ferritin fth 2.1 <0.01 2.3 <0.05
Unigene39196 Heat shock protein 90-alpha hsp90aa 2.7 <0.01 2.3 <0.01
Unigene54412 Trypsinogen1a try1 17.6 <0.001 12.0 <0.001
Unigene31826 Trypsinogen2 try2 4.7 <0.001 7.8 <0.05
Unigene53434 Chymotrypsinogen2 ctr2 7.2 <0.001 6.3 <0.05
Unigene52166 Elastase1 cela1 8.7 <0.001 7.8 <0.05
Unigene53593 Elastase4 cela4 7.1 <0.001 4.6 <0.05
Unigene54920 Complement component C3 c3 3.8 <0.05 34.0 <0.05
Unigene53521 Lysozyme g lyg 2.5 <0.05 3.6 <0.05
Unigene219622 Thyroid stimulating hormone, beta tshb 2.5 <0.05 4.6 <0.001
Unigene52404 Transaldolase taldo 2.1 <0.05 2.5 <0.05
Fold-changes (FC) and p-values obtained for target genes by microarray and qPCR are indicated. Moreover, the transcript code in the SoleaDB for S. senegalensis v3 transcriptome is also shown. For qPCR, data were normalized to those of gapdh2 and referred to the calibrator group (36 ppt 3 DPH).
for each species. The organization and deposit of all this information at SoleaDB offers the scientific community a new powerful resource for the management of genomic information in soles. Transcriptome comparisons and orthology analyses showed that both species are highly homologous and even contain transcripts with the same sequence. Moreover, comparisons across teleost transcrip-tomes allowed for the identification of some subsets of transcripts considered as new, species-specific and flatfish-specific transcripts. Transcriptome analysis followed by a phylogenetic analysis confirmed the retention of crystallins crybb2and crybb3 confirming species-specific events dur-ing flatfish evolution. In conclusion, this study not only provided functional information about soles, but also pro-vides new tools to the scientific community in the form of a database, SSR and SNP markers, and a new microarray with 43,403 features in Senegalese sole.
Methods
Biological materials and sample preparation
To cover the most important developmental stages and physiological and environmental conditions in soles, li-braries were prepared using different technologies. A total of eight Roche/454 libraries were constructed mixing RNA from tissues related to the immune system (head kidney, spleen, gill, thymus and brain, obtained from 10 individuals stimulated using lipopolysaccharide, poly(I:C), peptidoglycan, zymosan A, and lipoteioic acid) [11], osmo-regulation (gills, intestine, kidney and brain of 18 individ-uals challenged to three different salinities), and gonads, hypothalamus and pituitary (from 18 sole male and fe-male wild-type and F1 broodstock; mean weight: fe-males: 1567.3 g ± 487.7 g; females: 1891.1 g ±573.3 g) (see Additional file 1,“454” tab). In this latter case, animals were classified according to their sex and origin (F1 or wild) and RNA samples were equally pooled separately for these conditions (F1 males, F1 females, wt males and wt females). Illumina libraries (see Additional file 1, “Illumina” tab) were prepared from larvae and embryos selected at different developmental stages (early and late gastrula, early neurula and early somitogenesis in em-bryos and S0-S4 in metamorphosis) and treated with 4-diethylaminobenzal dehyde, all-trans RA, TTNPB, DMSO and thiourea in S. solea and S. senegalensis. Moreover, some libraries were prepared from S. senegalensis larvae cultivated under different environmental and nutritional conditions and exposed to methimazole, mifepristone and iopanoic acid (see Additional file 1,“Illumina tab”).
Samples of larvae incubated at two salinities were pre-pared as follows. Fertilized eggs of Senegalese sole were collected from spontaneous spawns at “El Toruño” facil-ities (El Puerto de Santa María, Cádiz). Water temperature in the broodstock tanks during spawning was approxi-mately 18.5°C and salinity 34 ppt. Eggs were transferred to
a 1,000 ml measuring cylinder to separate buoyant (viable) from non-buoyant (non-viable) eggs and the number in each fraction was estimated using volumetric methods (1,100 eggs ml−1). After estimating the number of fertilized eggs, embryos were incubated (at the gastrula stage) in 15 l cylinder tanks at an initial density of 2,000 embryos l−1. After seeding, two salinities (10 and 36 ppt) were estab-lished using a recirculation system that kept constant temperature (20°C ±0.5) and target salinity. Water turn-over was maintained at one total renewal per hour during the experiment. Trial was done in triplicate tanks for each salinity. After hatching, larvae were sampled at day 3 using a 350 μm-mesh net. One pool of larvae were collected from each tube (~100 larvae/pool and n = 3 for each condi-tion), washed with DEPC water, frozen directly in liquid nitrogen and stored at −80°C until analysis. The experi-mental procedures comply with the Guidelines of the European Union Council (86/609/EU) and IFAPA and IFREMER (17–010) rules for the use of animals in research.
RNA Isolation, library preparation and NGS analysis
Homogenization of tissues, including juvenile organs and the pools of larvae and embryos was carried out in the Fast-prep FG120 instrument (Bio101) using Lysing Matrix D (Q-Bio- Gene) for 40 s at speed setting 6. To-tal RNA was isolated from 50 mg of tissues or pools of embryos and larvae using the RNeasy Mini Kit (Qiagen). RNA integrity was further investigated using the Bio-analyzer 2100 (Agilent Technologies) before preparation of Roche/454 and Illumina libraries. The Roche/454 li-braries were normalized, processed and sequenced by the Unitat de Genòmica (CCiT-UB, Barcelona, Spain) as described previously [22,50]. Illumina libraries were constructed at the Centre Nacional d’Anàlisi Genòmica (Barcelona, Spain) for S. senegalensis using mRNA-Seq sample preparation kit and MGX platform (Montpellier, France) for S. solea using TruSeq RNA Sample Prepar-ation Kit v2, in both cases according to manufacturer’s protocols. Briefly, 0.5μg of total RNA was used for poly-A based mRNpoly-A enrichment selection using oligo-dT magnetic beads followed by fragmentation by divalent cations at elevated temperature resulting into fragments of 80–250 nt, with the major peak at 130 nt. First strand cDNA synthesis by random hexamers and reverse tran-scriptase was followed by the second strand cDNA syn-thesis performed using RNAseH and DNA Pol I. Double stranded cDNA was end repaired, 3´adenylated and the 3´-“T” nucleotide at the Illumina adaptor was used for the adaptor ligation. The ligation product was amplified with 15 cycles of PCR. Each library was sequenced using TruSeq SBS Kit v3-HS, in paired end mode, 2 × 76 bp (Solea senegalensis) and 2 × 100 bp (Solea solea), in a fraction of a lane (1/6 or 2/13 for S. senegalensis and 1/7
for S. solea) of a HiSeq2000 sequencing system (Illumina, Inc) following the manufacturer’s protocol, generating minimally 15 million paired-end reads for each sample. Images from the instrument were processed using the manufacturer’s software to generate FASTQ sequence files.
Pre-processing and assembly
The detailed strategy for transcriptome pre-processing and assembly is depicted in Figure 1. Roche/454 long-reads and Illumina short-long-reads were pre-processed using SeqTrimNext pipeline (http://www.scbi.uma.es/ seqtrimnext [51]) available at the Plataforma Andaluza de Bioinformática (University of Málaga, Spain) using the specific NGS technology configuration parameters. This pre-processing removes low quality, ambiguous and low complexity stretches, linkers, adaptors, vector fragments, organelle DNA, polyA/polyT tails, and con-taminated sequences while keeping the longest inform-ative part of the read. SeqTrimNext also served to discard sequences below 20 (short reads) or 40 bp (long reads).
The assembly strategy used follows the rationale that not a single assembler is satisfactory and, consequently, that two different algorithms (and/or parameter sets) should be used. Here MIRA3 (based on overlap-layout-consensus algorithm [52]) and Euler-SR (based on a strict de Bruijn graph analyzed by an Eulerian path [53]) were used. For S. senegalensis, Roche/454 long-reads were pre-assembled using MIRA3 with 454 settings. The same long reads were also assembled using Euler-SR with the default parameters and a k-mer = 29 (maximum length allowed). To remove artifactual sequences, con-tigs (consensus sequences) obtained using Euler-SR were mapped with the original reads using Bowtie2 [54] allow-ing 2 mismatches to confirm the goodness of the final consensus. Unmapped contigs were considered a sign of misassembling and were submitted to Full-LengtherNext (see below) analysis to recover putative coding sequences. Illumina short-reads were pre-assembled using Oases (based on de Bruijn graphs [55]) with two k-mers: a small k-mer to recover lowly-expressed transcripts and a big k-mer for recovering highly-expressed transcripts since the use of multiple k-mers is reported to improve the qua-lity and good performance of de novo assembling. k-mers from 19 to 69 were scanned in both species in seek of those that produce the lesser number of artifacts and the highest number of annotated transcripts (results not shown). As a result, 23 and 47 were used for S. senegalen-sis, and 25 and 69 for S. solea. Processed single reads and paired reads were assembled independently, providing dis-tinct contig sets using a static coverage cutoff of 3. For computing efficiency and accuracy, the redundant and nested contigs were clustered using CD-HIT [56] at 99%
identity, recovering only the longest contigs. After that, an in-house script was used to discard misassembled contigs based on the presence of exact, internal, direct or inverse repetitions. Pre-assemblies were finally reconciled using CAP3 with default parameters to provide the maximal set of transcripts for each transcriptome.
Transcriptome annotation
Transcripts were annotated using Sma3s [38] with de-fault parameters and the vertebrate division of Uni-ProtKB to provide gene description, GO terms, EC keys, KEGG maps and InterPro codes for every sequence. AutoFact [57] was used as a second gene description ap-proach based on gene and EST databases. Orthology to zebrafish was determined using blastx with sole tran-scripts and the information available in ENSEMBL v72 and RefSeq at the time of writing (1/27/14), filtering for E<10−10and a minimal identity of 30%.
Transcripts were also analyzed with Full-LengtherNext (http://www.scbi.uma.es/fulllengthernext [58]) available at the Plataforma Andaluza de Bioinformática (University of Málaga, Spain) to provide a third gene description, as well as additional information about transcripts containing full-length ORFs, identification of ncRNAs, and tran-scripts with a putative start and stop codons and a pre-dicted amino-acid sequence. Moreover, this software was used to remove or split chimeric transcripts providing a quick preview of the transcriptome and extracting the minimum set of transcripts that can be considered a refer-ence transcriptome. Finally, putative SSRs were detected using Mreps (http://bioinfo.lifl.fr/mreps/ [59]) with default parameters counting repeats whose period was at least 2 and size at least 12 and a coverage of up to 1000 reads. The putative collection of SNPs was obtained mapping the original reads using Bowtie2 to the corresponding tran-scriptome and then analyzing the resulting SAM files with SAMtools [60] as described in http://samtools.sourceforge. net/mpileup.shtml.
To map SSRs on the genome, we performed FISH ana-lyses. Chromosome preparations, probe amplifications and FISH hybridization conditions were as previously re-ported [18,61,62].
Database architecture
SoleaDB was built using Ruby On Rails 2.0 (http://rubyon rails.org/) that allows the use of a model-view-controller pattern to maintain strict separation between the web interface (views) code, database tables (models), and all methods that handle interactions between views and data-base (controllers), as well as testing and production envi-ronments for each development phase of the database. The database tables were implemented in MySQL. Bulk imports, updates, and database managements were auto-mated by means of Ruby scripts. An autoauto-mated pipeline
that combines all tools described above is executed on every SoleaDB update. SoleaDB can be browsed, retrieved and downloaded at http://www.juntadeandalucia.es/agri culturaypesca/ifapa/soleadb_ifapa/.
Microarray design
The microarray probes were designed following the work-flow in Figure 7. The 252,416 transcripts of S. senegalensis v3 were analysed based on the Full-LengtherNext status provided for this transcriptome (available in SoleaDB). Transcripts qualified as N-terminal, internal or C-terminal were clustered by sequence to obtain the longest, non-redundant transcript that expands the maximum possible to the 3’-end that enable the design of specific probes in the fast evolving 3’-UTR region [19]. Complete transcripts follow a similar reduction step but the criteria for repre-sentative transcript selection is based only on their length. Then, both collections were combined and clustered to provide the set of longest, non-redundant, annotated transcripts. Since the Agilent eArray (https://earray.chem. agilent.com/earray/) panel was limited to 45,220 60-mer probes and required the inclusion of 1,417 Agilent con-trols and 400 features corresponding to replicate probes of putative housekeeping genes (40 × 10), 13,881 additional probes were selected from the set of 21,099“Coding” tran-scripts predicted with Full-lengtherNext and OrfPredictor [63] after removal of redundant sequences and sorting by testcode index. Since the resulting number clearly over-loaded the microarray capacity (51,218 transcripts), these transcripts were sorted according to their testcode index. Then, all the selected transcripts were divided into 8 cat-egories according to Blast2go, Sma3 and AUTOFACT an-notations. Those probes that did not satisfied the quality criteria for cross-hybridization (BC3 and BC4) were then discarded and replaced by new transcripts until the total number of probes required for the design of a 4 × 44 for-mat microarray was reached. As a result, the final micro-array included a total of 45,220 probes, 43,403 specific for S. senegalensis,1,417 Agilent controls, and 400 probes cor-responding to replicates of putative housekeeping genes (40 × 10). The design of the array is stored in the NCBI Gene Expression Omnibus (GEO) database under acces-sion GPL18543.
Microarray hybridization and qPCR validation
RNA labeling, hybridizations, scanning and data process-ing were performed accordprocess-ing as previously described using the Agilent One-Color Microarray-Based Gene Ex-pression analysis (Low Input Quick Amp Labeling kit) along with Agilent One-color RNA SpikeIn kit [64]. Four pools of larvae incubated at 10 and 36 ppt were analyzed in two 4 × 44 chips. qPCR procedure for microarray valid-ation was performed as previously described [10,65-67]. Three pools of larvae incubated at 10 and 36 ppt at day 3
were analyzed. Real-time analysis was carried out on a CFX96™ Real-Time System (Bio-Rad) using Senegalese sole specific primers (Additional file 10). Real-time reac-tions were performed in duplicate containing cDNA gen-erated from 10 ng of original RNA template, 300 nM each of specific forward and reverse primers, and 5 μl of iQ™ SYBR Green Supermix (Bio-Rad) in a 10μl final volume. The amplification protocol used was as follows: initial 7 min denaturation and enzyme activation at 95°C, 40 cycles of 95°C for 15 s and 70°C for 30 s. Each PCR assay was performed in duplicate. For normalization of cDNA load-ing, all samples were run in parallel with the reference gene glyceraldehyde-3-phosphate dehydrogenase (gapdh2). Rela-tive mRNA expression was determined using the 2-(ΔΔCt) method [68]. Results were expressed as mean ± SEM. A Welch t-test was performed using GraphPad Prism v5 and significance was accepted at p <0.05.
Availability of supporting data
All 454 and Illumina data have been deposited in the Se-quence Read Archive (SRA) database with bioproject numbers PRJNA255461 (http://www.ncbi.nlm.nih.gov/ bioproject/255461), PRJNA241068 (http://www.ncbi.nlm. nih.gov/bioproject/241068) and PRJNA261151 (http:// www.ncbi.nlm.nih.gov/bioproject/261151) for S. senega-lensis and PRJNA261810 for S. solea (http://www.ncbi. nlm.nih.gov/bioproject/261810). Microarray hybridization data have been deposited in NCBI’s Gene Expression Omnibus and are accessible through GEO Series acces-sion number GSE57173 (http://www.ncbi.nlm.nih.gov/ geo/query/acc.cgi?acc=GSE57173). Additional information about the SSR codes for selected Illumina data used for transcriptome assembly in S. senegalensis is also included in the Additional file 1.
Additional files
Additional file 1: Main characteristics of Illumina and 454 libraries used in this study. Experimental conditions, accession numbers, input reads and main cleaning results are indicated.
Additional file 2: Assembly summary of useful reads (see Table 1) following the workflow depicted in Figure 1.
Additional file 3: Annotation of the sole reference transcriptomes with zebrafish orthologs using RefSeq and ENSEMBL IDs. Sse/Sso: number of transcript identifiers in the reference transcriptome of S. senegalensis (Sse) or S. solea (Sso). R: number of transcript identifiers of the reference transcriptome with a RefSeq ID. E: number of transcript identifiers of the reference transcriptome with an ENSEMBL ID. Additional file 4: GO distribution according to biological process (A), cellular component (B) and molecular function (C) in both sole transcriptomes.
Additional file 5: Transcripts identified as new and species-specific genes. The transcript code, length and test code as well as orthologous Ensembl ID in cod, medaka, tilapia, tetraodon, stickleback and contig in tongue sole are indicated.
Additional file 6: Blast-based homology analysis of sole orthologs without orthology with zebrafish when compared to reference
proteins from other teleosts extracted from ENSEMBL (as is on March 1st 2014), and to the genomic sequences of C. semilaevis from GenBank (as is on March 1st 2014).
Additional file 7: Methodology and accession number for sequences used in Crybb phylogeny.
Additional file 8: SSR statistics. Main figures for whole and reference transcriptomes as well for orthologs are indicated. The total number of transcripts and SSRs and their abundance according to the type of repeat unit and their location (UTR or ORF) are shown. Also, the list of transcript and orthologs bearing SSR are indicated.
Additional file 9: FISH signals of (GT)n(A), (GTTA)n(B), and (GATA)n
(C) probes in a metaphase of S. senegalensis.
Additional file 10: List of primers used to validate the microarray.
Competing interests
The authors declare that they have no competing interests. Authors’ contributions
HB, RB, NFP and DGF processed the NGS data for cleaning, and assembly. They also designed SoleaDB and transcriptome annotation and in silico comparisons. PA and MP did larval experiments, collected samples and prepared RNA for Illumina sequencing in S. senegalensis. CI collected samples for osmoregulatory and immune related organs and isolated RNA for preparing 454 libraries. JLZ, DM and XC did larval experiments, collected samples and prepared RNA for Illumina sequencing in S. solea. XC also carried out the phylogenetic analyses and drafted the manuscript. MR and DC prepared samples related to gonads in S. senegalensis and did the microarray hybridizations. SN and MG performed Illumina libraries sequencing for S. solea and S. senegalensis, respectively. MAM carried out FISH analysis. MLB, JVP and LR participated in the study design, supervised samples preparation, coordinated activities and helped to draft the manuscript. MM designed the study, designed the microarray probes, coordinated activities and drafted the manuscript. MGC supervised the bioinformatic analysis and drafted the manuscript. All authors read and approved the final manuscript.
Acknowledgements
This study has been funded by project AQUAGENET (SOE2/P1/E287) program INTERREG IVB SUDOE and European Regional Development Fund (FEDER /ERDF) and P10-CVI-6075 from Junta de Andalucía. PA is supported by a PhD fellowship of IFAPA (Consejería de Agricultura y Pesca de la Junta de Andalucía) and funded by the Operational Program of European Social Fund 2007–2013 of Andalucía, within the priority axis 3 (Expand and improve investment in human capital) in 80%. MR was supported by the AQUAGENET project. The authors also thankfully acknowledge the computer resources and the technical support provided by the Plataforma Andaluza de Bioinformática of the University of Málaga.
Author details
1Departamento de Biología Molecular y Bioquímica, Facultad de Ciencias,
Campus de Teatinos s/n, Universidad de Málaga, 29071 Málaga, Spain.
2Plataforma Andaluza de Bioinformática, Universidad de Málaga, Edificio de
Bioinnovación, C/ Severo Ochoa 34, 29590 Málaga, Spain.3IFAPA Centro El Toruño, IFAPA, Consejeria de Agricultura y Pesca, 11500 El Puerto de Santa María, Cádiz, Spain.4IFREMER, Laboratoire d’Ecotoxicologie, Place Gaby Coll, BP 7, 17137 L’Houmeau, France.5INRA LPGP, Campus de Beaulieu, 35042
Rennes, France.6Departament de Fisiologia i Immunologia, Facultat de Biologia, Universitat de Barcelona and Institut de Biomedicina de la Universitat de Barcelona (IBUB), 08028 Barcelona, Spain.7Laboratorio de Genética. Facultad de Ciencias del Mar y Ambientales, Universidad de Cádiz, Polígono del Río San Pedro, Puerto Real, 11510 Cádiz, Spain.8IFREMER, Unit of Functional Physiology of Marine Organisms, Ifremer, UMR 6539 LEMAR, 29280 Plouzané, France.9Fitoplanton Marino, S.L. Dársena Comercial s/n (Muelle Pesquero), 11500 El Puerto de Santa María, Cádiz, Spain.
10
MGX-Montpellier GenomiX c/o Institut de Genomique Fonctionnelle, 141 rue de la Cardonille, 34094 Montpellier, France.11Centro Nacional de Análisis
Genómico, Parc Científic de Barcelona, c/Baldiri Reixac 4, 08028 Barcelona, Spain.
Received: 30 April 2014 Accepted: 15 October 2014 Published: 3 November 2014
References
1. Mollet FM, Kraak SBM, Rijnsdorp AD: Fisheries-induced evolutionary changes in maturation reaction norms in North Sea sole Solea solea. Mar Ecol Prog Ser 2007, 351:189–199.
2. Cuveliers EL, Volckaert FA, Rijnsdorp AD, Larmuseau MH, Maes GE: Temporal genetic stability and high effective population size despite fisheries-induced life-history trait evolution in the North Sea sole. Mol Ecol Notes 2011, 20(17):3555–3568.
3. APROMAR: La Acuicultura Marina en España. 2012.
4. Cañavate JP: Opciones del lenguado senegalés Solea senegalensis Kaup, 1858 para diversificar la acuicultura marina. Bol Inst Esp Oceanogr 2005, 21:147–154.
5. Schmidt G, Espinos F, Ruiz F, Segarra M, Mañanos E, Muñoz JL, Soler E, Chirivella J, Dove C, Barrera R, Lacomba T, Balach S, Santiago JM, Ambrosio L, López J, Ojeda J: Diversification in Aquaculture: A Tool for Sustainability. Madrid: Spanish Ministry of Environmental, Rural and Marine Affairs, Publications Centre; 2011.
6. Guzman JM, Ramos J, Mylonas CC, Mañanos EL: Comparative effects of human chorionic gonadotropin (hCG) and gonadotropin-releasing hormone agonist (GnRHa) treatments on the stimulation of male Senegalese sole
(Solea senegalensis) reproduction. Aquaculture 2011, 316:121–128. 7. Cerda J, Manchado M: Advances in genomics for flatfish aquaculture.
Genes Nutr 2013, 8(1):5–17.
8. Manchado M, Infante C, Asensio E, Cañavate JP, Douglas SE: Comparative sequence analysis of the complete set of 40S ribosomal proteins in the Senegalese sole (Solea senegalensis Kaup) and Atlantic halibut (Hippoglossus hippoglossus L.) (Teleostei: Pleuronectiformes): phylogeny and tissue- and development-specific expression. BMC Evol Biol 2007, 7:107.
9. Matsuoka MP, Infante C, Reith M, Cañavate JP, Douglas SE, Manchado M: Translational machinery of senegalese sole (Solea senegalensis Kaup) and Atlantic halibut (Hippoglossus hippoglossus L.): comparative sequence analysis of the complete set of 60s ribosomal proteins and their expression. Mar Biotechnol 2008, 10(6):676–691.
10. Infante C, Matsuoka MP, Asensio E, Cañavate JP, Reith M, Manchado M: Selection of housekeeping genes for gene expression studies in larvae from flatfish using real-time PCR. BMC Mol Biol 2008, 9:28.
11. Ponce M, Salas-Leiton E, Garcia-Cegarra A, Boglino A, Coste O, Infante C, Gisbert E, Rebordinos L, Manchado M: Genomic characterization, phylogeny and gene regulation of g-type lysozyme in sole (Solea senegalensis). Fish Shellfish Immunol 2011, 31(6):925–937.
12. Funes V, Zuasti E, Catanese G, Infante C, Manchado M: Isolation and characterization of ten microsatellite loci for Senegal sole (Solea senegalensis Kaup). Mol Ecol Notes 2004, 4:339–341.
13. Molina-Luzon MJ, Lopez JR, Navajas-Perez R, Robles F, Ruiz-Rejon C, De La Herran R: Validation and comparison of microsatellite markers derived from Senegalese sole (Solea senegalensis, Kaup) genomic and expressed sequence tags libraries. Mol Ecol Resour 2012, 12(5):956–966.
14. Chen S-L, Shao C-W, Xu G-B, Liao X-L, Tian Y-S: Development of 15 novel dinucleotide microsatellite markers in the Senegalese sole Solea senegalensis. Fisheries Sci 2008, 74:1357–1359.
15. De La Herran R, Robles F, Navas JI, Hamman-Khalifa AM, Herrera M, Hachero I, Mora MJ, Ruiz-Rejon C, Garrido-Ramos M, Ruiz-Rejon M: A highly accurate, single PCR reaction for parentage assignment in Senegal sole based on eight informative microsatellite loci. Aquaculture Res 2008, 39:1169–1174. 16. Garoia F, Marzola S, Guarniero I, Trentini M, Tinti F: Isolation of polymorphic
DNA microsatellites in the common sole Solea vulgaris. Mol Ecol Resour 2006, 6(1):144–146.
17. Diopere E, Hellemans B, Volckaert FA, Maes GE: Identification and validation of single nucleotide polymorphisms in growth- and maturation-related candidate genes in sole (Solea solea L.). Mar Genomics 2013, 9:33–38.
18. Garcia-Cegarra A, Merlo MA, Ponce M, Portela-Bens S, Cross I, Manchado M, Rebordinos L: A preliminary genetic map in Solea senegalensis (Pleuronectiformes, Soleidae) using BAC-FISH and next-generation sequencing. Cytogenet Genome Res 2013, 141(2–3):227–240.
19. Cerda J, Mercade J, Lozano JJ, Manchado M, Tingaud-Sequeira A, Astola A, Infante C, Halm S, Vinas J, Castellana B, Asensio E, Cañavate P,