C.PLATTEAU,T.CUCU,R.DOBSON,S.FOURDRILIS,C.BOURGEON, D.EBO,M.DE LOOSE,I.TAVERNIERS,E.DAESELEIRE,
B.DE MEULENAER,B.DEVREESE,E.DE PAUW, G.MAGHUIN-ROGISTER,M.-L.SCIPPO,W.STEVENS,C.BRIDTS
AGRO-FOOD
(SSD)
FINAL REPORT
Development of an integrated strategy for controlling the allergen issue in the Belgian food and catering industry
ALLERRISK SD/AF/03
Promotors
Marc De Loose, Els Daeseleire, Isabel Taverniers, Céline Platteau Institute for Agricultural and Fisheries Research (ILVO)
Technology and Food Science Unit
Burgemeester Van Gansberghelaan 115-2, 9820 Merelbeke
Bruno De Meulenaer, Bart Devreese, Tatiana Cucu Ghent University
Unit Food Chemistry and Human Nutrition Laboratory of Protein Biochemistry
Coupure Links 653, 9000 Ghent
Edwin De Pauw, Guy Maghuin-Rogister, Marie-Louise Scippo, Rowan Dobson, Séverine Fourdrilis, Cédric Bourgeon
University Liege
Centre for Analysis of Residues in Traces (CART) Institut de Chimie, Bat. B6c,4000 Liège (Sart-Tilman)
Wim Stevens, Didier Ebo, Chris Bridts University of Antwerp
Dept. Immunology, Allergology, Rheumatology Campus Drie Eiken, Universitieitsplein 1, 2610 Antwerpen
Authors
Céline Platteau, Tania Cucu, Rowan Dobson, Séverine Fourdrilis, Cédric Bourgeon, Didier Ebo, Marc De Loose, Isabel Taverniers, Els Daeseleire, Bruno De Meulenaer, Bart Devreese, Edwin De Pauw, Guy
D/2011/1191/17
Published in 2011 by the Belgian Science Policy Avenue Louise 231 Louizalaan 231 B-1050 Brussels Belgium Tel: +32 (0)2 238 34 11 – Fax: +32 (0)2 230 59 12 http://www.belspo.be
Contact person: Christine Mathieu +32 (0)2 238 34 93
Neither the Belgian Science Policy nor any person acting on behalf of the Belgian Science Policy is responsible for the use which might be made of the following information. The authors are responsible for the content.
No part of this publication may be reproduced, stored in a retrieval system, or transmitted in any form or by any means, electronic, mechanical, photocopying, recording, or otherwise, without indicating the reference :
C. Platteau, T. Cucu, R. Dobson, S. Fourdrilis, C. Bourgeon, D. Ebo, M. De Loose, I.Taverniers, E. Daeseleire, B. De Meulenaer, B. Devreese, E. De Pauw, G. Maghuin-Rogister, M.-L. Scippo, W. Stevens, C. Bridts. “Development of an integrated strategy for controlling the allergen issue
in the Belgian food and catering industry ALLERRISK”. Final Report. Brussels : Belgian Science
TABLE OF CONTENT
SUMMARY ... 5
1 INTRODUCTION ... 9
2 METHODOLOGY AND RESULTS ... 11
2.1 EVALUATION OF PROTEIN AND DNA ISOLATION PROTOCOLS ... 11
2.1.1 Functional evaluation of protein isolation protocols ... 11
2.1.2 Evaluation of DNA isolation protocols ... 14
2.2 EVALUATION OF THE ANALYTICAL PERFORMANCE AND ROBUSTNESS OF ELISA AND PCR ... 18
2.2.1 Evaluation of commercial ELISA kits ... 19
Sensitivity ... 19
Specificity ... 21
2.2.2 Evaluation of new and commercial real-time PCR assays ... 23
Sensitivity ... 23
Specificity ... 24
2.2.3 Impact of food processing simulating reactions on the detectability by commercial ELISA ... 28
Maillard reaction... 29
Protein oxidation ... 35
Protein hydrolysis ... 44
2.2.4 Detection of hazelnut in food model systems by ELISA and PCR ... 47
2.3 MASS-SPECTROMETRIC STUDY OF CHANGES IN ALLERGEN PROTEINS BY APPLICATION OF CONTROLLED CHEMICAL REACTION ... 54
2.4 DEVELOPMENT AND EVALUATION OF NEW ANALYTICAL ASSAYS ... 60
2.4.1 Development of real-time PCR assays for detection of hazelnut and soybean ... 60
2.4.2 Development of a competitive ELISA for hazelnut detection in foods ... 62
Preparation of the immunogen ... 63
Immunization of chickens ... 63
Isolation of antibodies from the egg yolk ... 63
Screening of the antibody’s activity using indirect ELISA ... 64
Indirect competitive ELISA ... 64
Cross reactivity studies ... 66
Recovery studies ... 68
2.4.3 Development of a mass-spectrometric method for the detection of hazelnut allergens ... 71
Detection of hazelnut allergens ... 71
Choice of allergen ... 73
Choice of peptides ... 74
Choice of transitions ... 75
Analysis of food processing imitation samples ... 77
Optimisation: comparison of the use of the two selected peptides ... 79
Analysis of home-made cookies spiked at 160 ppm ... 80
2.4.4 Development of a mass-spectrometric method for quantification of hazelnut allergens... 80
Heavy peptide transitions ... 80
Quantification with real samples ... 81
2.4.5 Development of a mass-spectrometric method for the detection of soybean allergens ... 83
Soybean allergens detected (nanoLC ESI IT) ... 83
Choice of allergen ... 84
Comparison of the chosen transitions from the peptides from β conglycinin α chain
and glycinin G1 ... 85
Choice of transitions ... 87
Analysis of food processing imitation samples ... 91
2.4.6 Development of a mass-spectrometric method for quantification of soybean allergens ... 92
Comparison of uncooked and baked cookies spiked with increasing amounts of soy protein extract before baking ... 92
Analysis of other real samples ... 94
2.5 DETECTION OF HAZELNUT ALLERGENS IN A STANDARDIZED FOOD MATRIX: LESSONS FROM THE BASOPHIL ACTIVATION TEST. ... 94
3 POLICY SUPPORT ... 97
4 DISSEMINATION AND VALORISATION ... 99
4.1 POSTER PRESENTATIONS ... 99 4.2 ORAL PRESENTATIONS ... 100 5 PUBLICATIONS ... 101 5.1 PEER REVIEWED ... 101 5.2 OTHER... 102 6 ACKNOWLEDGEMENTS ... 103 7 REFERENCES ... 105
SUMMARY
The principal goal of this study was to evaluate different methodologies for allergen detection in food and develop new, improved assays.
In this study we linked the results of the bio-analytical evaluations to the clinical impact for the allergic patient. Therefore, it was important that the bio-analytes used for the studies were clinically relevant, i.e. containing the relevant allergens and in a form being able to provoke an allergic response. Evaluation of different hazelnut protein isolation protocols highlighted the relevance of applying protease-inhibitors during the extraction procedure to preserve the proteins in their native conformation.
The investigated commercial ELISA‟s showed a lower analytical sensitivity than indicated by the manual. The hazelnut kits were able to detect 1 ppm of defatted hazelnut powder in food model systems, corresponding to about 2,6 ppm hazelnut. The evaluated PCR assays for hazelnut detection showed a positive result for all replicates tested starting from 100 ppm defatted hazelnut flour in the food model systems. The lower sensitivity of the real-time PCR detection platform is probably related to the lower abundance of DNA as target analyte compared to the proteins targeted in ELISA, rather than being inhering to the PCR assay itself. The selected DNA isolation protocol yielded DNA of good quality with respect to the purity and integrity of the DNA. High purity has often a negative impact on the yield. Perhaps the sensitivity of the PCR platform could be increased by applying a DNA isolation protocol returning a higher yield. Our results also confirm that a higher sensitivity is generally associated with a lower specificity, as observed for the commercial ELISA assays for hazelnut and soy evaluated in this project.
Food processing simulating reactions had a severe impact on proteins. As a result of the Maillard reaction, increases in protein bound carbonyls, losses of available lysine residues and severe aggregation was observed. Due to oxidation, either lipid- or hypochlorous acid-induced, modification of essential amino acid was observed linked to an increase in protein bound carbonyls and severe protein aggregation. Further, partial peptic hydrolysis led to almost complete hydrolysis of the hazelnut proteins while the soybean proteins were more stable as evidenced by increases in the free amino groups and the non-protein nitrogen fraction. Despite these severe changes on protein level, several peptides derived from hazelnut and soybean proteins remained stable. Peptides derived from the Cor a 9 allergen from hazelnut and the Gly m 5 and Gly m 6 from soybean were shown to be the most stable as compared to other allergens. These stable peptides could serve as analytical targets for the development of new robust analytical approaches for detection of undeclared allergens in especially highly processed foods.
Further, both the ELISA and real-time PCR detection platform were susceptible to food processing and suffered from interference of the matrix. This was also evidenced by studying the impact of food processing simulation reactions on the detection of hazelnut and soy by commercial ELISA kits, where the observed impact on the detectability was highly dependent on the ELISA kit used. Based on the obtained results it cannot be concluded whether DNA is less susceptible to food processing than proteins, as is often stated. Only a semi-quantitative comparison could be made between both detection platforms, indicating that the impact of food processing was highly variable between the different assays from both types of detection methods.
The commercial ELISA‟s proved to fail detecting or correctly quantifying the (processed) proteins possibly because the antibodies used for their development are generated against native proteins and their reactivity towards the modified proteins is decreased because the specific epitopes are altered during food processing. Therefore, new ELISA assays were developed using antibodies against modified protein extracts. The newly developed ELISA‟s showed high specificity towards the modified hazelnut and soybean, with relatively low specificity towards the native ones and without any additional cross reactivity with other nuts or legumes. The robustness of the developed ELISA‟s was assessed in in-house baked cookies spiked at different levels. Upon spiking of the blank cookies before the extraction, an extensively used approach for the assessment of the robustness of the ELISA, high recoveries were obtained for a wider range of spiking levels. However, upon spiking before baking, low recoveries were obtained probably due to decreased extractability of the antigen from the processed food. A comparison of the performance of the ELISA using antibodies against modified protein extract with a new ELISA against Kunitz trypsin inhibitor (reported stable protein) was made. This showed that using antibodies developed towards allergens modified through food processing simulating reactions is a better approach to be used in food allergen detection.
Target peptides specific of major soy and hazelnut allergens were chosen in the aim of developing a quantitative mass spectrometry-based method to detect trace amounts of allergens in food. For hazelnut, a method for the detection and quantification of 11S globulin-like protein (Cor a 9) in food has been developed. Semi-quantification of Cor a 9 was carried out in shop-bought chocolate and cookies and in home-made cookies. This is the first mass spectrometric method for the detection and semi quantification for Cor a 9. For soy, two calibration curves consisting of either uncooked or baked cookies spiked with increasing amounts of soybean protein extract were constructed. The limit of detection was determined for the baked cookies: 50 ppm soybean protein extract spiked. Two shop-bought samples were analysed: a type of biscuit and a cream dessert. The method worked well for both.
The most important conclusion of this research is that basophils of patients with documented severe hazelnut allergy can be used to demonstrate functional active hazelnut allergens in different matrices. Although this technique cannot be used on a routine base, it might be most valuable, to analyze food containing potentially clinically relevant traces of allergen which might not be demonstrated using “classical” techniques like ELISA or PCR.
At present, the available routine detection methods cannot be applied to assess the remaining allergenicity in food products. Routine assays can only give information on the presence of the food species or particular allergens. As explained above, allergenicity can only be tested with functional assays applying blood from allergic individuals, which makes these tests unfeasible as routine tests. However, it must be noted that the BAT has a very good sensitivity as compared to the other evaluated methods.
This study clarifies that both ELISA and PCR are in theory equally suited for allergen detection in food as they are both only to provide information on the presence of the concerning allergeninc ingredient. Even if an ELISA assay targets the particular allergenic proteins, it cannot serve as an allergy assessment tool, as it merely detects the protein but cannot determine the allergic potential. The assessment of the commercial analytical tools proves that the accuracy of the quantification/detection is undermined by food processing and matrix effects. Performing a risk assessment concerning the impact of food processing on the detection of food allergens by means of routine/commercial tests is complicated, as the results of this study have demonstrated that the impact of chemical modifications as induced by the processing is dependent on the assay used (detection) and moreover varies among sensitised individuals (allergenicity). With regard to studies investigating the impact of food processing it must also be emphasised that extraction of the analyte from the food matrix after processing remains an issue for the different detection platforms (ELISA, PCR, MS, BAT). In this context, MS based detection methods are promising as more harsh extraction procedures can be applied here, as this technique does not analyse intact proteins but detects peptides instead.
To conclude, this study has demonstrated that kit developers should be urged to perform a more extensive evaluation of the currently available routine tests, similarly as has been performed within this project. This information should support the food industry to make an educated selection on the most appropriate test for the intended application.
1 INTRODUCTION
The last few years food allergies have become an important issue for both society and the food industry. According to the World Health Organisation food allergies pose the fourth most important public health problem. About 15-20% of the population is (in)directly confronted with food allergies in their daily life through a family member, at work, at school, etc.. The exact prevalence of food allergies is not known, but it is estimated that about 6-8% of children and 2-3% of adults suffer from a food allergy (2001). Although several therapies are being investigated, at present the only effective treatment for food allergy is still total avoidance of the allergen-containing food. This is not always feasible as food products often are composed of a large variety of ingredients of which some could cause an allergic reaction. Food products can also unintentionally contain allergenic components due to cross-contamination during storage, processing, shipment, as a result of rework or inadequate cleaning of the food production or preparation equipment.
Directive 2007/68/EC, amending Directive 2000/12/EC, contains a list of 14 allergenic foods, which have to be declared unambiguously on the product label whenever used as an ingredient (European Parliament and Council, 2007). However, the legislation does not cover the presence of unintentionally added allergens as a result of cross-contamination. Nonetheless, the food industry is obliged to cover this item due to their liability to produce safe food for the consumer according to the general Food Law (European Parliament and Council, 2002). The lack of an integrated approach for the detection of (food) allergens puts the food industry for a problem with regard to the control of their production processes to ensure the absence of cross-contamination. There is an urgent need for validated detection and quantification methods which are specific, sensitive and robust to be applied for a broad range of processed food products. The currently available methods detect either the allergenic proteins (e.g. ELISA) or a DNA marker of the allergenic component/product (e.g. PCR) (Poms et al., 2004). In addition, mass-spectrometric methods are being developed to quantify allergens (Monaci and Visconti, 2009b).
The objective of this project is to develop an integrated control strategy for 2 selected allergenic foods, namely soy and hazelnut. This objective comprises the evaluation of currently available detection methods and the development of new detection methods.
The performance of the currently commercially available ELISA- and PCR-based detection kits was evaluated for their analytical and practical applicability. To this end following parameters were evaluated: analytical and practical sensitivity, specificity and robustness with regard to food processing. The impact of the food processing on
the detection was correlated to the induced protein modifications and the impact on the allergenicity to evaluate the possible risk for the allergic consumer.
The development of new analytical assays has been directed towards the detection of hazelnut and soy specifically in processed food products. Those process parameters that result in the highest level of protein modification and showed to be the most critical for the allergen detection with the commercial kits, formed the basis for the development of new improved ELISA methods. As a confirmation method for the above mentioned detection methods a mass-spectrometric method was developed. The applicability of a quantitative technique of analysis based on liquid chromatography coupled to mass spectrometry will be tested on the allergens.
The screening of food products (and their production and processing sites) to detect possible allergens is an essential part of a solid preventive policy. This project results in a comparative evaluation of different detection platforms for food allergens. The final goal is to develop an integrated detection strategy for hazelnut and soy in the food industry. This detection strategy should determine which detection platform/method is best suited for a particular application. The government and producers will also be provided with new tools to control the legislation concerning allergens in a reliable way.
2 METHODOLOGY AND RESULTS
2.1 Evaluation of protein and DNA isolation protocols
At present there is a lack of standard reference materials for allergens and standard protocols for the isolation of bio-analytes from allergenic foods. In this study a comparative evaluation was performed of different protocols for the isolation of proteins and DNA from allergenic foods. The allergenic foods that have been studied in the framework of this project are hazelnuts and soybeans.
2.1.1 Functional evaluation of protein isolation protocols
Besides the fact that a reference material for both concerning allergic commodities is not available, there is a considerable variation among the protein/allergen extraction protocols used with no universal standardised protocol yet being established. From a clinical point of view it is a prerequisite to perform our investigations with a biologically active allergen extract. This means that the allergen extract should be representative for the concerning crop (contain the particular allergens) and be able to induce an immune response in allergic patients. Therefore, a suitable protein extraction protocol fulfilling these requirements is vital. The selection of extraction protocols evaluated in this study was based on existing methods to produce allergen extracts for (food) allergy research. This comparative study was performed on hazelnuts.
Three extraction buffers (A-C), commonly used for the isolation of proteins from allergenic foods, have been compared. The extraction buffers used in the different protocols are;
- Method A: PBS pH 7.4 (1M NaCl, 1.47 mM KH2PO4, 2.7 mM KCl and 10 mM
Na2HPO4, sodium azide 0.2 g/ L was added to the extraction buffer to avoid
microbial growth (Kujala et al., 2002)
- Method B: PBS pH 7.4 , 2% polyvinylpyrrolidone (PVPP) (Björksten et al., 1980)
- Method C: 20 mM Na2HPO4, 1 M NaCl, pH 7.4 (defatting with hexane) (Yeung
and Collins, 1996)
The detailed extraction procedures are described by Platteau et al. (2010b). In our investigation we have looked at the influence of the use of a mix of protease inhibitors (2 mM ethylenediaminetetraacetic acid, 5 mM diethyldithiocarbamate, 0.5mM benzamidine hydrochloride and 0.2 mM phenylmethylsulfonefluoride), as described by Björksten et al. (1980) on the quality of the protein extract. In Method C the ground hazelnuts were first defatted with hexane before the protein extraction. The impact of the defatting step on the protein extract was also evaluated.
The three extraction protocols were applied with (+) or without (-) the use of the protease inhibitors. Proteins were quantified in the extracts obtained with the DC Protein Assay (Bio-Rad, Hercules, CA, USA). The extracts were first evaluated by loading and separation of equal amounts of proteins of each extract on SDS-PAGE (Figure 1).
Figure 1 SDS-PAGE of extracts A, B and C, prepared without (-) and with (+) the mix of protease inhibitors (M= molecular weight marker)
Although the amount of proteins that was loaded onto the gel was identical for the different extracts, the intensity of particular bands differs visually between extracts prepared with and without the protease inhibitors. For the extracts prepared with protease inhibitors (A+, B+ and C+) some bands are more intense compared to the equivalent protein bands in the extracts where no protease inhibitors were included during the extraction (A-, B- and C-). It is thus worthwhile to test the functionality of the protein extracts to elicit allergic reactions.
The functionality of the extracts was analysed in the Basophil Activation Test (BAT). The BAT is a flow cytometric method that closely resembles the in vivo pathway leading to allergic symptoms (Ebo et al., 2008). Upon activation of basophils, mediators are released, such as histamine, that are responsible for the allergic response. For the test peripheral blood basophils from three hazelnut-allergic patients were applied and the analysis was performed as has been described (Ebo et
al., 2007; Platteau et al., 2010b).
Figure 2 shows a dose-response curve of hazelnut extracts A and B prepared without (left) and with protease inhibitors (right). From Figure 2 it appears that adding enzyme inhibitors enhances the allergenicity of the hazelnut proteins in the extracts. Actually, upon stimulation with 1 and 10 µg/mL hazelnut proteins, a lower percentage of activated (CD63+) basophils was measured for two out of three patients for extract A (Figure 2, triangles and circles) and B (Figure 2, triangles and squares), when no protease inhibitors were included. Overall, for extract A the protein concentration
75 kDa 50 kDa 37 kDa 25 kDa 20 kDa 15 kDa 10 kDa 100 kDa 150 kDa 250 kDa M A- A+ B- B+ C- C+ Cor a 8 Cor a 14 Cor a 11 Cor a 9 Cor a 1 Cor a 2
needed to activate the basophils differs 10-fold when prepared with or without protease inhibitors, respectively. For the third patient a strong activation was already observed with extracts A- and B-, demonstrating the high sensitivity of this patient. These results demonstrate the importance of adding protease inhibitors during the isolation of proteins from food.
Figure 2 Dose-response curve in BAT of extracts A and B, prepared without (-) and with (+) protease inhibitors, with blood from three hazelnut-allergic patients (triangles, squares, circles).
To investigate the impact of defatting on the hazelnut protein extract, extract C+, was compared to extract A+ and B+ in the BAT. Defatting is often performed to ameliorate the protein extraction.
Figure 3 Dose-response curve in BAT of protein extracts A, B, C of hazelnut prepared with protease inhibitors (+) with blood from three hazelnut-allergic patients (triangles, squares, circles).
Figure 3 shows that the percentage of activated (CD63+) basophils differs among the three patients, indicating diversity in allergic response between the patients. However, stimulation with the three extracts results in a similar activation pattern of basophils for each individual patient. From this we can conclude that defatting the
µg ml-1hazelnut protein % a ct iv a te d b a so ph ils % a ct iv a te d b a so ph ils µg ml-1hazelnut protein
hazelnuts before extraction does not affect the allergy-provoking potential of the extracts for the selected patients. Moreover, it can be concluded that all three extraction protocols (A+, B+ and C+) are suitable for the extraction of proteins/allergens from hazelnuts. The BAT as presented in Figure 3 has also been performed with protein extracts from soybean obtained with the same protocols (A+, B+, C+) applying blood from soy-allergic patients (Figure 4).
Figure 4 Dose-response curve in BAT of protein extracts A, B, C of soybean prepared with protease inhibitors (+) with blood from three soy-allergic patients (triangles, squares, circles).
Similar activation pattern with the three soybean protein extracts was obtained for the three patients. This indicates that the extraction protocols are also equally suited for the isolation of proteins from soybeans. From the three protocols we have selected method C+, including the protease inhibitors and the defatting step, for the further experimental work.
2.1.2 Evaluation of DNA isolation protocols
Further on in this work the development of new PCR assays for the detection of hazelnut and soy is described (2.4.1). These assays were validated together with commercially available PCR assays (Table II) for the detection of both plant species in food. The new assays were developed to be used in a quantitative manner. Although the commercial assays were prescribed to be qualitative, we determined their ability to be applied as quantitative tools. To this end, genomic DNA of both crops was required to be used as a calibrant. The quality of the DNA will be determined by the extraction protocol that is used. The different parameters that define the quality of extracted DNA are the yield, the chemical purity and the structural integrity. These are the parameters that were determined in the evaluation of the different investigated DNA extraction protocols.
A+ B+ C + % a ct iv a te d b a so ph ils µg ml-1soybean protein
The evaluated DNA extraction protocols comprised two CTAB-based protocols, the first one according to De Neve et al. (1997) and the second as described by Doyle and Doyle (1990), and three commercial DNA extraction kits: DNeasy Plant mini kit (Qiagen, Hilden, Germany), Wizard® Magnetic DNA Purification System for Food (Promega Benelux, Leiden, The Netherlands) and Nucleospin Food (Machery-Nagel, Düren, Germany).
The first parameter that was determined was the DNA yield. To this end the DNA concentration in the different extracts was determined with the QuantitTM PicoGreen® dsDNA Assay kit (Invitrogen Ltd, Paisley, UK) according to the kit instructions. The principle of this assay is based on the binding of the fluorescently labelled dye Picogreen to double stranded DNA. Most studies compare different DNA extraction protocols based on the DNA concentration in the extract. Here the amount of starting material and the elution volume was taken into account to make a correct comparison of the yield (total amount of DNA/amount of start material) obtained with the different methods.The DNA yield obtained after extraction from hazelnuts was clearly lower than from soybean (Figure 5, left). Hazelnuts contain more lipids than soybeans (on average 60 % vs. 20 %) and are consequently more difficult to handle during the extraction procedure. This could explain why less DNA was obtained, although it is also possible that the overall DNA content is lower for hazelnuts. For hazelnut the lowest yield was obtained with the CTAB 1 protocol and the Wizard Magnetic kit. For soybean both CTAB-based protocols showed very poor DNA recovery, although the yield with the CTAB 1 protocol was significantly lower than with the CTAB 2 protocol. For both crops the highest yield was obtained with the Qiagen DNeasy Plant and the Nucleospin kit.
Figure 5 demonstrates that evaluating the yield based on the DNA concentration in the extracts can lead to false conclusions. While the soybean DNA concentration in the extract obtained with the Wizard Magnetic purification and Nucleospin kit was higher than with the Qiagen DNeasy Plant mini kit, the opposite was true for the yield obtained with these kits. This indicates that the Qiagen kit is able to extract the most DNA from soybean.
The low DNA concentrations measured with the CTAB-based protocols could however be explained by a quenching effect of the fluorescence during the measurement by traces of CTAB, as has been published recently, after this investigation was already completed (Holden et al., 2009).
Figure 5 (Left) DNA yield after extraction of hazelnut and soybean using different protocols, (Right) DNA concentration in the different extracts (n=2)
Degradation of the DNA during the extraction process can result from the release of nucleases upon cell lysis. This can be overcome by the addition of proteinase K during extraction, which breaks down the nucleases. In the protocols examined in this study, the addition of proteinase K is specifically described only for the Nucleospin Food kit. The integrity of the extracted DNA, the second parameter, was checked by a degradation PCR test. The principle of this test is that several fragments of a conserved eukaryotic 18S ribosomal DNA sequence with a increasing length are amplified by conventional PCR using one common forward primer but with eight different reverse primers, resulting in amplicons with a length ranging from 103 bp to 1468 bp. The length of the longest fragment that is amplified is a measure for the integrity of the DNA (De Latter, 2008). Both hazelnut and soy DNA extracts were analysed with this test. However, amplification was observed only for the soy samples, except for the soy extracts obtained by the CTAB-based protocol according to Doyle and Doyle (Figure 6). This was also the protocol returning the lowest DNA concentration for soy. With the other DNA extracts, amplification of all individual DNA fragments was obtained, showing that the DNA was intact over a length of at least 1486 bp.
Figure 6 DNA degradation test with different soybean extracts
0 10 20 30
CTAB 1 CTAB 2 Qiagen Wizard Nucleospin
yiel d (n g D N A /mg ma ter ial) Hazelnut Soy 0 10 20 30 40 50
CTAB 1 CTAB 2 Qiagen Wizard Nucleospin
co n cen tr at io n (ng DN A µl -1) Hazelnut Soy Nucle ospin CT AB 2 M w m arker Qiag en Wi zard CT AB 1 M w m arker 11497 bp ~5000 bp 1700 bp ~1100 bp 805 bp
It was assumed that the lack of amplification for the hazelnut extracts could also be caused by the low DNA yields obtained. In a search to try to increase the DNA yield from hazelnut, a slight adaptation was made to the Qiagen protocol; instead of transferring the clear supernatant of the lysis mixture to the Qiashredder columns, which are intended to remove residual cell debris from the solution, the whole lysate was applied. This proved to increase the DNA concentration in the extracts for both hazelnut and soy from 3.4±1.3 to 12.4±1.5 and 18.4±2.2 to 24.3±4.2 ng µl-1, respectively. Upon applying these DNA extracts in the 18S degradation test, amplification up to 1486 bp was demonstrated for both hazelnut and soy. As this is the only protocol using this type of „cleaning‟ columns, this adaptation was only possible for the Qiagen kit. It was therefore decided to apply this protocol for all further DNA extractions that had to be executed.
Contaminants in the DNA extract can impair an efficient amplification of the target
DNA sequence. This could lead to false positive results or erroneous quantification of the target analyte. The efficiency of a PCR assay can be assessed in real-time format by constructing a standard curve through analysing a dilution series of the genomic DNA. Under normal conditions a linear relationship exists between the natural logarithm of the template concentration present in the reaction vial and the Cq value obtained after processing the obtained real-time fluorescent signals
). Deviations from the linear curve indicate an altered PCR efficiency, which can be an indication of the presence of PCR inhibitors in the sample. A dilution series of genomic DNA obtained from hazelnut and soybean with the Qiagen DNeasy Plant mini kit, the adapted protocol as described above, was analysed in a real-time PCR targeting a conserved sequence on the 18S ribosomal DNA.
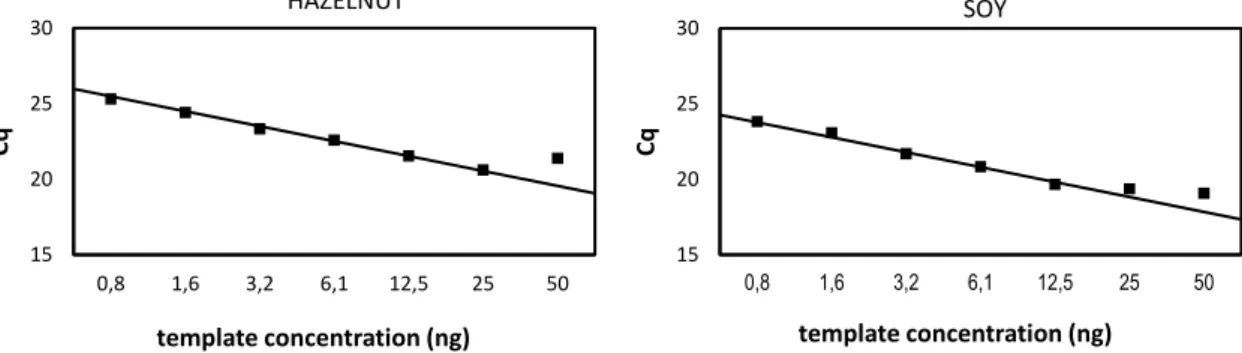
Figure 7 Calibration curve of the 18S inhibition PCR assay with hazelnut and soy DNA
The calibration curves obtained for the universal 18S PCR assay (Figure 7) show deviating Cq values at concentrations above 25 ng and 12.5 ng template DNA for hazelnut and soy, respectively. The Cq values for the samples with higher concentrations are higher than should be expected based on the standard curve, indicating that the amplification reaction was impaired. The decreased efficiency of
15 20 25 30 0,8 1,6 3,2 6,1 12,5 25 50 Cq template concentration (ng) HAZELNUT 15 20 25 30 0,8 1,6 3,2 6,1 12,5 25 50 Cq template concentration (ng) SOY
the PCR at higher concentrations could be explained by the higher concentration of inhibitory components in the less diluted samples. Further on in this work the linearity of new developed PCR assays for the detection of hazelnut and soy was determined (2.4.1). In contrast to the observations presented here, good linearity between Cq values en template concentrations was observed up to 50 ng total DNA in the PCR reaction for both crops. A possible explanation for this difference could be found in the genome copy number of the target that is amplified. In the case of the 18S ribosomal DNA sequence it is known that the amplified sequence is present in multiple copies on the eukaryotic genome, while the hazelnut and soybean allergen encoding sequences are assumed to be single-copy targets. Amplification of a multiple copy target could lead to competition for the building blocks (nucleotides) and polymerase in the PCR reaction if the template is present at high concentration, leading to a sub-optimal amplification. In this case competition instead of inhibition is thought to be the reason for the decreased efficiency at higher template concentrations. From these findings we can conclude that the decreased PCR efficiency at higher DNA concentrations is not due to the presence of inhibitors, but can be attributed to competition for the reagents in the reaction. In summary, the DNA obtained with the Qiagen DNeasy Plant mini kit is of sufficient purity to be efficiently amplified in PCR. The DNeasy Plant mini kit, with the slight adaptation of the protocol as described above, is therefore used for all further DNA extractions in the project.
2.2 Evaluation of the analytical performance and robustness of ELISA and PCR
In this study one of the goals was to evaluate the performance of commercially available ELISA and PCR methods for the detection of hazelnut and soy. The commercial assays that have been included in this work are summarised in Table I and Table II. Some new quantitative real-time PCR assays for the detection of hazelnut and soybean with regard to allergen detection were also developed within the framework of this project (see 2.4.1), as such assays were lacking at the take-off of the project.
Table I Overview of commercial ELISA kits applied in this study
Allergenic
food kit LOD LOQ Manufacturer
Hazelnut Veratox - 2,5 ppm Neogen
Ridascreen FAST 1,5 ppm 2,5 ppm R-Biopharm
Residue - 0,5 ppm ELISA Systems
BioKits 0,1 ppm 1 ppm Tepnel
(now Neogen)
Soybean Veratox - 10 ppm Neogen
Residue - 1 ppm ELISA Systems
BioKits 0,3 ppm 1,25 ppm Tepnel
(now Neogen)
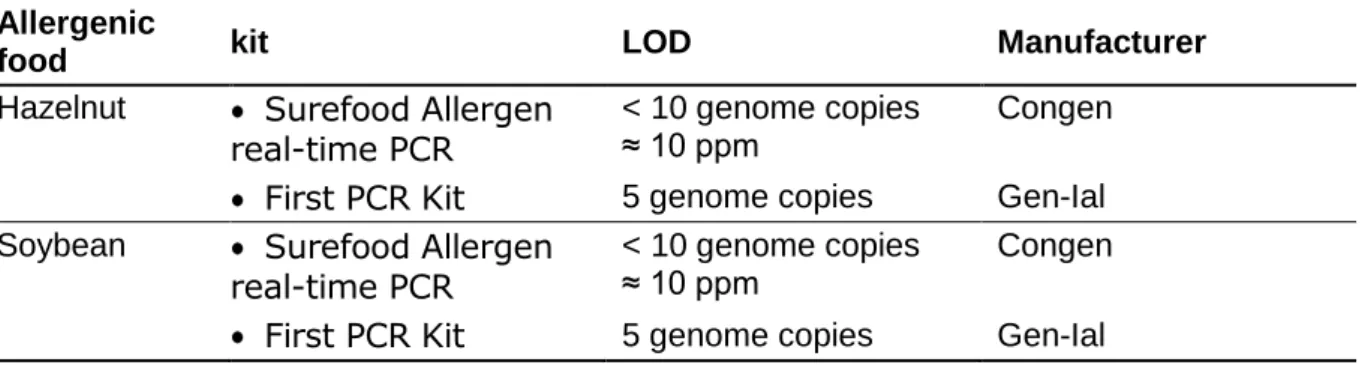
Table II Overview of commercial real-time PCR kits applied in this study
Allergenic
food kit LOD Manufacturer
Hazelnut Surefood Allergen real-time PCR
< 10 genome copies ≈ 10 ppm
Congen First PCR Kit 5 genome copies Gen-Ial Soybean Surefood Allergen
real-time PCR
< 10 genome copies ≈ 10 ppm
Congen First PCR Kit 5 genome copies Gen-Ial 2.2.1 Evaluation of commercial ELISA kits
Sensitivity
Allergen detection methods need to be able to detect traces of the allergenic product. The enzyme-linked immunosorbent assay (ELISA) is the preferred method to assess the level of allergens contamination in foods and is extensively used both by the food industry and the enforcement agencies. There is a general agreement that allergen detection methods should have a detection limit between 1 and 100 ppm (Poms et al., 2004), although nowadays a maximum detection limit of 10-20 ppm is preferred. The sensitivity of the ELISA assays was evaluated by determination of the Limit Of Detection (LOD) and the Limit Of Quantification (LOQ). The LOD was determined by analysing 20 blank samples, calculating the mean quantified value and adding three times the standard deviation. For the LOQ six times the standard deviation was added. A blank sample is in this case the buffer in which food samples are extracted and/or diluted before analysis in the ELISA assay according to the manufacturer‟s protocol. The obtained absorbance values for each sample were quantified by means of a standard curve that was constructed with the standard protein solutions included in each kit. For fitting the absorbance values to the protein
concentration of the standard solutions, a four-parameter-logistic dose-response curve was used with equation (1) below. This equation represents a standard way to express immunoassay data, where a is the maximum of the curve, i.e. the absorbance at the highest dose (protein concentration), b is the minimum, i.e. absorbance at the lowest concentration, c is the E50-value (concentration at half-maximal saturation), d is the slope of the curve and conc is the concentration of the standard or sample (Englebienne, 2000).
a c conc a b Absorbance d 1 (1)
Conversion of the LOD and LOQ value expressed as ppm hazelnut/soybean to the corresponding protein concentration expressed as ng/ml protein was performed according to equation (2) and (3) (see 2.2.3) and is explained below.
Table III LOD and LOQ of commercial hazelnut ELISA kits determined by analysing 20 blank samples (LOD=mean+3SD, LOQ=mean+6SD)
Veratox HN Ridascreen
FAST HN HN Residue BioKits HN
LOD ppm HN 0.058 0.014 0.0025 0.023
ng/ml HN protein 0.278 0.06 0.0299 0.138
LOQ ppm HN 0.123 0.044 0.011 0.068
ng/ml HN protein 0.59 0199 0.1264 0.409
Table IV LOD and LOQ of commercial soy ELISA kits determined by analysing 20 blank samples (LOD=mean+3SD, LOQ=mean+6SD)
Veratox Soy Soy Residue BioKits Soy
LOD ppm soy 1.582 0.136 0.695
ng/ml soy protein 63.29 13.58 6.946
LOQ ppm soy 2.565 0.579 1.319
ng/ml soy protein 106.24 57.94 13.18
The determined LOD and LOQ values of the commercial ELISA kits for the detection of hazelnut and soy (Table III and Table IV) are much lower than the values specified by the kit manufacturer (Table I). It could be that the latter used another method to determine these values, although, determination of the LOD for the hazelnut kits with a dilution series of hazelnut protein, prepared by the selected method described under 2.1.1, returned similar values as in Table III (data not
shown). This indicates that these kits have a better analytical sensitivity than specified by the manual. However, it must be kept in mind that the analytical sensitivity (detection limit of the analyte as such) is not necessarily equal to the practical sensitivity (detection limit of the analyte contained in a food product). The latter was also investigated in this project (see section 2.2.3).
Specificity
The examined ELISA assays are intended to analyse food products containing a broad variety of ingredients. Hence, it is important that the assays will only detect the intended target and will not cross-react with other possible ingredients present in the food product, which could lead to a false positive result. Cross-reactivity can occur between homologous proteins having a similar structure or amino acid sequence. As it is practically impossible to test all existing foods for possible cross-reactivity in the ELISA assays, a selection was made. The selection was based on (a) the results of a Protein BLAST of the known hazelnut and soy allergens to search for other food species containing homologous proteins, (b) the results of a Primer BLAST of our own developed primers (see 2.4.1) to search for other food species containing a DNA sequence within their genome with which the primers could hybridise, (c) possible cross-reactivity of bulk ingredients present in the food product. In this project cookies were chosen as a model food system. Consequently, the bulk ingredients that were selected are products that can be present as bulk ingredients in cookies.
Proteins were extracted from the selected food products according to the procedure described in the kits manual and analysed according to the manufacturer‟s instructions.
Table V shows that a lot of the food samples return a positive result in one or more ELISA kits, which is worrisome with regard to false-positive test results of food products containing these ingredients. This could lead to unnecessary product recall, which is harmful for the food producer. . However, not all signals are of the same order. In order to interpret the obtained data, the LOD of the kits, if specified, should be considered as well (values > LOD indicated in black and bold). Since not all of the evaluated kits specify their LOD, however, the experimentally determined LOD was also considered (values > experimental LOD indicated in green). Foods returning values higher than the LOD of the kit as specified by the manual can be considered as true cross-reacting species. Both the BioKits Hazelnut and BioKits Soya assays had the highest number of reacting species. The BioKits Hazelnut assay cross-reacted with multiple other nuts (almond, cashew, macademia, pecan nut, pistachio and walnut) and peanut. However, only cross-reactivity with walnut and pecan is reported by the kit‟s manual. This can be problematic when a food product containing other nuts than hazelnut is analysed with this kit. Some of these nuts even produce a signal that is higher than the LOQ (red bold) (cashew, pecan nut and walnut). The
BioKits Hazelnut is also the only hazelnut ELISA that returns rather high absorbance values in general. For the Ridascreen FAST Hazelnut kit, only pistachio returns a value above the LOD specified by the kit. For the two other kits, Veratox Hazelnut and Hazelnut Residue, no LOD is specified by the kit. The number of foods producing a signal above the experimental LOD is very high for the Veratox Hazelnut kit. However, the foods returning the highest values are the nuts, peanut and lettuce.
Table V Amount of hazelnut/soy determined with the different commercial ELISA kits in the food products selected for the specificity assessment expressed in parts per million (ppm). Data are mean values of duplicate ELISA analyses of a single sample
Veratox for HN Ridascr. FAST HN Residue BioKits HN Veratox Soy Soy Residue BioKits Soy Almonda 0,26 0,37 0,001 0,52 / 0,09 0,59 Barleya 0,04 / / 0,02 1,80 0,13 0,05 Brazil nuta 0,14 / 0,01 0,06 55,28 1,89 2,74 Cashewa 0,58 0,79 / 1,60 0,97 0,13 0,55 Coleseeda 0,17 0,63 0,02 0,63 0,97 0,08 0,54 Hazelnuta - - - / 0,07 0,81 Macademiaa 0,14 0,01 0,001 0,45 / 0,07 / Olivea / / / 0,08 0,51 0,13 / Peaa 0,04 / / 0,37 0,69 0,12 4,69 Peanuta 0,15 / / 0,26 0,96 0,05 0,72 Pecan nuta 0,34 / / 2,22 / 0,02 / Pistachioa 0,88 2,29 0,14 1,32 0,87 0,09 0,34 Soya 0,13 / / 0,83 - - - Wheata 0,06 0,70 / / 0,90 0,05 0,79 Lettuceb 0,53 0,02 0,02 1,61 1,82 0,12 / Raspberryb 0,082 0,01 / / 0,15 0,16 / Spinacheb / 0,09 / 0,20 0,25 0,05 / Strawberryb 0,08 / / 1,33 2,25 0,10 / Applec 0,11 / / / / 0,03 / Grapec / / / / 0,83 0,16 / Maizec 0,08 1,35 / / 1,24 0,10 / Oatc 0,09 0,16 / / 69,10 3,30 10,76 Ricec 0,17 / 0,12 0,33 3,64 0,28 / Walnutc 0,31 0,01 0,02 5,41 / 0,04 / Egg whited 0,13 / / / / / / Egg yolkd 0,04 / / / / 0,09 / Kamutd 0,06 0,01 / / 114,86 2,70 7,19 Milk (powder) / / / / / / / Speltd 0,09 0,17 / / 22,91 1,05 / Starch (potato) d 0,04 / / / 0,90 0,03 / Sugard / / / / / 0,030 / a
food selected based on results of Protein BLAST
b
food selected based on results of Primer BLAST
c food selected based on results of Protein and Primer BLAST d
bulk ingredient
/ measured absorbance < blank absorbance
value > own determined LOD
value > LOD specified by kit
For the three soy ELISA kits cross-reactivity can be observed for Brazil nut, oat and kamut. Spelt shows cross-reactivity in two out of three kits (Veratox Soy and Soy Residue). Besides cross-reactivity with multiple nut species (almond, Brazil nut, cashew, hazelnut and pecan), the BioKits Soy assay also shows cross-reactivity with other legumes (pea and peanut), coleseed and wheat. Cross-reactivity of the latter with Brazil nut and different kinds of pea were indicated by the kit. However, the cross-reactivity with walnut could not be confirmed in our study.
It must be emphasised that these results are obtained by analysis of the pure food product, but even then, the obtained values are in general rather low. These foods will not be present at a 100 weight percentage in a food product when included as an ingredient and would then probably not pose a problem. Although, the cross-reactivity observed for kamut and spelt in the soy ELISA kits can be more problematic if these products are used as bulk ingredients, i.e. at a high weight percentage in the food product.
2.2.2 Evaluation of new and commercial real-time PCR assays
Sensitivity
The analytical sensitivity of both the new and the commercial PCR assays was determined by analysing dilution series of genomic hazelnut or soy DNA, obtained with the DNeasy Plant mini kit (adapted protocol), ranging from 0.256 pg to 50 ng (total DNA content in the PCR reaction). The commercial PCR assays were applied as described by the manufacturer. The newly developed assays are described further on in this work (2.4.1). All assays were real-time PCR tests based on TaqMan detection chemistry. PCR reactions were performed in an ABI Prism 7000 (Applied Biosystems). Data were analysed with the 7000 System Sequence Detection Software Version 1.2.3 (Applied Biosystems). Six replicates of each concentration were analysed. The detection limit (LOD) was defined as the concentration at which all replicates showed an amplification curve and a signal above the threshold was obtained. The LOD was 3.2 pg genomic hazelnut DNA for the Cor a 1 and Cor a 8 assays and 1.28 pg genomic soy DNA for the Gly m Bd 28K and Gly m Bd 30K assays (Table VI). The commercial assays for both hazelnut and soy were all able to detect 1.28 pg genomic hazelnut/soy DNA. When converting this amount to the number of copies of the target that can be detected, taking into account the genome size of hazelnut (0.48 pg) (Bennett and Smith, 1976) and soy (1.13 pg) (Bennett and Leitch, 1997), Table VI shows that the commercial kits for soy detection are the most sensitive, being able to detect as less as 1.1 genome copy. However, we must remark that for this calculation it is assumed that the targeted sequences are single copy genes.
Table VI LOD and LOQ of the different hazelnut and soy PCR assays
Assay LOD LOQ
pg DNA copies pg DNA copies
Cor a 1 3,2 6,6 6,4 13,3 Cor a 8 3,2 6,6 6,4 13,3 First Hazelnut 1,28 2,7 6,4 13,3 Surefood Hazelnut 1,28 2,7 6,4 13,3 Gly m Bd 28 K 3,2 2,8 3,2 5,7 Gly m Bd 30 K 3,2 2,8 3,2 5,7 Surefood Soy 1,28 1,1 1,28 5,7 First Soy 1,28 1,1 1,28 5,7
The quantification limit was determined by constructing a standard curve for each assay. The Limit of Quantification (LOQ) was set at the lowest concentration at which a linear relationship exists between the concentration and the quantification
cycle (Cq) ). As to date no requirements are available for
PCR assays detecting food allergens, evaluation of the calibration curves was done based on the Minimum Requirements of analytical methods for GMO testing (European Network of GMO Laboratories (ENGL), 2008). This document prescribes that the correlation coefficient (R2) has to be ≥ 0.98 and that the slope of the curve between -3.1 and -3.6, resulting in an PCR efficiency of 110 % and 90 %,
respectively according to equation following equation: .
Each assay evaluated fulfilled these requirements. For each assay the lowest point of the standard curve, i.e. the quantification limit, was 6.4 pg DNA.
Specificity
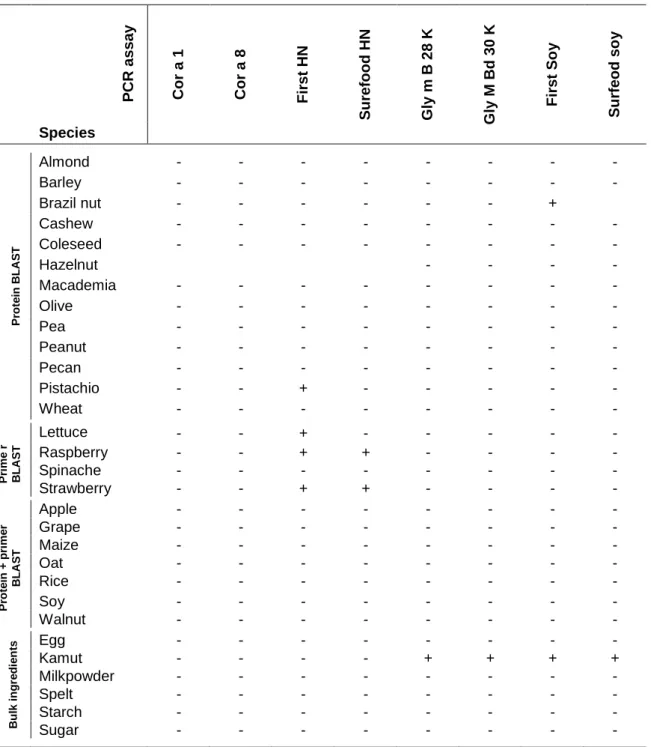
it is important that the assays will only amplify and consequently detect the intended target and will not cross-react with DNA sequences from other possible ingredients present. The specificity of the designed assays was first determined in
silico by searching for homologies with DNA sequences present in the NCBI
database. We did not search for entries containing a nucleotide sequence similar to the whole PCR product, as cross-reactivity could result from the primers binding to another DNA sequence than the target of interest with a differing inter-primer sequence. Instead, a search for sequences which the primers could anneal with was performed using the NCBI Primer BLAST tool. This approach was not possible for the commercial assays as the primer sequences are not released by the kits manufacturers. The Cor a 8-primers demonstrated homologies with nucleotide sequences within the genome of apple (Malus domesticus), lettuce (Lactuca sativa), oat (Avena sativa), raspberry (Rubus idaeus), strawberry (Fragaria ananassa), walnut (Juglans regia), grape (Vitis vinifera) and soy (Glycine max). Although the
alignment of the primers with these sequences contained single or multiple mismatches, successful annealing cannot be ruled out. Primer pairs developed to amplify a fragment of the Cor a 9 and Cor a 10 genes of hazelnut showed in silico cross-reactivity with spinache (Spinacia oleracea) and maize (Zea mays) and rice (Oryza sativa), respectively. Even though these primers were not used further on this study, these plant species were also included in the specificity test if not yet included based on the protein BLAST selection.
DNA was extracted from all the foods with the DNeasy Plant mini kit (adapted protocol). As a control to avoid false-negative PCR results, the presence of amplifiable DNA was tested in a real-time PCR assay with universal primers and a 5‟-FAM-labeled, 3‟-TAMRA-quenched oligonucleotide hydrolysis probe targeting a conserved eukaryotic sequence on the 18S rRNA gene (De Latter, 2008). Successful amplification was achieved for all samples. Upon analysis of the DNA samples from the different food species with the different hazelnut PCR assays, positive results were obtained only with the commercial assays for pistachio and lettuce with the First Hazelnut kit and for raspberry and strawberry for both the First and Surefood Hazelnut assay (Table VII). To ascertain that the signal is resulting from cross-reactivity and not originating from cross-contamination of the sample, the results were further investigated.
The most logical approach to elucidate whether or not the food samples are contaminated with hazelnut would be identification of the amplified fragment by determination of the melting temperature (Tm) or fragment sequencing. However, these approaches are not possible with the commercial PCR tests, as the identity of the primers is unknown. Also, the primers are contained in a mix with other PCR components in the kits, but the exact composition of the mixes is not known. Therefore, further investigation of these samples was performed by an alternative approach. To this end the samples were analysed in an independent PCR for hazelnut detection. A negative result in this independent assay would indicate that the positive amplification in the new or commercial PCR tests is due to cross-reactivity of the concerned species, leading to a false-positive result. If the sample would return a positive result in this assay it could be concluded that it was contaminated with hazelnut. The assay that was applied amplifies a non-coding mitochondrial sequence of 294 bp and has been developed for the detection of hazelnut in chocolate (Herman et al., 2003). Only the pistachio sample returned a positive signal in this assay, although very faint (Figure 8, pistachio 1), indicating hazelnut contamination of these nuts. These results are also confirmed by melting curve analysis by performing this PCR reaction in real-time format with SYBR Green I detection.
Table VII Result of amplification of DNA of the selected food samples in new and commercial real-time PCR assays P CR a ss ay Co r a 1 Co r a 8 F ir st HN S u refo o d HN G ly m B 2 8 K G ly M Bd 30 K F ir st So y S u rf eod so y Species Pr o te in B L A S T Almond - - - - Barley - - - - Brazil nut - - - + Cashew - - - - Coleseed - - - - Hazelnut - - - - Macademia - - - - Olive - - - - Pea - - - - Peanut - - - - Pecan - - - - Pistachio - - + - - - - - Wheat - - - - Pr ime r B L A S T Lettuce - - + - - - - - Raspberry - - + + - - - - Spinache - - - - Strawberry - - + + - - - - Pr o te in + p ri me r B L A S T Apple - - - - Grape - - - - Maize - - - - Oat - - - - Rice - - - - Soy - - - - Walnut - - - - B u lk in g re d ie n ts Egg - - - - Kamut - - - - + + + + Milkpowder - - - - Spelt - - - - Starch - - - - Sugar - - - -
The results from this independent PCR show that the positive signal with strawberry, raspberry and lettuce are the result of cross-reactivity of the primers of both commercial assays with these food/plant species. Interestingly, although these species were selected based on the results of the primer BLAST with the Cor a 8 primers, no cross-reactivity was observed in this assay. Following, a new sample of pistachio nuts was purchased, indicating clearly on the package label that the product was free from other nuts. Nevertheless, the sample was first checked for
contamination with the independent hazelnut PCR, which returned a negative result (Figure 8, pistachio 2).
Figure 8 Independent hazelnut PCR - Left: conventional PCR with detection of PCR products by agarosegel electrophoresis and ethidium bromide staining. Right: melting curves obtained after amplification of DNA obtained from hazelnut (positive control), first pistachio sample (1), pistachio without contamination (2), raspberry, strawberry and lettuce.
Upon analysis of the sample in the First Hazelnut PCR a negative result was obtained, indicating that the positive result in the first analysis was due to the contamination. The small peaks that can be seen between 76 and 78 °C (Figure 8) originate from the reaction with DNA from the second pistachio sample. This signal could originate from the formation of primer dimers, which are typically seen at temperatures below the melting temperature of the amplicon. However, no primer dimers were observed in the negative control reaction, containing no DNA. The contamination of the first pistachio sample also explains the high signals measured with the hazelnut ELISA kits. Re-analysis of the second sample showed a tenfold reduction in the measured signal with the Veratox and Ridascreen FAST kit. The value obtained with the Hazelnut Residue kit was below the detection range. With the BioKits Hazelnut kit a value of 0.45 ppm was measured, which is above the LOD specified by the kit, indicating that this kit clearly suffers from cross-reactivity to pistachio. This cross-reactivity is however not specified by the kit‟s manual.
Both the new and commercial real-time PCR assays for soy showed amplification with the DNA obtained from the kamut sample (Table VII). The cross-reactivity that was observed in all three soy ELISA kits (Table V), already was an indication that this sample was contaminated with soy. To confirm this the Gly m Bd 28K and Gly m Bd 30K assays were repeated with SYBR Green I detection and melting curve analysis to reveal the identity of the amplified fragment. However, the results obtained by this approach were not unequivocal and could not be used to elucidate this question. This was done by sequencing the amplification products. Nucleotide BLAST of the PCR products obtained in the Gly m Bd 30K PCR returned the best similarity match with multiple database entries for the Glycine max Bd 30K gene. This result confirmed that the kamut sample was contaminated with soy. However, the Nucleotide BLAST of the Gly m Bd 28K PCR products showed highest similarity with a sequence from
M w m arker NTC PTC strawbe rry ra spb erry pistachi o 1 pista chio 2 le ttu ce 300 bp pistachio (1) positive control (HN)
Triticum monococcum (wild einkorn), an ancient wheat variety just like kamut itself.
Similarity hits with the Gly m Bd 28K allergen gene were also found, but had less good scores. Based on this result one could conclude that the Gly m Bd 28K PCR shows cross-reactivity with wheat varieties. Analysis of the kamut sample in an independent soy PCR also confirmed the soy contamination. This assay is used in GMO detection and targets the lectin gene (Kuribara et al., 2002). However, the cross-reactivity could not be confirmed with a newly purchased kamut sample. This sample was first verified for soy contamination in the lectin PCR and returned negative results upon analysis in as well both the Gly m Bd 28K and Gly m Bd 30K PCR as in the commercial soy PCR tests. A possible explanation for our findings could be that both kamut samples did not contain the same wheat variety, with the one variety showing cross-reactivity with the Gly m Bd 28K PCR and the other not. Kamut is actually a trademark for the wheat variety „Triticum Korasan’, which finds it origin in the ancient Egypt. The second sample was labelled to contain kamut, „Triticum polonicum’. The question is whether these two grains are the same or not. Analysis of the new, uncontaminated kamut sample in the commercial ELISA assays showed a residual cross-reactivity, only for the BioKits Soy assay (1.65 ppm).
Contamination of the Brazil nuts with soy was also demonstrated with the independent PCR test. No sequence analysis of the PCR products could be performed due to the lack of the primer sequences used in the commercial assays. Analysis of the newly purchased Brazil nut samples showed no cross-reactivity in all real-time PCR assays and also in the ELISA kits.
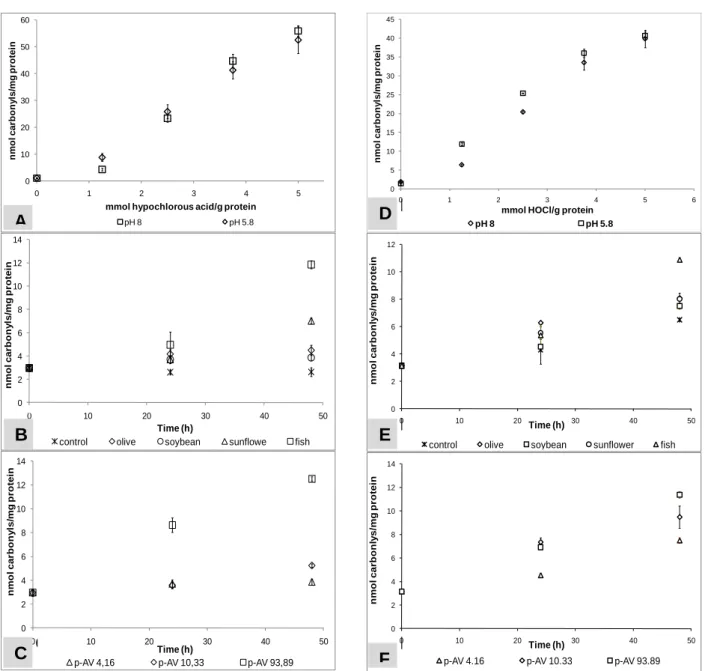
2.2.3 Impact of food processing simulating reactions on the detectability by commercial ELISA
During food processing, modifications on allergen level might occur which can alter the antigen antibody interactions in the routinely used ELISA therefore leading to erroneous results. A careful screening of the performance of the commercial ELISA with hazelnut and soybean proteins modified through food processing simulating reactions was performed. The Maillard reaction in the presence or absence of other proteins, protein oxidation in the presence or absence of lipids and partial protein hydrolysis was therefore induced in buffered systems. These reactions were induced in buffered systems in order to make abstraction of the protein extractability which might have an additional effect on the obtained results.
Proteins were extracted from the hazelnuts and soybeans with the selected protein isolation protocol (see 2.1.1). Protein content was determined according to the Kjeldahl procedure (AOAC Official Method 981.10, 1981). A factor of 5.41 was used to convert nitrogen to hazelnut protein and 5.71 to convert to soybean proteins. The non protein nitrogen (NPN) was determined in the supernatant after a previous protein precipitation with 15 % TCA (final concentration).
Maillard reaction
One of the most important protein modifications induced by thermal processing and long storage is the Maillard reaction, which involves reaction between amino acids and reducing sugars (Contreras-Calderon et al., 2009). There is abundant evidence that thermal processing and non-enzymatic browning reactions can have a great impact on the IgE-binding activity of food allergens. However, the effects observed are highly dependent on the type of allergen studied (Gruber et al., 2005; Gruber et al., 2004; Nakamura et al., 2005; Nakamura et al., 2008). In contrast, limited information regarding the impact of the Maillard reaction on the detectability by commercial ELISA is available.
The model systems without wheat proteins were prepared in 0.1 M phosphate buffer pH 7.4 by mixing 1 % (w/v) hazelnut or soybean proteins with 6 % (w/v) glucose. The mixtures were loaded in closed falcon tubes that were incubated in a water bath at 70°C for up to 48 h. The model systems with wheat proteins were prepared in the same buffer. Two types of model systems were considered: (1) 0.25 % (w/v) of hazelnut/soybean proteins with 0.75 % (w/v) of wheat proteins with our without 6 % (w/v) of glucose, (2) 0.5 % (w/v) hazelnut/soybean proteins with 0.5 % (w/v) wheat proteins with or without 6 % (w/v) glucose.
The impact of the Maillard reaction was evaluated first on protein level. Protein bound carbonyls were measured after converting them to the corresponding 2, 4- dinitrophenylhydrazones (Cucu et al., 2010b). The carbonyl content was calculated using a molar absorption coefficient of 22000 M-1 cm-1 (Levine et al., 1994). The loss of reactive lysine residues was monitored using derivatization with ortho-phthaldialdehyde (OPA) in the presence of 2–mercaptoethanol as previously described (Morales et al., 1996). Free amino groups were determined using derivatization with 2, 4, 6-trinitrobenzene sulfonic acid (TNBS) as previously described (Fields, 1972). The oxidation of the sulfur containing amino acids was monitored by their derivatization with 5.5‟-dithiobis-2-nitrobenzoate (DTNB) as previously described (Beveridge et al., 1974). Total thiol groups were determined in a similar manner after a previous reduction of the disulfide bridges with β– mercaptoethanol.
The Maillard reaction either in the presence or absence of other proteins (soluble wheat proteins) led to severe changes on hazelnut and soybean protein level. The interaction of reducing sugars or dicarbonyl compounds derived from sugars led to the formation of protein-bound carbonyls with a simultaneous decrease of available lysine residues (Figure 9 & Figure 10).
Figure 9. Formation of protein bound carbonyls in soybean protein in the presence or absence of soluble wheat proteins due to incubation with glucose. The data points represent mean values ±SD of three independent determinations. □ - 1% hazelnut or soybean proteins with 6% glucose; ○ - 0.5% hazelnut or soybean with 0.5% soluble wheat proteins and 6% glucose; ∆ 0.25% hazelnut or soybean and 0.75% soluble wheat proteins and 6% glucose; ◊ 1% hazelnut or soybean proteins
Figure 10 Formation of protein bound carbonyls in soybean protein in the presence or absence of soluble wheat proteins due to incubation with glucose. The data points represent mean values ±SD of three independent determinations. □ - 1% hazelnut or soybean proteins with 6% glucose; ○ - 0.5% hazelnut or soybean with 0.5% soluble wheat proteins and 6% glucose; ∆ 0.25% hazelnut or soybean and 0.75% soluble wheat proteins and 6% glucose; ◊ 1% hazelnut or soybean proteins
Moreover changes in the electrophoretic pattern of the hazelnut and soybean proteins as result of incubation with glucose were observed. Most of the allergenic proteins have been affected as manifested by the loss of intensity of their respective bands. The intensity of the bands representing hazelnut and soybean proteins decreased with the incubation time and smearing towards the top of the gel progressed. Incubation for 48 h led to aggregates formation with even much bigger masses: clearly, their migration into the running gel was hindered. Since SDS-PAGE experiments were performed under reducing conditions, the observed protein aggregation cannot be due to disulfide formation. This was most probably due to the covalent bounds formed between the formed carbonyls and the available α- or ε - amino groups. Nevertheless, some allergenic proteins turned to be fairly stable under the investigated conditions. The acid and basic subunits of the soybean derived Gly
0 2 4 6 8 10 12 14 16 18 0 10 20 30 40 50 n mo l car b o n y ls/ mg h az el n u t p ro tei n Time (h) 0 5 10 15 20 25 30 0 10 20 30 40 50 n mo l car b o n y ls/ mg so y b ean p ro tei n Time (h) 0,00 0,01 0,02 0,03 0 10 20 30 40 50 mg L y s/ mg h az el n u t p ro tei n Time (h) 0,00 0,01 0,02 0,03 0,04 0,05 0,06 0,07 0,08 0 10 20 30 40 50 mg l y si n e/ mg so y b ean p ro tei n Time (h)