Publisher’s version / Version de l'éditeur:
Vous avez des questions? Nous pouvons vous aider. Pour communiquer directement avec un auteur, consultez la première page de la revue dans laquelle son article a été publié afin de trouver ses coordonnées. Si vous n’arrivez pas à les repérer, communiquez avec nous à [email protected].
Questions? Contact the NRC Publications Archive team at
[email protected]. If you wish to email the authors directly, please see the first page of the publication for their contact information.
https://publications-cnrc.canada.ca/fra/droits
L’accès à ce site Web et l’utilisation de son contenu sont assujettis aux conditions présentées dans le site
LISEZ CES CONDITIONS ATTENTIVEMENT AVANT D’UTILISER CE SITE WEB.
ASTM Special Technical Publication, 718, pp. 412-428, 1980
READ THESE TERMS AND CONDITIONS CAREFULLY BEFORE USING THIS WEBSITE. https://nrc-publications.canada.ca/eng/copyright
NRC Publications Archive Record / Notice des Archives des publications du CNRC :
https://nrc-publications.canada.ca/eng/view/object/?id=5a8e891a-2437-4505-8178-17b17030d5bc https://publications-cnrc.canada.ca/fra/voir/objet/?id=5a8e891a-2437-4505-8178-17b17030d5bc
Archives des publications du CNRC
This publication could be one of several versions: author’s original, accepted manuscript or the publisher’s version. / La version de cette publication peut être l’une des suivantes : la version prépublication de l’auteur, la version acceptée du manuscrit ou la version de l’éditeur.
Access and use of this website and the material on it are subject to the Terms and Conditions set forth at
Problems in predicting the thermal properties of faced polyurethane
foams
Ser
TH1
National Research Conseil national N21d$
Council Canada de recherche5 Canadab
PROBLEMS IN PREDICTING THE THERMAL
PROPERTIES OF FACED POLYURETHANE FOAMS
. . -
by Mark Bomberg
Reprinted from
Thermal Insulation Performance
American Society for Testing and Materials
Special Technical Publication 718, 1980 p. 412
-
428Ell-
I L-
1ANALYZED
DBR Paper No. 973
Division of Building Research
L e s p r o p r i k t 6 s t h e r m i q u e s d e s m o u s s e s de polyurkthane Cvoluent d a n s l e t e m p s e n fonction d e s conditions kcologiques, du mode d e m i s e e n place e t d e l a pritsence d'une m e m b r a n e de r e v s t e m e n t d'es l e u r production. L1effet d l u n r e v 2 t e m e n t s u r l e r e n d e m e n t t h e r m i q u e d l u n composite v a d ' u n e lCg'ere a m k l i o r a t i o n de s a s t a - bilitk dimensionnelle 'a une rkduction s e n s i b l e du taux d e p e r t e de r C s i s t a n c e t h e r mique.
11 conviendrait d e t r a i t e r l e s polyurkthanes 'a revEtement c o m m e d e s c o m p o s i t e s pour l a m i s e & l l e s s a i , suivant une mkthode qui r e p r o d u i t l e plus fid'element p o s s i b l e l e s conditions r k e l l e s . I1 conviendrait a u s s i de d k t e r m i n e r l a composition d e s gaz d a n s l e s c e l l u l e s c o m m e r n e s u r e du procCdk de v i e i l l i s s e m e n t . Une t e l l e d h t e r m i n a t i o n apr'es exposition \a diffitrentes conditions a m b i a n t e s p e r m e t t r a i t une c o r r k l a t i o n approximative e n t r e l e s r k s u l t a t s ob- tenus e n l a b o r a t o i r e e t l e r e n d e m e n t r k e l .
L ' a u t e u r p r k s e n t e d e s r e n s e i g n e m e n t s de b a s e s u r l l e f f e t d e s f a c - t e u r s 6cologiques e t d e s s i m u l a t i o n s de v i e i l l i s s e m e n t s u r l a r 6 - s i s t a n c e t h e r m i q u e d e s polyurCthanes e t p r o p o s e un point de dCpart pour llCtude d e l a m6thode d ' e s s a i .
Autharhaa Replnt fmm Jourrul of Special Tehniml PuMlcatlMl 738
-mm.
A M m n Seckty for Teshng and M . W a l s
Mark
Bomberg
'
1916 Race Streef Philadelphia, Pa. 19103 1981Problems in Predicting the Thermal
Properties of Faced Polyurethane
Foams
AvaLuzzes
REFERENCE: Bomberg, Mark, "Problems in Predicting the Thermal Properties of
F dPdynrethaae Fauns," Thermal Insulation Performance. ASTM STP 718. D. L. McElroy and R. P. Tye. Eds., American Society for Testing and Materials, 1980, pp. 41 2-428.
ABSTRACT: The thermal properties of>polyurethane foams vary during service life depending on environmental conditions, the manner ifi which they are enclosed in the building partition, or if covered with facing membranes during their production. The effect of facing materials on thermal performance o f the composites may range from a slight improvement of dimensional stability to a substantial reduction in the rate of loss of thermal resistance. Faced polyurethanes should be tested as composite materials. using a method that simulates performance conditions as closely as possible. Such a test method should include determination of cell gas composition as a measure of the aging process. Determination of cell gas composition after a period of exposure to dif- ferent service conditions would allow an approximate correlation of laboratory results with in situ performance. The paper gives background information on effects of en- vironmental factors and aging simulations on thermal resistance of polyurethanes and provides a starting point for dicusssion of the testing method.
KEY WORDS: thermal resistance, thermal conductivity, polyurethane foams, faced polyurethanes, urethanes, aging, design, thermal properties, thermal insulation
During the production process the cells of polyurethanes are filled with a
*
captive blowing agent, for example, refrigerant gas. The refrigerant gas and carbon dioxide (if present) diffuse outward; the surrounding air diffuses in- wards, into the material cells. These diffusion processes occur at different rates; the slowest is the refrigerant gas. At the final stage all pores and cells of the material are filled with a mixture of air, water vapor, and a small frac- tion of blowing agent. The rate of diffusion depends on the chemical and physical structure of the polyurethane foam and the conditions of exposure.&
'Research officer, National Research Council of Canada, Division of Building Research, Ottawa, Ont., Canada.
412
"
1-r
I-
?
3
, !:Cj
-<=---,-- - - - =-jThe complete diffusion process can require several months to more than a hundred years.
Increasing the rate of gas diffusion is the most effective way to simulate, in
the laboratory, the so-called aged2 thermal properties of polyurethane foams. q The basis of its effectiveness is that higher temperatures accelerate all the
diffusion processes that occur in polyurethane foams.
In one of the laboratory conditioning procedures a specimen 25 mm thick is cut from a sample and its thermal resistance measured. It is then placed in an oven at a given temperature, either 60 or 100°C, for 28 days and the thermal resistance measured again. There may be some correlation between thermal resistance after 28 days' exposure at 100°C and the estimated in situ value for some materials, but the correlation is poorly established.
The method in current use in Canada for laboratory conditioning is based on dry heat conditioning for 28 days at the prescribed temperature of 100°C. There are many arguments for and against the 100°C exposure.
Arguments in favor are:
1. It causes a fast reduction of thermal resistance.
2. It helps to distinguish between "satisfactory" and "unsatisfactory" foams.
Against this procedure, one could state the following:
1. It is rather improbable that polyurethane would be exposed to such con- ditions. Such an exposure might introduce some changes in the "chemistry" of the material.
2. Environmental stresses occurring during actual service may be entirely different from those in the hot, dry conditioning exposure.
3. At a temperature of 100°C, the compressive strength, particularly in the direction perpendicular to the rise of the polyurethane [113 may fall below the level of stress introduced by the air pressure difference, causing rupture of some cells. This would probably not occur at lower temperatures.
4. 100°C exceeds the limit for "continuous use surface temperature" [2] indicated in materials standards; for example, Canadian Government Speci- fication Board (CGSB) Standard 51-GP-21M specifies the limit at 80°C.
The procedure of 28 days' aging at 100°C has been used for many years in
the industry and performs the role of quality control. Specimens exposed to
r
, high-temperature conditioning are usually 25 mm thick with dimensionssuitable for inserting into the apparatus for measuring thermal properties, that is, 300 by 300 mm. The present method of accelerated laboratory con- ditioning is, however, not suitable for faced polyurethanes, as materials faced with impermeable gas barriers cannot be sliced to 25 mm thickness. It
2Rednction in thermal resistance of polyurethane foams is termed "aging." 3The italic numbers in brackets refer to the list of references appended to this paper.
414 THERMAL INSULATION PERFORMANCE
may be possible to obtain diffemnt thermal resistances for the same material when conditioning and testing specimens with different geometries.
If this procedure were applied to the composites, the facing would have to be removed and the specimen cut to 25-mm thickness, or a set of new re- quirements relating geometry and exposure time would have to be intro- duced.
It is advisable, therefore, to consider whether a new method can be estab- lished to test the composite product instead of its core component. Such a test method should not only distinguish between "satisfactory" and "un- satisfactory" foams but also incorporate a procedure whereby the thermal resistance of laboratory-conditioned specimens could be compared with in
situ performance.
Backgroand Information on the Loss of Thermal Resistance of
Polyurethanes
Most refrigerant gases have a lower thermal conductivity than air. For example, with air rated as 100 percent at O°C, carbon dioxide and tri- chlorofluoromethane would have thermal conductivities of 60.7 and 34.5 percent, respectively [ 3 ] . The thermal conductivity of a mixture of any two gases can be estimated from the sum of the products of the thermal con- ductivities of the components and their molar concentrations. This simple equation was discussed by Skochdopole €41 and shown to deviate by not more than 10 percent from the actual thermal conductivity of a gaseous mixture.
If one knows the composition of cell gas, that is, the mole fractions of air and other gases, such as captive blowing gas, and also the initial ap- parent thermal conductivity" of the material, one can estimate the thermal conductivity of the conditioned specimen. Nadeau et a1 [3] developed an equation and showed that it agreed well with results of measurements carried out in a guarded hot-plate apparatus on polyurethanes with small uniform pores. Data calculated for foams with a coarse irregular cell struc- ture (and particularly those with distorted cells) were not in close agree- ment with the measured thermal conductivities.
Composition of a cell gas can be estimated from knowledge of conditions of exposure, material composition, and pore structure, and the specimen geometry if the appropriate diffusion coefficients are known.
Norton [ S ] used the diffusion equation to determine the ratio between blowing gas and air in the pores and change of thermal conductivity due to
4~pparent thermal conductivity is the correct term to describe thermal properties of fibrous and cellular thermal insulations (A app). Since it is generally accepted, the word "apparent" is omitted for brevity.
gas diffusion. He discussed four characteristic regions relating thermal conductivity to duration of exposure:
1. Initially air diffuses inward; carbon dioxide, if present, diffuses out- ward. This results in a rise in thermal conductivity.
2. A plateau occurs when the diffusion of air and carbon dioxide is ap-
proaching equilibrium and outward diffusion of refrigerant gas has not caused a significant increase in thermal conductivity.
3. Outward diffusion of the refrigerant gas causes a slow rise in thermal conductivity. This process continues until all the blowing gas has diffused from the cells.
4. The final stage occurs when an equilibrium mixture with a small per- centage of the blowing gas is present inside the cells.
Ball et al [ 6 ] identified the effect of average pore size (cell diameter) of polyurethanes on the change in thermal conductivity. Tests by Harding and James [71 showed that density changes in the range 29 to 37 kg/m3 did not significantly affect thermal conductivity and that the thermal conductivity perpendicular to the rise direction of molded foam varied by as much as 20 percent from that in the parallel orientation. The study also showed that the closed-cell content was of primary importance.
The increase in thermal conductivity due to one-dimensional diffusion5
_I_ in polyurethanes with 100 percent uniform closed cells was modeled by
Dixon et al [ 8 ] . The increase in thermal conductivity of
R11
blown poly- urethane is thoroughly discussed in the literature [9] where Norton's theo- retical equations were used to predict the thermal conductivity with rea- sonable accuracy provided the diffusion coefficients of the particular foam were known as well as the initial temperature and partial pressures of the gases in the cells.Meet of Environmental Factom on Thermal Properties of Polprethanes
The following factors related to environmental conditions should be con- sidered when discussing thermal properties of polyurethanes during their service life:
1. mean temperature,
2. mean relative humidity of the ambient air, 3. changes of mean temperature during service life, 4. temperature gradient across the material,
' ~ n nonstationary diffusion processes the permeability coefficient may differ from the dif- fusion coefficient if the specific gas content (sometimes called "solubility," that is, the gas content in the solid polymer and cell space of the material) is variable. These terms are often used interchangeably in the literature on polyurethanes and cause confusion.
416 THERMAL INSULATION PERFORMANCE
5. differences in humidities of the ambient air on each side of the layer or temperature gradient causing moisture vapor transmission through the material,
6. presence of water on the hot surface of the material in combination with temperature gradients.
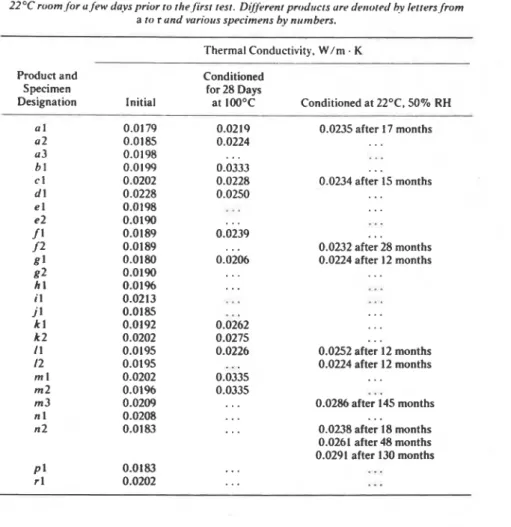
Studies of some of these environmental factors have been reported in the literature. Mean temperature was found to be of major significance for the diffusion process, and laboratory conditioning at elevated temperatures became standard practice in conditioning polyurethane foams. Exposure at an elevated temperature may cause additional stresses which may cause some cell walls to break. Thermal conductivity measurements carried out after 28 days' conditioning at 100°C (given in Table 1) identify a few ma- terials where cell walls have broken. It is not known to what extent these cells would be broken in a long time exposure at a lower temperature.
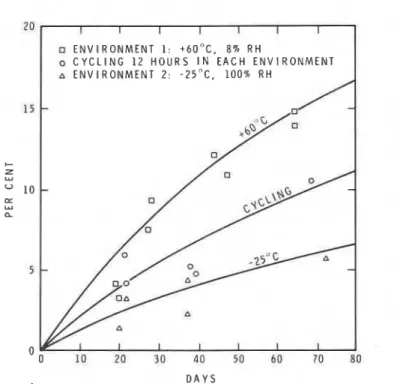
The effect of temperature cycling has been studied by Bettanini et a1 [ I O . I I ] . Figure 1, taken from this research, illustrates the test conditions and the results obtained. From these one can conclude that temperature cycling contributes nothing more to the aging process than does steady ex- posure at the same level of mean temperature.
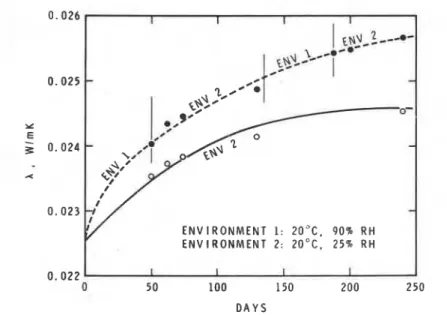
In a review of the factors affecting thermal conductivity in service, Paljak
I [ I 2 1 pr,esented the data shown in Fig. 2. Two specimens were exposed to a
steady temperature of 20°C. One specimen was kept in an environment with 25 percent relative humidity; the other was cycled between 25 and 90 percent relative humidity. The latter specimen showed greater increase in thermal conductivity than the one kept in a dry atmosphere.
The effect of moisture vapor transmission on the thermal effectiveness of t
polyurethanes was studied by Levy [ 1 3 ] . Figure 3 shows the thermal con- ductivity measured on a wall erected between a freezer having an air tem- perature of -29°C and a warm chamber with an air temperature of 38°C and approximately 100 percent relative humidity. Thermocouples inserted in the center of polyurethane insulation 10 cm thick indicated the average apparent thermal conductivity for the two layers with various mean tem- peratures. A parallel series of tests with the same material, but protected with hot-applied asphalt as a vapor barrier, showed an increase in thermal conductivity of only a few percentage points on the warm side; the average value did not change more than 2 to 3 percent during the 16 months of tests.
Figure 3 also illustrates the effect of moisture accumulation on the thermal properties of polyurethane foams. Thermal resistance of the ma- terial exposed to the higher temperature was lower than that of the material
.
exposed to lower temperatures, even though the same driving force of water vapor transmission was applied in all tests.TABLE I -Results ofthermu1 conductivit). tests on po!vurethune specimetls. 2.5 m m thick. Muteriuls were I to 10 wpeks old whet1 rcreived. rhe specimens were stored it1 u 519% RH 22OC room.for u few du.vs prior to the.firsr test. Dgtirent prodrrcts ure detror~d hv 1etters.from
a to r und various specimens hv numbers. -
Thermal Conductivity. W/m . K
Product and Conditioned
Specimen for 28 Days
Designation Initial at 100°C Conditioned at 22OC. 50% RH
u 1 0.0179 0.0219 0.0235 after 17 months a2 0.0185 0.0224 . . . a3 0.0198 ...
.
. . b l 0.0199 0.0333 ... c 1 0.0202 0.0228 0.0234 after 15 months d l 0.0228 0.0250...
e 1 0.0198 ... . . . e2 0.0190. . .
...
f 1 0.0189 0.0239...
... f 2 0.0189 0.0232 after 28 months as 1 0.0180 0.0206 0.0224 after 12 months g2 0.0190 ... . . . h 1 0.01%...
...
i l 0.0213 ... ... J 1 0.0185...
...
k I 0.0192 0.0262 . . . k 2 0.0202 0.0275 ... I I 0.0195 0.0226 0.0252 after 12 months 12 0.0195...
0.0224 after I2 months m 1 0.0202 0.0335...
m2 0.0196 0.0335.
,.
m 3 0.0209 . . . 0.0286 after 145 months n 1 0.0208 .,....
n2 0.0183...
0.0238 after 18 months 0.0261 after 48 months 0.0291 after 130 months...
P I 0.0183...
r l 0.0202 ......
temperatures performed by Bigolaro et al [I41 examined thermal conduc-
tivity of a polyurethane foam as a function of temperature and temperature
gradient in the range between 110 and 300 K for a few weeks. Thermal
conductivity was found stable within 0.2 percent except where there was a
peak in the curve at, for example, 236 K, where it was within 0.4 percent.
References [lo-161 contain discussions of environmental factors in rela-
tion to thermal conductivity measured during a particular environmental
exposure. Hilado [ I ] discusses the effect of environmental factors in terms
of dimensional stability of the material. Following the study of three types
of aging environments-cold, dry atmosphere; hot and dry; and hot.
418 THERMAL INSULATION PERFORMANCE
ENVIRONMENT 1: +6O0C. 8 % RH
o CYCLING 12 HOURS I N EACH ENVIRONMENT A ENVIRONMENT 2: - 2 5 ° C . 100% RH
-
0 10 20 30 40 SO 6 0 70 80 DAYS
FIG. 1-Percent variation of thermal conductivity of a 63-mm-thick specimen, with density 29 kg/m3. cut from a board stock. Initial value of thermal conductivity X = 0.020 W / m
.
K.(from Bettanini et a1 [lo]. Reprinted with permission of the authors. I
of high temperature and humidity is more likely to threaten the integrity and performance of the material than dry heat alone or low temperature." Accelerated Laboratory Conditioning
Refrigerant gas trichloromonofluoromethane (CI3CF) has a diffusion co- efficient of 2.25 X lop9 cm2/s at 2S°C. Rating it as 100 percent one ob- tains 533 percent at a temperature of 60°C and 1644 percent at 90°C [ 4 ] .
Exposing the material to elevated temperatures will accelerate the diffusion and shorten the testing time.
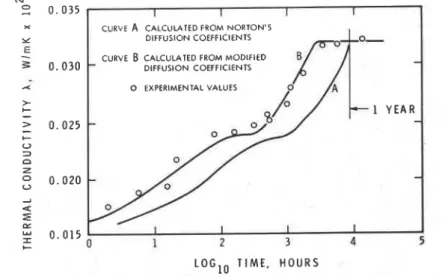
Figure 4 shows the results of tests on specimens 25 mm thick that were conditioned at 100°C and thermal conductivity measurements made at O°C. Two curves were calculated and compared with the results of the mea- surements; the only difference between the two sets of calculations is in the diffusion constants employed [9].
The difference between Curves A and B in Fig. 4 makes it necessary to modify the diffusion coefficients used in Norton's equation. There may be several reasons for these differences, for example, the effect of a particular
0.022 0 5 0 100 150 200 250 DAYS
-
-
-
ENVIRONMENT 1: 20°C. 90% RH ENVIRONMENT 2: 20°C. 25% R H I I I IFIG. 2-Thermal conductivity of polyurethane 130 kg/m3) as a function of time. Aging in steady environment compared with variation in relative air humidity. (After Paljak [12]. Re- printed with permission of the author.)
o MEAN TEMP. 20°C n MEAN TEMP. 4°C
o MEAN TEMP. -12°C
TIME, MONTHS
FIG. 3-Titernot conductivity of "wet" urethane foam versus time. Basis: unprotected in- stahtion. no vapor barrier. Moisture vapor driving force: 44 mm Hg. (After Levy [13]. Re- printed with permission of Technomic Publishing Company. Westport. Conn.)
structure of the tested specimen, a different temperature dependence of the diffusion coefficients, or cell-breaking due to exposure at elevated tempera- tures. Patten and Skochdopole [ I S ] showed that crushing cell walls in- creased thermal conductivity of the polyurethane.
420 THERMAL INSULATION PERFORMANCE
x CURVE A CALCULATED FROM NORTON'S
Y DIFFUSION COEFFICIENTS 0 EXPERIMENTAL VALUES > +
-
> 0 . 0 2 5-
-
I- U D n-
g
0 . 0 1 5 I I I 1-
C 0 1 2 3 4 5LOGlO TIME, HOURS
FIG. 4-Comparison of calculated and measured thermal conductivity curves for specimens conditioned at 100°C and measured at O°C. (samples 25 mm thick) (91.
The effect of elevated temperature is evident in some of the values shown in Table 1, which gives some results from tests carried out at the Division of Building Research, National Research Council of Canada, during the past 12 years. Because many of the products have been reformulated, these results are not representative of the polyurethane foams produced at present. They are also applicable to 25-mm specimens only. Some general con- clusions, however, can be drawn from the information in Table 1, as follows.
Several specimens were stored in an air-conditioned room with tempera- ture about 22OC and 50 percent relative humidity. Thermal conductivity measurements gave an average thermal conductivity X = 0.022 W/m K after 1 year, X = 0.024 W/m
.
K after about 2 years, and (about a 9 per- cent increase), X = 0.029 W/m - K after 11 to 12 years' storage (an in- crease of about 32 percent when compared with measurements after 1 year'si
storage).
!
The thermal conductivity of specimens of the same materials conditioned for 28 days at 100°C can be compared with these results. Several measure- ments fall in the range of X = 0.021 to 0.024 W/m
.
K (Products a. c, e. g and I ) ; some results show thermal conductivity in a range between 0.025 and 0.028 W/m.
K (Products d and k); Products b and m appear to reach the maximum possible reduction in thermal resistance with X = 0.033 W/m-
K, indicating a final equilibrium. In the case of Product m both specimens conditioned for 28 days at 100°C indicate possible cell breakage since a third specimen, which had been in storage for more than 12 years, showed an increase in thermal conductivity that was only 68 percent of the increase during the accelerated laboratory conditioning.There is a significant scatter between the test results in Table 1, which may be partly due to uncertainty as to the age of the specimens. The thermal conductivity of Specimen a 3 before exposure differs by about 9
percent from the average for Specimens a1 and 0 2 . The same scatter is also present for the conditioned specimens. This means that either the thermal resistance of a selected specimen should be noted as a function of time and exposure conditions, or statistically significant numbers of speci- mens must be tested to provide an average thermal resistance for that ma- terial.
A similar variability of the results was shown by Kuester [17] when com- paring several curves of thermal conductivity versus exposure time deter- mined by different researchers.
A Possible Method to Accelerate Laboratory Conditioning of Faced Polyurethanes
A variety of facing materials is used on polyurethanes but only a few act as effective barriers to gas diffusion and affect the thermal performance of materials.
Other materials provide resistance to moisture intrusion and improve di- mensional stability and perhaps, to a lesser extent, thermal resistance. These products will not perform in the same way as fully protected ure- thanes nor as unprotected, unfaced urethanes. They must be tested as composites and the test method should be as close as possible to conditions in actual use. The test method should fulfill two functions:
1. Indicate thermal performance of a foam system under severe environ- mental stresses.
2. Facilitate a correlation of in situ thermal performance with thermal performance of the laboratory-conditioned material.
The test method under consideration consists of the following:
I . Either a climatic exposure of a sample from which specimens are taken
for thermal resistance tests, or intermittent thermal resistance measure- ments on a conditioned sample.
2. Determination of the average cell gas composition two or three times during laboratory conditioning, preferably at the time of thermal resistance testing. The cell gas composition should be determined as the mean for the whole thickness of the specimen (see the Appendix).
3 . Measurement of thermal resistance at the beginning of the exposure, and after a specified time, for example, 28 or 90 days.
Conditioning of faced polyurethanes must be done on larger slabs; ap- propriate specimens for testing could be cut from the conditioned materials. Immediately after cutting the specimens to be used for thermal conductivity
422 THERMAL INSULATION PERFORMANCE
measurements, the edges of the specimens must be sealed, for example, by applying self-adhesive aluminium foil. If metal facing is used on the sur- faces, a slot will have to be cut in the facing material at the junction be- tween main and guard heaters immediately before testing. This slot should be covered with an impermeable plastic tape to prevent air from entering the specimen.
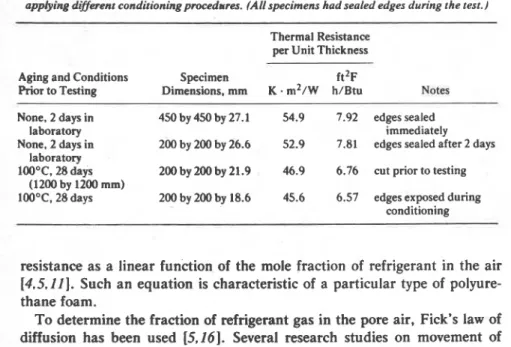
Specimen preparation forms a very important part of the test method as is illustrated in Table 2, which shows test results on two fresh and two conditioned specimens of the same sample. The specimens had a nominal thickness of 25 mm and were covered with aluminum facing on both sides. Both fresh (unaged) and aged specimens showed differences in thermal resistance when the cut edges were left exposed for some time.
Requirements regarding sampling techniques to determine cell gas con- tent and for thermal conductivity testing are not included in this paper. They must be specified in detail to ensure reproducibility of the con- ditioning procedure.
Two testing methods seem to be worthy of consideration:
1. Placement of the material specimen between two steady environments, for example, 70° f 2'deg C and 97
+
3 percent relative humidity [ASTM Test for Response of Rigid Cellular Plastics to Thermal and Humid Aging (D 2126-75)- Procedure C] and 23" f 2 deg C and 50+
5 percent relative humidity (room conditions) for three months (90 days).2. Exposing materials to successively larger temperature gradients with an intermittent thermal resistance determination as proposed by Sherman [I81 at the Thermal Insulation Conference.
Although Method 1 utilizes almost maximum continuous temperature and humidity conditions to which the materials could be exposed, the mean temperature is low, 46OC, and it is quite possible that thermal resistance may change very quickly and remain constant.
I Method 2 gives information on a larger span of the diffusion process as
well as a record of temperature on the hot side when a significant foam cell degradation was indicated by the inability to return to the reference thermal performance level. It would appear that a 600-mm heat flowmeter appa-
I
ratus could easily be adapted for such testing and that Method 2 shouldi
be carefully examined by manufacturers and testing laboratories.I
Concluding RemarksNorton's theory allows a prediction of thermal resistance as a function of time from a knowledge of specimen dimensions, initial cell gas composition, conditions of exposure, and diffusion coefficients appropriate for a par- ticular cell structure of polyurethane foam. It is concerned with the change in composition of the gaseous mixture in the cell and expresses thermal
TABLE 2-Thermal resistance determined on polyurethane foam (Code No. 314-591 after applying dt#mnt conditioning procedures. (All specimens had sealed edges during the test.)
Thermal Resistance per Unit Thickness
Aging and Conditions Specimen f t 2 ~
Rior to Testing Dimensions, mm K
.
m 2 / w h/Btu NotesNone, 2 days in 450 by 450 by 27.1 54.9 7.92 edges sealed
laboratory immediately
None. 2 days in 200 by 200 by 26.6 52.9 7.81 edges sealed after 2 days laboratory
100°C, 28 days 200 by 200 by 21.9 46.9 6.76 cut prior to testing
(1200 by 1200 mm)
10O0C, 28days 200 by 200 by 18.6 45.6 6.57 edges exposed during conditioning
resistance as a linear function of the mole fraction of refrigerant in the air
[4.5.11]. Such an equation is characteristic of a particular type of polyure-
thane foam.
To determine the fraction of refrigerant gas in the pore air, Fick's law of diffusion has been used [5,16]. Several research studies on movement of moisture in a capillary system [19] indicated that Fick's law is applicable when the appropriate diffusion coefficient corresponds to the combined liquid and vapor transport6 p r e s s e s . A reason for this might be that using the "modified diffusion constants" produced good agreement with the experimental values (Fig. 4), while the diffusivity coefficient originally de- termined (Curve A) produced a shift in the time scale. One way to establish diffusivity coefficients would be to determine a few curves of concentration distribution after various periods of exposure to the same environmental conditions as the exposure for which thermal resistance is sought. Because it is impossible to determine the homogeneity of a block of material and because of an additional resistance to diffusion created by skins or facing, it is not practicable to use modified diffusion coefficients to estimate the diffusion coefficients of faced materials.
It is proposed that the laboratory testing of thermal properties be ex- tended to include the determination of cell gas content. From this, a formula could be established which would be valid for each product tested in the laboratory. (The thermal resistance would be expressed as a linear function of the mok fraction of the refrigerant gas.) This formula could be utilized only after specimens had been exposed for a sufficient number of years to provide the gas mixture required for its determination. The polyurethane 6 ~ n a capillary system exposed to a temperature gradient, movements in liquid and gaseous phases occur simultaneously and often in both directions, resulting in a change of the ef-
fective "diffusivity" coefficient. I
424 THERMAL INSULATION PERFORMANCE
foam specimens should be drilled across their whole thickness to determine the average cell gas composition and thus allow an estimate of the corre- sponding thermal resistance for selected climate and service conditions.
Acknowledgments
The author wishes to express his appreciation to C. J. Shirtliffe, Division of Building Research, National Research Council of Canada and to Morton Sherman, Jim Walter Research Corp., for comments and discussions of the problem, and to A. Desaulniers and R. Ironside, Division of Chemistry, National Research Council of Canada, for determining the Freon 11 content in a polyurethane specimen. This paper is a contribution from the Division of Building Research, National Research Council of Canada and is pub- lished with the approval of the Director of the Division.
APPENDIX
Adytical Report of Polypntbure Rigid Foam Board
[Analysis carried out by A. Desaulniers and R. Ironside, Analytical Section, Division of Chemistry, National Research Council of Canada (Lab. No. 16650, 19 Jan. 1978)]
The polyurethane rigid foam board was sampled by cutting "cores" through its thickness with a No. 13 cork borer. These cylinders measured about 22 mm in diameter and 23 mm in length. Their weight was about 0.220 g.
To identify the captive blowing agent, a large hypodermic syringe was filed with "cores" and the needle was inserted into an evacuated infrared gas cell through a septum; the "cores" were crushed by driving home the piston of the syringe. The infrared spectrum of the gas so obtained established that it was trichloromonofluoro- methane. C13CF (Freon 11).
One or two of the cylinders just described were burned in the Parr oxygen bomb in 35 atm of oxygen, the combustion products W i g absorbed in 10 ml of 0.2-N sodium carbonate solution. The chlorine was determined in the absorbent by titrat- ing with N/10 silver nitrate solution after acidification with nitric acid.
The total chlorine content of three specimens tried was 8.8.9.4 and 10.0 percent by weight.
In order to correct this total chlorine value for any chlorine compounds in the nonvoid body of the plastic, a few "cores" were ground finely in a mechanical pul- verizer and the f i e powder so obtained was degassed in vacuo for 30 min. Micro- scopic examination confirmed that no intact cells had survived the grinding process. Two specimens of this powder were then treated as described above and gave the following values: 4.6 and 4.7 percent weight/weight chlorine.
The corrected values for the chlorine in the cell volume, namely, 4.2, 4.8, and 5.4 percent weight/weight, were calculated to C13CF to give Freon 11 contents of the specimen of 5.4. 6.2. and 7.0 percent by weight.
This publication i s being distributed by the Division of Building R e s e a r c h of the National R e s e a r c h C o a c i l of Canada. I t should not b e reproduced in whole o r in p a r t
without p e r m i s s i o n of the original publisher. The Di-
vision would b e glad to b e of a s s i e t a n c e in obtaining s u c h permission.
Publications of the Division m a y b e obtained by m a i l - ing the a p p r o p r i a t e r e m i t t a n c e (a Bank, Exprese, o r P o e t Office Money Order, o r a cheque, m a d e payable
to the R e c e i v e r G e n e r a l of Canada, c r e d i t NRC) t o the
N a t i o n a l R e s e a r c h Council of Canada, Ottawa. KIA OR6.
Stamps a r e not acceptable.
A l i s t of a l l publications of the Division i s available and
m a y be obtained f r o m the Publicatione Section, Division of Building Research, National R e s e a r c h Council of