Publisher’s version / Version de l'éditeur:
Journal of the Illuminating Engineering Society, 16, 1, pp. 128-142, 1987
READ THESE TERMS AND CONDITIONS CAREFULLY BEFORE USING THIS WEBSITE. https://nrc-publications.canada.ca/eng/copyright
Vous avez des questions? Nous pouvons vous aider. Pour communiquer directement avec un auteur, consultez la première page de la revue dans laquelle son article a été publié afin de trouver ses coordonnées. Si vous n’arrivez pas à les repérer, communiquez avec nous à PublicationsArchive-ArchivesPublications@nrc-cnrc.gc.ca.
Questions? Contact the NRC Publications Archive team at
PublicationsArchive-ArchivesPublications@nrc-cnrc.gc.ca. If you wish to email the authors directly, please see the first page of the publication for their contact information.
NRC Publications Archive
Archives des publications du CNRC
This publication could be one of several versions: author’s original, accepted manuscript or the publisher’s version. / La version de cette publication peut être l’une des suivantes : la version prépublication de l’auteur, la version acceptée du manuscrit ou la version de l’éditeur.
Access and use of this website and the material on it are subject to the Terms and Conditions set forth at
Toward a model of visual performance: a review of methodologies
Rea, M. S.
https://publications-cnrc.canada.ca/fra/droits
L’accès à ce site Web et l’utilisation de son contenu sont assujettis aux conditions présentées dans le site LISEZ CES CONDITIONS ATTENTIVEMENT AVANT D’UTILISER CE SITE WEB.
NRC Publications Record / Notice d'Archives des publications de CNRC:
https://nrc-publications.canada.ca/eng/view/object/?id=2a09f274-b203-422b-864c-05cfea4f358c https://publications-cnrc.canada.ca/fra/voir/objet/?id=2a09f274-b203-422b-864c-05cfea4f358cSer
TH1
~ 2 i a
no.
1461
National Research
Conseil national
c. 2
Council Canada
da recherches Canada
BWX:
Institute for
lnstitut de
Research in
recherche en
Construction
construction
Toward a Model
of
Visual Performance:
A Review of Methodologies
by M.S. Rea
Reprinted from
Journal of the Illuminating Engineering Society
Winter 1987, p. 128- 142
(IRC Paper No. 1461)
Price $4.00
NRCC 27848
ABSTRACT
Literature in the field of illuminating engineering is
critically examined in terms of validation and extension of a
suprathreshold visual performance model proposed in a companion
paper.
It is concluded that very few such studies can be used
to assess or advance a visual performance model owing to
problems with procedure and measurement.
Recommendations are
made for future studies of visual performance.
On a 6tudi6 d'un oeil critique la documentation ayant trait
3
1'6clairagisme au point de vue de la validation et de
l'extension d'un modi2le de performance visuelle supraliminaire
propos6 dans un document compli5mentaire.
La
conclusion en est
que trBs peu d'Bf-=
b--Deuvent
servir
B
Qvaluer ou
3
encourager 1'
-9 visuelle enraison des
F
mgthodes et
des
t
echniq~
Formule des
recommandati
ns l'avenir
en matisre
d
Toward a Model of Visual Performance:
A
Review of Methodologies
M. S. Rea
Introduction
The lighting practitioner directly influences the speed and accuracy of visual response (i.e., visual per- formance) by affecting the illumination level and lighting geometry in a space. Yet visual performance is clearly but one aspect of performance at a realistic task; training, intelligence, motivation, and many other factors also play an important role in defining a per- son's level of task p e r f ~ r m a n c e ! ~ ~ Special procedures and measurement techniques are required to mini- mize the impact of these "non-visual factors" on mea- sured behaviour when trying to isolate visual per- formance from task performance. As argued in this paper, many studies that describe performance of realistic tasks have not incorporated such procedures. What is more, two or more visual factors may be con- founded in some of these studies. Thus, the measured behaviour has been influenced by some unknown combination of visual parameters. Although these studies give a general flavor of how lighting and other stimulus parameters affect visual performance, it is usually impossible to delineate unambiguous rela- tions between human visual responses and stimulus conditions. If the lighting practitioner is to follow re- cent, more refined lighting recommendations? it will be necessary to have more refined information from research to implement the recommendations.
The present paper is a critical evaluation of litera- ture from the area of illuminating engineering on the performance of human subjects at a variety of visual tasks. It is concluded that most of these experiments have procedural problems or have dealt with more than visual performance alone. Because visual perfor- mance cannot be isolated in the experiments, most of them cannot be used to set precise guidelines for relating lighting and visual performance, nor can they be used to validate or extend the visual performance model (Figure 1)* presented in the companion paper. Experiments to investigate performance at several kinds of visual task are examined in the pre'sent paper. Each of the subsequent sections is devoted to one task. Common problems with procedures and measure- ments are identified and discussed in terms of the dif- *Except where noted, all reported contrast values describe stimuli in which the target is darker than the background. Contrast (C) is
wried
as: C = (LB - LT)/LB where LB is the luminance ofthe background and LT is the luminance of the target.ficulties they create in specifying the relationship between lighting and visual performance. Finally, recommendations for future experimentation and measurement are proposed that can lead to precise lighting recommendations and facilitate assessment and advancement of the visual performance model proposed in the companion paper.4
Numerical verification task
Performance of the numerical verification task forms the basis of the model. Data using the same task have already been Briefly, subjects are required to find and then indicate discrepancies between juxtaposed printed number lists "as quickly and accurately as possible" on a given trial. The lists are examined once from top to bottom, and the time to complete the comparisons and note the number of errors of both omission and commission are recorded for each trial. In one set of numbers lists (response lists) all the sheets are printed in high contrast ink on white paper; in the other set of numbers lists (refer- ence lists) the sheets are printed with different types of ink on white paper. The lists are usually examined under different levels of illumination and lighting geometry. Experimental combinations of all these fac- tors produce different task background (adaptation) luminances and contrasts.
Dependent variable
A performance measure, score, based on total time and errors identified during each trial5 was used as the dependent variable in all the numerical verifica- tion studies prior to this."
Score = (20
-
E)I(S+
5) (1)where
E = number of errors per trial (both misses and false positives)
S = total time (s) to compare the lists.
This measure can affect the characterization of visual performance for a variety of reasons described in Appendix A of the earlier report by Rea.4 There it was noted that score has a slightly nonlinear relation with the primary measures, misses, false positives, and
total time. Further, total time does not completely isolate the changes in visual response due to experi- mental manipulation because it is a composite of the times to 1) mark discrepancies, 2) read the lists of fixed contrast ( i ~ . , response lists), and 3) read lists of different contrasts (i.e., reference lists).
The visual performance model was based upon time to read the reference lists while performing the numerical verification task. It is argued that this refin- ed measure best characterizes visual performance for reading alphanumeric stimuli. Direct comparison of visual performance model predictions and score values from the numerical verification task can be made in Figure
2,
which presents score data from Ap- pendix A of the previous report and model predictions of relative visual performance (RVP) from equation (C7) of Appendixd.
The dashed lines through the score data are described by equation (Al), Appendix A. All RVP predictions were normalized to units of score using one common factor; in this case the factor was equal to the average of the four values of R,,,, one for each background luminance, determined from equation (Al).Although the model predictions are similar to the performance score values, it is clear from Figure 2(a-
d) that the score data are flatter at medium and high contrasts than the model predictions. Further, the model predictions become less like the performance score values as illumination level (background luminance) is reduced. Thus, the characterization of visual performance depends not only on the experi- mental design and protocol but also on any transfor- mations of the response measure. The dependent measure used in any study must be carefully scrutin- ized to determine whether it is an appropriate repre- sentation of visual performance. Ideally, the perfor- mance measure should be based simply on visual response times or errors.
Conjbunding subject groups with experimental variables Despite the use of a common task, other factors specific to each of the studies using the numerical verification task
(e.g.,
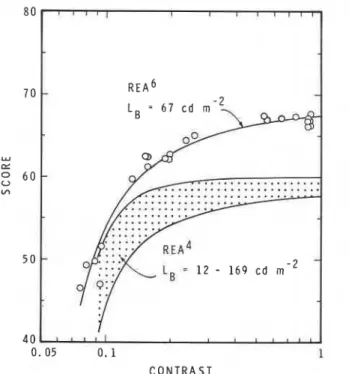
subjects, viewing angles, size of numbers) can affect the observed levels of perfor- mance. Further, many undefined factors such as motivation, manual dexterity, or intelligence can also influence the results. The experimental conditions employed by Rea6 are (not surprisingly) almost iden- tical to those reported later.4 In the earlier study a different group of young adult subjects with excellent uncorrected vision and positioned in a chin rest per- formed the numerical verification task at a fixed background luminance of 67 cd m-2. Figure 3 shows the mean scores from that study, plotted with the highest (169 cd m-2) and lowe$ (12 cd m-*) curves through the score data from Figure2.
The curve through the score data from Rea's earlier study6 wasobtained using equation (Al) in Appendix A.
Although the two sets of data are similar, the ab- solute levels of performance score were different in the two experiments. Subjects in the earlier study had higher scores, on average, than did subjects in the more recent report. Thus, even at a task run under essentially identical conditions and using subjects nominally equivalent, the absolute levels of perfor- mance for two populations of subjects differed for unknown reasons.
At present, model predictions of visual perfor- mance will have to be normalized to experimental data. Each set of data can differ in the absolute level of performance owing to differences in the experi- mental variables or, as shown, to unspecified differ- ences amoung sampled subject populations. A dif- ferent normalization factor will probably be required, therefore, whenever new subject populations are employed.
Applying the model predictions to different experi- ments having changed subject populations presents no difficulties, but utilizing various subject popula- tions within one experiment can be very problematic It is possible to compare model predictions with ex- perimental data only roughly if variations in the stim- ulus parameters are confused with sub-populations of subjects within an experiment. For example, if one sub-population of subjects is given a task under one illumination level and another sub-population is given the same task under another illumination level,'' it will be impossible to determine whether the observed differences in performance are due to dif- ferences in illumination, to differences in the subject groups, or to both factors.
In principle, very large sub-populations should have very small differences in their average performance potential. It is not always practical, however, to employ very large populations in one experiment. Even fairly large sub-populations (e.g., n = 40; see section entitled Tinker's reading experiments) may be different in visual capabilities, motivation, manual dexterity, etc. As these factors influence measured performance, it is always better to reduce the likelihood of potential pro- blems by ensuring that subject groups (sub-popula- tions) are not confounded with experimental manipu- lations. Although confounding subject groups with stimulus variables in an experimental design has not been a problem in studies of the numerical verifica- tion task, it was a problem in several of the studies to be discussed later in this paper.
Photometric measurements
Clearly, errors in the photometric specification of the stimulus conditions can adversely affect compari- sons between experimental data and model predic- tions. In studies by Rea?6 Slater et al.: and Slater and Perryg so-called "calibration squares" were printed JOURNAL of the Illuminating Engineering Society Winter 1987
with the numbers on the reference and response sheets so that target luminances as well as background luminances could be measured to determine task con- trasts. For a known lighting-task-subject geometry, then, it was possible to specify task contrast. Only in lighting conditions approaching those in a hemisphere do variations in geometry become inconsequential to task contrast. Directional lighting can greatly influence the perceived task contrast and, therefore, the expect- ed level of visual performance.
In a recent study by Rea et al." it became clear that subjects deliberately try to avoid contrast-reducing veiling reflections in order to maintain a high level of performance. In previous studies by ~ e a ~ " and by Slater and Perryg subjects' head positions were fixed in a chin rest so that the lighting-task-subject geometry and therefore the task contrast were known. Smith and Rea5 seated subjects in front of a white viewing booth roughly simulating hemispherical lighting con- ditions. Head and body positions were not restrained in any way, so that variations in head position did not seriously affect task contrast because the lighting was non-directional?* But although head position could not seriously affect task contrast, head and body movements could affect apparent size of the stimuli. As Rea et al." also point out, subjects tend to move closer to the task as illumination levels are reduced, increasing the apparent size of the stimuli and thereby permitting better performance. It is therefore impossible to use the Smith-Rea data to isolate com- pletely the effects of illumination level from apparent task size in assessing visual performance. This type of confounding is also present in several of the studies discussed below.
Conclusions
The numerical verification task can be useful in characterizing visual performance, but special precau- tions with regard to experimental design and execu- tion must be implemented. In particular, task con- trast, luminance, and size must be carefully controll- ed. An appropriate measure of performance, free of distortion, must also be defined before the data can be used to validate and advance a visual performance model.
Tinker's reading experiments
Early reading performance tests were conducted by **It should be noted that a calibration square was not printed on the task sheets used by Smith and ~ e a ? The controst of the tad materials had to
be estimated by a comparison method. The luminance of the printed digits was estimated by measurements of a larger piece of paper matched in brightness to the printed digits. Although the task contrasts were estimated under hemispherical lighting and did not valy when subjects adjusted their postures, there may have been some discrepancies between the contrasts actually seen by the subjects and the estimated contrasts that were reported in the study.
Tinker using different task contrasts and various levels of ill~mination."~'~ In his 1959 experiment, for example, several groups of subjects performed speed- reading tests.15 Of special interest were two groups of university students of unknown age or ophthalmic capability; one group of forty saw printed passages with dark ink on white paper under six illumination levels, and another group of forty saw passages printed with dark ink on grey paper under the same six illumination levels.
Confounding with task contrast
As pointed out by P o ~ l t o n , ' ~ changing the reflec- tance of the task background affects not only task con- trast but adaptation luminance as well. Performance is known to vary with both parameters, and when they are confounded, as in this experiment, differences in performance cannot be attributed to one factor alone. Nevertheless, the contrasts of the two printed targets employed by Tinker were both quite high (according to the reported reflectances). The compressive visual response to contrast should produce nearly equiva- lent levels of performance for high contrasts at equal background luminances. Assuming that all other fac- tors are constant, performance differences should therefore be mainly attributable to changes in back- ground reflectance.
A serious confounding in Tinker's experiment (identified in the previous section) was between sub- ject groups and background reflectances. Differences
in the visual capabilities of the sub-populations or in their psychological profiles (e.g., intelligence or moti- vation) could have contributed to the observed dif- ferences in reading performance at the different task background reflectances. In fact, there were reliable differences between the two sub-populations at match- ed task background luminances, indicating that even for relatively large sub- populations (n = 40), absolute differences in group performance potential can affect the results.
Photometric measurements
For reasons outlined in the previous section, there is also uncertainty about the accuracy of the reported photometric values that define the visual conditions experienced by the two groups of subjects. First, the reported values were reflectance measurements of paper and ink under a lighting geometry different from the lighting conditions actually experienced by subjects during the experiment. Further, documenta- tion was not provided as to how the reflectance mea- surements were obtained from the very small letters in the printed text. Unless luminance measurements are obtained from some "calibration square" printed with the text it is unlikely that the reported values accu- rately represent ink density. Second, although both groups of subjects saw the reading passages under six
levels of illumination ranging from 54 to 4300 lx, it is not clear that lighting geometry and thus task contrast did not change with changes in illumination level. Finally, it is possible that subjects systematically ad- justed their posture under the different lighting geometries to improve task contrast and thus main- tain a high level of performance. In truth, the report- ed photometric values may only be crudely represen- tative of those actually seen by the subjects.
Although there is a consistent performance differ- ence across illumination level for the two subject groups (confounded, of course, by the two back- ground reflectances), the levels of performance across luminance are approximately constant. Even the relative performance of the two subject groups is questionable, however. As discussed in the preceding section, reading performance can probably be main- tained if a subject systematically moves closer to the task as illumination is reduced. It seems very likely that the subjects in Tinker's experiment were unre- strained and behaved in this manner. As in the Smith- Rea study,5 it is difficult to use these data to advance a visual performance model since illumination level and apparent size of text were probably confounded.
Dependent variable
The measure of performance for this experiment was the time to read a passage. At least two problems with the dependent measure make it of questionable utility for characterizing visual performance. First, the levels of comprehension were assumed to be high but were never verified, although Tinker reported that previous tests gave high levels of comprehension near 100 percent. In principle, the single dependent mea- sure of reading speed will not reflect any possible dif- ferences in "accuracy" of reading ( i d , comprehen- sion). Without some direct verification of a high cor- relation between time and errors (e.g., Rea6), reading speed may be a distorted representation of visual per- formance. Second, the very high levels of comprehen- sion imply a very easy test for university students. Depending upon the kind of questions, it is con- ceivable that university students could answer many of the questions correctly without even reading the pas- sages. In essence, Tinker's comprehension measure may be completely insensitive to visual performance. A performance measure should be realistic, but it must also be sensitive to the parameters manipulated in the experiment.
Conclusions
Although Tinker's experiment may give a general indication of visual performance at a reading task, a variety of serious procedural problems make it im- possible to use these data, or those from his earlier studies, to evaluate the present, or any other, model of visual performance quantitatively. Other, more care-
fully controlled studies of reading performance would have to be used to validate and advance the visual performance model. Special care must be taken in this kind of experiment, however. Reading for com- prehension may actually require more thinking than seeing,16 and precautions must therefore be taken to ensure that the recorded responses reflect visual per- formance alone.
Experiments using visual search
Many investigators have employed search task^!^^''^^^ The most widely known was first employed by W e ~ t o n . ~ " ~ ~ In this kind of experiment subjects are asked to search an array of Landolt rings for those having a specific gap orientation. The arrays can be printed in different sizes and inks and on different background reflectances. In an attempt to explore parametrically some of the factors important to visual performance, subjects are presented with the arrays under different levels of illumination. As argued above, the results obtained in such experiments de- pend not only on the visual factors employed in the experiment but also on factors such as the accuracy of the photometric measurements, experimental design and protocol, subjects' behavior, and scoring pro- cedures.
Weston's early Landolt ring experiments
Documentation Although Weston's Landolt ring search are commonly-cited studies of visual perfor- mance, they were not adequately documented. Light- ing geometry and task specularity (both target and background) interacted to affect luminance and con- trast. Nowhere does Weston document how ink and paper reflectances were measured or under what con- ditions. Consequently, very little is known about the stimulus conditions actually presented to his subjects. Further, in his 1945 studiesz2 both paper and ink reflectances were varied to change task contrast, so that it is imposible to attribute the measured effects to changes in contrast, background luminance, or both. Weston did not provide details about the positions assumed by subjects during testing. Presumably they were unrestrained and could adjust their posture and position in performing the task to suit themselves. Again, one must assume that illuminance and ap- parent size are confounded in the study. The visual capabilities of the subjects are unknown. Neither is it clear what experimental design was employed. One does not know, for example, whether all subjects saw all conditions. Weston's early landmark efforts in in- vestigating visual performance must be lauded, but it would be impossible to have confidence in more than the general trends indicated by these experiments because of inadequate documentation.
Dependent measure The performance scoring pro- cedure is one of the most serious problems with JOURNAL of the Illuminating Engineering Society Winter 1987
Weston's experiments. He was the first to attempt to combine speed and accuracy in a performance metric, and many others have followed his example; several are discussed in this paper. Accuracy in Weston's ex- periment was defined as the number of hits ( i ~ , targets found and marked) relative to the total number of targets in the array.
A proper measure of accuracy should also consider the number of correct rejections ( i ~ , non-targets found identified and not marked). Further, without knowing both hits and correct rejections it is impossi- ble to tell how many stimuli were actually inspected during the recorded time (one minute or shorter) and therefore impossible to make a proper estimate of speed (stimuli inspected per unit time). Consequently, his performance score is completely inappropriate as a measure of visual speed and accuracy. More will be said about the importance of determining the num- ber of stimuli actually inspected per unit time in the Boynton and Boss section of this paper.
Consistency and reasonableness of results The two sets of performance curves for 3.0-min gap sizes reported by Weston in 194522 are shown in
Figure
4. Not only are the two sets inconsistent in their prediction of perfor- mance but some of the smoothed functions are counter to known trends of visibility versus lumi- nance. For example, the slopes of some of the perfor- mance versus luminance functions for low contrast stimuli are flatter than those for high contrast stimuli. In effect, this indicates that light level is less important to low-contrast material than to high-contrast materi- al, a prediction that can be easily dispelled by a simple demonstration. If one looks through rotating, crossed- polaroid filters at high and low contrast stimuli on a luminous background, the low-contrast stimulus dis- appears much more quickly than the high-contrast stimulus as background luminance is reduced. Conclusions One is left to conclude that Weston's studies cannot be used as a basis of validation or ex- tension of a visual performance model owing to in- adequate procedural details, inappropriate scoring procedures, and inconsistent results.Modern expm'ments
Boyce BoyceZ0 employed Weston's Landolt ring search task with some procedural differences. Boyce used total, self- paced scanning time as a measure of visual performance. Unlike Weston, who identified the im- portance of eliminating response times from esti- mates of visual performance, Boyce ignored response (action) time. Errors (of both omission and commis- sion) were also used to index performance.
Although total time and errors changed with varia- tions in illumination, these dependent variables were not compared directly to discover whether they gave similar or dissimilar representations of visual perfor- mance. Actually, the data were probably too variable to
Winter 1987 JOURNAL of the Illuminating Engineering Society
permit proper comparison. As it is not known whether errors and total time are alike, it is uncertain whether either response measure actually characterizes visual performance.
Four sets of Landolt rings were presented to all sub- jects, one set for each combination of two gap sizes (1.5 and 2.4 min) and two contrasts (C = 0.4 and C =
0.7). Actually, it is not clear from the published reportz0 whether the reported task contrasts were obtained under the actual experimental conditions. In a personal communication, Boyce has confirmed that the photometric measurments were obtained under the conditions actually experienced by the sub- jects. The different sets of Landolt rings were pre- sented under five different levels of illumination. Sub- jects' viewing angles and distances were controlled, avoiding systematic confounding of illumination level and apparent size, but a different set of subjects was used for each of the five light levels. Because subject groups are confounded with illumination levels, com- parisons between performance values and the predic- tions from a visual performance model would not necessarily coincide.
Waters and h e In the experiment by Waters and Loe,lg arrays of high-contrast (C = 0.9) Landolt rings (gap size = 1.5 min) were presented to subjects under dif- ferent light levels and different light sources. Every subject saw all combinations of light level and light source in a Latin square experimental design.
It is not clear how the contrast value reported for the Landolt rings was obtained, but measurements were made "in the position they were placed for the tests (p. 7)."19 For very high contrast targets like those used in the experiment, however, it is not important to determine the contrast values accurately owing to the predicted saturation in visual response at medium to high contrasts. Despite uncertainties in the mea- surement technique, therefore, predictions of visual performance at a high contrast task should not be grossly inaccurate. Unfortunately, subjects were not adequately restrained while performing this task. As illumination levels were reduced, they could move closer to the task to maintain a high level of performance.
Performance was defined as the sum of the hits and correct rejections divided by the "net inspection time." Net inspection time was taken to be the total time to scan the array, row by row, minus the "action time" to mark targets in the array. There was no justifi- cation for combining net inspection time, hits, and correct rejections in this way; the measure of perfor- mance must therefore be suspect. Nevertheless, this combination seems to be appropriate since both hits and correct rejections as well as action time are taken into account.
Conclusions Modern experiments using the classic Lan- dolt ring search task have used methodologies that are
improvements on those used earlier by W e s t ~ n . " ' ~ ~ Largely typified by the two discussed above, these ex- periments incorporate techniques that do not com- pletely overcome possible confoundings. BoyceZ0 con- trolled viewing angles and distances but used dif- ferent subject groups for different illumination levels. Waters and ~ o e ' ~ used the same subjects throughout, but did not constrain head position or posture. Beyond these problems, and for reasons to be outlin- ed, even the best controlled search tasks may be inap- propriate for estimating visual performance.
Boynton and Boss
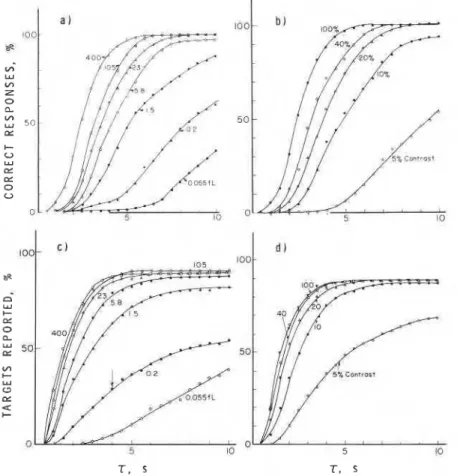
Boynton and Boss1' conducted an unusual and well documented study that did not incorporate the Lan- dolt ring matrix. An array of sixteen, randomly locat- ed stimuli was presented to young adults with normal visual acuity under different conditions of stimulus contrast (luminous decrements) and background lum- inance. Viewing distance was held constant while sub- jects searched for a small square (9 min on a side) among 15 circles (10 min in diameter). For half the trials 16 circles were presented (it., no square was presented). The time between onset of the stimulus ar- ray and a button press by the subject, indicating that a square was or was not included in the stimulus array, was measured for every trial. A maximum of 20 s was allowed for a trial. Figure 5 shows the results of the study by Boynton and BOSS'' characterized by the two
measures of performance. The cumulative percentage of trials in which subjects correctly reported no square (percentage of correct responses) and the cumulative percentage of trials in which subjects cor- rectly identified squares (percentage of targets report- ed) are plotted as a function of search time, 7, in
seconds. For a stimulus array of 100 percent contrast, the search times required to reach the maximum level of performance regularly decrease as background luminance increases (Figure 5a, c). Similarly, for a background luminance of 1370 cd m-', the search times to reach maximum levels of performance regu- larly decrease as the stimulus array contrast increases (Figure 5b and d). Qualitatively, these findings are like those predicted in the visual performance model; visual performance should increase regularly with both background luminance and target contrast. Quantitatively, however, it is impossible to compare the visual performance model and the search data because the experimental paradigm used by Boynton and Boss, and possibly in all search experiments, pro- bably confounds the number of targets searched with the difficulty of the visual conditions.
Response time and number of stimuli searched Response times can be affected by the visual processing time for each target ( i ~ , visual performance) or, obviously, by the number of targets actually processed; the fewer to be searched the shorter the response times. The main
problem with the Boynton and Boss procedure is that one does not know how many stimuli were actually processed. Their recorded times are based upon an unknown mixture of visual processing time and searching time. To isolate visual performance in these experiments one would have to estimate, and then eliminate, search time, which is comprised of time for each eye movement and total number of eye move- ments. It is probably not possible to use a simple con- stant to estimate search time; it is logical that subjects will systematically look at fewer stimuli under better visual conditions (high luminance and high contrast). By definition, targets become more visible as the stimulus conditions improve. Under these more con- spicuous stimulus conditions, then, subjects would make fewer eye movements to find the target. The manner of visual search changes, therefore, with the level of visibility, so that the number of targets actually searched tends to be systematically fewer as visual con- ditions improve. As a consequence, searching time is probably confounded with the difficulty of the stimu- lus conditions. Without accurate eye movement data, yielding both time of each eye movement and how many were made, it would be impossible to estimate searching times or to evaluate the data in terms of a visual performance model.
Conclusions In the Landolt ring search task the stimuli are usually arranged in a matrix. One might suppose that subjects would scan the stimuli in a regular man- ner (e.6, top left to bottom right), looking at every target once. This may not always be true. Some rows or rings within rows may be missed inadvertently. Simi- larly, some rows or rings may be scanned repeatedly. If these are random occurences, it is only necessary to collect more data to determine the relative changes in visual performance with variations in contrast, lumi- nance, size, etc It seems possible, particularly with the configuration of stimuli in the Boynton and Boss ex- periment, that there may be systematic changes in the number of stimuli scanned, depending upon the quality of the stimulus conditions. Because the num- ber of targets scanned may be confounded with the difficulty of the visual conditions (even in the Landolt ring search studies), precautions must be taken to determine the number of targets actually searched as well as the time to perform the task. Otherwise visual performance cannot be evaluated.
Contrast threshold task
Several investigators23~25 have used contrast thresh- old tasks to identify the lower limits of visual perfor- mance. Usually, luminous increments are presented to subjects on various luminous backgrounds. The pro- babilities of detecting luminous increments (con- trasts) of different magnitude on a given luminous background are obtained only after many trials. A sigmoid function generally describes the relation be- JOURNAL of the Illuminating Engineering Society Winter 1987
Figure 1-Three-dimensional representation of visual performance model for
alphanumeric reading material.4 Relative visual performance, scaled linearly, is plotted as a function of task contrast and background luminance, both scaled logarithmically
8 0
1 0. 05 0. 1 C O N T R A S T
Figure 2-Comparison of score values for the numerical verification task and predic- tions of visual performance modeL4 The four curves through the score data were
obtained from equation (Al). Model predictions (solid lines) are normalized using
one factor equal to 60.66
0. 05 0 . 1
C O N T R A S T
Figure 3-Comparison of score values at the numerical verification ta~k.~"he shaded area is bounded by the 12 and 169 cd ma score curves from Figure 2. The solid curve through the score values defined by ~ eis obtained from equation a ~ (Al)
Figure 4-Comparison of visual search performance in two experiments conducted by weston." Both sets of curves represent performance scores for subjects searching for Landolt rings with a specific (3-min) gap orientation. The two sets of data were scaled differently in an attempt to match the trends in performance score at high and medium contrasts. Dashed lines are the performance curves at three task con- trasts (top to bottom, 0.92, 0.68 and 0.36) smoothed by Weston for his first experi- ment; score values may be obtained from the right ordinate. Solid lines are the per- formance curves smoothed by Weston at four task contrasts (top to bottom, 0.97, 0.56, 0.39 and 0.28) for his second experiment; score values may be obtained from the left ordinate. (Reprinted with permission HMSO, London)
Figure 5-Visual search data, from Boynton and Boss." d
-
- H I G H B A C K G R O U N D L U M I N A N C E L O W B A C K G R O U N D - L U M I N A N C E-
A B C 0 L O G C O N T R A S TFigure 6-Probability of detection curves for luminous increments on high and low background luminances. The probability of detection equal to 0.5 is taken as the con- stant criterion giving visual threshold for any background luminance. Abscissa values for points A and B are contrast thresholds at the two background luminances, defin- ed as equally visible in the CIE m ~ d e l . ~ ' Abscissa values for points C and D are con- trast values four times those at A and B, respectively, and at their respective back- ground luminances are defined as equally visible in the CIE model. Contrast is defined as the difference between the luminance of the target and that of the background divided by the luminance of the background
i l I 1 l ~ I ~ )
-
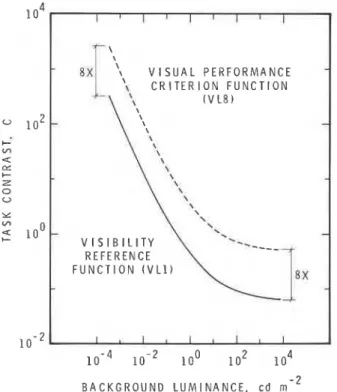
I V I S I B I L I T Y R E F E R E N C E F U N C T I O N ( V L 1 ) I # I , I I l L IFigure 7-Visibility Reference Function (VL1) and Visual Performance Criterion Function (VL8) for the CIE visual performance model (see Figure 3-24, I E S ~ ~ ) . VL1 represents the threshold contrast for a circular, 4-min diameter, luminous increment on various background luminances. Contrast in this figure is defined as the dif- ference between the luminance of the target and that of the background divided by the luminance of the background. VL8 is an assumed equal-visibility curve for con- trasts eight times those for VL1
Figure 8-Lines of constant criterion, visual performance (see Figure 11, Rea4). Curves are labelled in units of relative visual performance (RVP)
Figure 9-Comparison of performance at a numerical recitation task (from
McNelisl), solid lines, and predictions from the visual performance model (from Rea4), dashed lines. Model predic- tions not normalized.
tween the logarithm of the luminous increment on a fixed background and the probability of detecting the increment, ranging from 0 to 1 (Figure 6).
From the probability of detection curves a visual threshold can be determined. This is defined as a con- stant, psychophysical criterion producing a fixed level of sensation, usually taken as the break-point between perceptible and imperceptible. For- a detection task at one background luminance, contrast threshold is represented by a fixed probability of detection, p; usually p = 0.5. Once the criterion has been establish- ed it is possible to derive a contrast threshold func- tion that defines contrast threshold at various back- ground luminances. That is, the contrast required to reach threshold, obtained from each probability of detection curve, is plotted against the background luminance for which the probability of detection data were obtained (e.g., VL1 in Figure 7).
Visibility level
A model based largely upon detection threshold studies by Blackwell and his c o - ~ o r k e r s ~ ~ ' ~ ~ has been developed to characterize suprathreshold as well as threshold visual p e r f o r m a n ~ e ? ~ . ~ ~ In this CIE model suprathreshold levels of visual performance are repre- sented by so-called Visibility Levels (VL) derived from the contrast threshold values. The contrast threshold curve for detecting a small disc, called the Visibility Reference Function, VL1, has been taken to represent the basic relation between background luminance and threshold c ~ n t r a s t . ~ ' Higher criterion levels rep- resenting constant suprathreshold levels of visual per- formance are obtained by simply multiplying the Visibility Reference Function by a fixed factor (see caption, Figure 6). VL8 in Figure 7, for example, is the equal visibility curve relating background luminance to contrasts eight times those at VL1.
Probabilities of detection equal to unity In the CIE mode1,3°r31 two parameters, M and s, of a cumulative normal distribution describe the sigmoids (or so- called normal ogives) fitting the probability of detec- tion data at each background luminance (e.g.,Figure 6). M is the mean of the normal distribution of con- trast values (corresponding to the 0.5 probability of detection) and s is its standard deviation. The latter parameter characterizes the steepness of the sigrnoid. Blackwell reports (see Technical Note 1631) that the ratio sIM is a constant equal to 037 for all background luminances.
The probability of detection curves for all back- grodnd luminances eventually become equal to unity
numerical verification task are systematically differ- ent for the same high-contrast targets at various back- ground luminances? These results are consistent with the wealth of literature on the Pulfrich pendu- lum phenomenon (e.g., Lit34).*** It is therefore im- possible to use this methodology directly to discrimi- nate between levels of suprathreshold visual perfor- mance.
By the same token, the probability of detection methodology cannot be used to validate a central assumption in the CIE model, namely, that contrasts on the same VL function (e.g., VL8 in Figure 7) will produce the same level of suprathreshold visual per- formance. When all of the probabilities of detection associated with high contrast targets are equal to unity, it is not only impossible to use those data to discriminate among levels of suprathreshold visual performance (discussed in the previous paragraph) but also impossible to validate the assumption that all the points on a single Visibility Level function give the same level of visual performance. Another techni- que, perhaps using reaction time, would have to be employed to test the assumption directly.
It seems unlikely, however, that this assumption is valid? It has been shown that constant criterion curves from the visual performance model for lumi- nous decrements are not simple multiples of the lowest (threshold) criterion function. Graphically, the constant criterion curves are not parallel in a space defined by log contrast (ordinate) versus log back- ground luminance (abscissa) axes; the separation in contrast between constant criterion curves is greater at low luminances than at high (Figure 8). This in- creased separation at low luminances happens because the level of maximum visual performance associated with maximum contrast at a given back- ground luminance increases systematically as back- ground luminance increases. Since it was impossible to attain as high a level of visual performance at low background luminances as at high, even for maximum contrast (unity for luminous decrements), it is im- possible for the constant criterion curves (i.e., Visibili- ty Levels) to be parallel throughout the log contrast versus log background luminance space, as supposed in the CIE model and illustrated for luminous in- crements in Figure 7.
Effects of guesswork or response bias on jwobability of detec- tion In these experiments the probability of chance detection (guessing) is determined in an attempt to isolate the visual threshold from the non-sensory
-
at high contrast. It is quite unlikely, however, that the ***A high contrast pendulum swingingin o m P h m knaPPear to d n g
high contrast targets will, in fact, produce the same in an eUiPtica1
ph
when binoclchrb the lwo '?Yes am notodapfed to the same light h L The katmcy of the sigurlfrom the eye
level of visual performance at different background to the low,, light lcLlel is lower in maching bimlar CeUs in the luminances. Reaction times to equally high contrast than is the -from the eye adapted to the higher he^ fiis d v
stimuli are different at different background lumi- in latency, w e n d e n t upon the di-ee in the adaptation
35 n a n c e ~ . ~ ~ Similarly, the levels of performance at the luminances pre~umably poduces the iausion. Winter 1987 JOURNAL of the Illuminating Engineering Society
contributions to the subjects' responses. One of two options is generally employed to characterize the visu- al threshold. With the first option a criterion equal to chance detection is chosen as the probability of detec- tion to represent visual threshold. If, for example, one is forced to decide whether a target is presented to the left or to the right of a fixation point, the subject has a 50 percent chance of guessing the correct location. Probabilities greater than chance (in this case p = 0.5) are taken as visual events. Thus, a 0.5 probability of detection criterion is taken as visual threshold, the break-point between perceptible and imperceptible. Response bias presents a difficulty with this approach. For example, if subjects are biased to say "right" all the time, the best score would be p = 0.5, no matter how high the contrast. This, of course, would never hap- pen, but if subjects have some degree of response bias and it is unknown, all of the probability of detection data would reflect both visual response and psycholo- gical bias.
With the second option, the raw probability of detection (p) data are mathematically transformed, ac- cording to the following formula, into a new set of probability of detection (pl) data in an attempt to cor- rect for gues~work.~'
where q is the probability of guessing the correct answer r is the probability of guessing the wrong answer and r
+
q = 1.As with the first method, chance behavior is typical- ly taken as an estimate of q. For the example given, both r and q are equal to 0.5. Thus, for p = 0.5, p1 =
0.0. Values of p' greater than 0.0 can be taken as greater than threshold. As with the first method, response bias can play a part in the transformed probabilities of detection. Blackwell and Scott:' for example, have shown that the values of q and r cannot always be char- acterized simply by chance detection; their transform- ed probability of detection data are still combinations of seeing and non-randon guessing. Steps had to be taken to transform these data further in order to elim- inate response bias. Blackwell and Scott used an empir- ical, graphical correction procedure to adjust values of p'. It applies only to their data, but such efforts il- lustrate the difficulty of isolating visual response in probability of detection data.
In many experiments (not just detection tasks) re- sponse biases have been neither assessed accurately nor documented. In these cases the probability of de- tection data should be suspect. The choice of criterion probabilities to represent threshold may be arbitrary and unrepresentative of the visual response. Occasion- ally, special experimental techniques or methods of analysis (as in the Blackwell and Scott experiments) must be employed to eliminate response bias.
Conclusions The probability of detection methodology has been used to model suprathreshold visual perfor- mance, but there can be fundamental difficulties in the response measure that limit its utility. First, high contrast targets associated with probabilities of detec- tion equal to unity (or the same Visibility Level value) at different background luminances do not always produce the same level of visual performance. Second, special care must be taken to ensure that the pro- bability of detection curves are not contaminated by subject response biases.
A timed recitation task
McNelis' conducted an unusual study of visual per- formance when on each trial an observer was required to name two briefly-presented (0.4 s) small letters (8 min in size) separated by a 10-degree visual angle. The letters were presented at different contrasts (luminous decrements) and at different background luminances. Accuracy (correct identifications) was used as the dependent variable. Performance was better for the left letter than for the right letter. As confirmed by eye movement data, there was not enough time for sub- jects to identify the second (right) letter in 0.4 s except at high luminances and contrasts. McNelis' accuracy data for the left letter have been redrawn from data supplied by him and presented in Figure 9.
Methodological issues
The McNelis study was well documented, but it did not make entirely clear whether subjects' heads were restrained. He has confirmed in a personal communi- cation that head positions were indeed restrained by a chin rest. Postural changes in response to reductions in luminance were prevented, so that apparent size and luminance were not confounded in the study. McNelis also notes in a personal communication that contrast measurements were difficult to make and that there may be some uncertainty in the values; such uncertainty makes predictions of performance, par- ticularly for low contrast stimuli, more tenuous.
Professor S.W. Smith points out in discussion of the McNelis study that subjects did not operate at a chance level of accuracy; correct identifications ap- proached zero under difficult conditions. Subjects were apparently biased in their responses against errors of commission (i.e., false positives). Because the number of correct responses due to guesswork were apparently very small, the simple measure of accuracy as the dependent variable was probably (but not cer- tainly) representative of visual performance.
Comparison with predictions
Pom
the visual performance modelOther than the potential problem of estimating absolute contrast, the methodologies employed in the McNelis study appear to avoid most of the problems
outlined in this paper. For this reason it seems ap- propriate to compare predictions of the visual perfor- mance model developed by Rea in an earlier paper4 with McNelis' accuracy data. Both the model predic- tions and McNelis' accuracy data are shown in Figure 9. The model predictions at the three contrasts were all normalized by use of a single factor of 100.
Agreement between McNelis' data and the model predictions are excellent at the two higher contrasts. Even at the lowest contrast they are reasonably good. Difficulties in both model predictions and the McNelis data are evident, however, in Figure 9. First, the model predictions at the lowest contrast are prob- ably inaccurate to some degree; the slope of this low- est function does not continue to decrease with in- creases in background luminance, as one would ex- pect. More refined estimates of visual performance at the lowest contrast values are required. Second, the contrast values reported by McNelis are, as he indi- cated, probably inaccurate. Examining his data for the highest luminance, it is clear that the difference in performance is greater for contrasts of 0 5 and 0.25 than for 0.25 and 0.125. It would be more reasonable to expect the difference in performance to be larger for the latter two contrasts than for the former pair. Inaccuracy in evaluating the contrast of task materials is, of course, problematic in evaluating the visual per- formance model. Again, care must be taken to specify contrasts of task materials accurately, particularly at the lowest contrasts, because visual performance changes most rapidly just above contrast threshold.
Conclusions
The study by McNelisl appears to avoid most of the procedural problems outlined in this paper. One would expect, then, good agreement between predic- tions from the visual performance model and the reported accuracy data. Indeed, there was marked similarity between model predictions and the data, despite obvious procedural differences between the numerical verification task and those used by McNelis. It appears that the McNelis procedures could easily be used to extend and validate the visual perfor- mance model.
Discussion and conclusions
In the past it may have been less important to ob- tain precise estimates of stimulus conditions or visual performance as distinct from overall task perfor- mance. Traditional recommendations of illumination levels for various tasks were made without specifying factors important to vision, such as task reflectance and contrast?* Only very general information about task performance was necessary to make lighting recommendations of this kind and, perhaps rightly, investigators did not strive for experimental precision greater than that required by the various national and
Winter 1987 JOURNAL of the Illuminating Engineering Society
international sanctioning bodies. Perhaps, too, practi- tioners have been coricerned with lighting real tasks and many investigators deliberately studied overall performance at different kinds of simulated, realistic tasks. These experiments gave a general indication of how performance is affected by lighting, but for many of them it was not possible to isolate the contribution of each visual factor to performance nor to disen- tangle the visual factors from non-visual ones that con- tribute to performance. It was not possible, therefore, to determine how important lighting is to visual per- formance at a task.
There has been recent emphasis on more exacting specification of the conditions important for visual performance, as reflected in more refined recommen- dations of illuminance? Size, contrast and the age of the worker are important factors that must be specified when determining levels of illumination. If it is necessary to follow the more precise recommen- dations of lighting quantity and quality for visual per- formance, then it is necessary to have more explicit knowledge of the relationships between luminous parameters and visual performance.
The model proposed by Rea4 is an attempt to pro- vide quantitative predictions of visual performance at an alphanumeric reading task from the photometric specification of the luminous stimuli. Based upon a variety of arguments, the proposed model seems to be an adequate, first-order characterization of visual per- formance at that kind of task. It is not necessarily far- reaching in its predictive capabilities
(e.g.,,
different text sizes and age groups are not included), nor has it been completely verified. For reasons outlined in the present paper, problems with experimental pro- cedures, photometric measurements, and indices of performance limit the utility of many earlier studies for validating and extending the visual performance model. It is therefore necessary to design and control future experiments more carefully in order to assess and extend the model predictions. The recommenda- tions for future experiments on visual performance identified in this paper are summarized in Recom- mendations below.Although more experiments must be executed to validate and extend the visual performance model, the close correspondence of the model predictions with well controlled electrophysiologica136 and psy- chophysicall studies implies that it will be an impor- tant step in developing a general model of supra- threshold visual performance. When the necessary ex- periments have been completed and a final visual per- formance model is established, it will be possible to make more precise lighting recommendations, and, importantly, to justify them.
Recommendations
should be well designed, executed, and analyzed. Barber:' for example, identified important issues in conducting experiments and describing the results. Care should be taken to adhere to this credo in future experiments on visual performance. Common, recurr- ing problems specific to past studies of visual perfor- mance have been identified in this paper and deserve special mention.
Independent variables
Accurate measurements of apparent luminance, contrast, and size must be obtained, and must repre- sent the conditions actually experienced by the subjects.
Dependent variables
Indices of performance should not distort visual response. Simple measures of time and errors rather than arbitrary scoring indices should be used. The measures should be sensitive to changes in visual response across experimental conditions. Equal pro- babilities of detection at different background lumi- nances, for example, do not necessarily result in equi- valent levels of suprathreshold visual performance. The response measures should also limit the in- fluence of non-visual factors.
Experimental design
Proper experimental designs must be used to elimi- nate various sources of confounding. Subject sub-pop- ulations should not be confounded with experimental variables. Absolute differences in subjects' response levels can mask differences in performance due to ex- perimental variables. Systematic behavioral changes in response to experimental variables should be elimi- nated. For example, leaning forward as illuminance levels are reduced confounds the effects on vision of apparent size and background luminance. Similarly, in a search experiment the number of stimuli inspect- ed may be confounded with background luminance.
Acknowledgements
The author gratefully acknowledges the continuing assistance of M. Ouellette during the preparation of this manuscript. Thanks are also extended to the fol- lowing for their comments on an earlier manuscript: S. Berman, R. Biggs, P. Boyce, R. Clear, R. Corth, V. Crisp, D. DiLaura, A. Levy, I. Lewin, M. Perry, A. Robertson, P. Russell, A. Slater, S. Squillace, G. Webber. This paper is a contribution from the Institute for Research in Construction, National Research Council of Canada.
References
1. McNelis, J.F. 1973. Human performance-a pilot study, J of the IES 2(no. 3):190-196.
2. Rea, M.S. 1984. Overview of task performance in
the illuminated environment. Illuminating engineering
learning aid. Nat'l. Research Council of Canada, Divi- sion of Bldg. Research.
3. IES of N. America. 1981. ZES lighting Handbook Ref. Vol. New York.
4. Rea, M.S. Toward a model of visual performance: foundations and data. J of the IES 15(no. 2).
5. Smith, S.W. and Rea, M.S. 1980. Relationships bet- ween office task performance and ratings of feelings and task evaluations under different light sources and levels. Proceedings 19th Session. CIE Publication No. 50:207-211. Kyoto.
6. Rea, M.S. 1981. Visual performance with realistic methods of changing contrast. J of the ZES lO(no. 3):164-177.
7. Rea, M.S. 1983. Effects of Haidinger's brushes on visual performance. J of the IES 12(no. 3):197-203.
8. Slater, A.I., Perry, M.J., and Crisp, V.H.C. 1983. The applicability of the CIE visual performance model to lighting design. Light and lighting. Proceedings of the 20th session. CIE Publication No. 56. pp. D11411-4. Amsterdam.
9. Slater, A.I., and Perry, MJ. 1984. Visual perfor- mance under reference and realistic conditions. Pro-
ceedings of the CIBS Nat'l. Lighting Conference Cambridge, UK.
10. Poulton, E.C. 1969. Skimming lists of food ingre- dients printed in different brightness contrasts. J of
Applied Psychology 53(no. 6):498-500.
11. Rea, M.S., Ouellette, M.J., and Kennedy, M.E. 1986. Lighting and task parameters affecting posture, performance and subjective ratings. Nat'l. Research Council of Canada, Institute for Research in Con- struction.
12. Tinker, M.A. 1939. The effect of illumination in- tensities upon speed of perception and upon fatigue in reading. J of Ed Psych 30(no. 8):561-571.
13. Tinker, M.A. 1943. Illumination intensities for reading newspaper type. J of Ed Psych 34:247-250.
14. Tinker, M.A. 1952. The effect of intensity of il- lumination upon speed of reading six-point italic print. Amer J of Psych 65(no. 4):600-602.
15. Tinker, M.A. 1959. Brightness contrast, illumina- tion intensity and visual efficiency. Amer J of Optometry
and Archives of American Academy of Optometry 36(no. 5):221-236.
16. Rea, M.S. 1982. An overview of visual perfor- mance. Lighting Design
+
Application 12(No. 11)13.17. Stone,
FT.
and Groves, S.D. 1968. Discomfort glare and visual performance. Transaction of the ZES(London) 33(no. 1):9-15.
18. Boynton, R.M., and Boss, D.E. 1971. The effect of background luminance and contrast upon visual search performance. Illuminating Engzneering April 1971, pp. 173-186.
19. Waters, I. and Loe, D.L. 1973. Visual performance in illumination of differing spectral quality. Visual JOURNAL of the Illuminating Engineering Society Winter 1987
Performance Research Proj. Univ. College Environ. Research Group.
20. Boyce, P.R. 1973. Age, illuminance, visual perfor- mance and preference. Lighting Research and Technology 5(no. 3):125-144.
21. Weston, H.C. 1935. The relation between illumi- nation and industrial efficiency, 1. The effect of size of work. HMSO. pp. 1-14. London.
22. Weston, H.C. 1945. The relation between illumi- nation and visual efficiency-The effect of brightness contrast. Industrial Health Research Bd. Great Britain Medical Research Council, Report No. 87:l-35 London.
23. Hecht, S., Peskin, J.C., and Patt, M. 1938. Intensity discrimination in the human eye. 11. Relationship be- tween A11 and intensity for different parts of the spec- trum. J of Gen Physiol 22:7-19.
24. Graham, C.H., and Kemp, E.H. 1938. Brightness discrimination as a function of the duration of the in- crement in intensity. J of Gen Physiol 21:635-650.
25. Blackwell, H.R. 1946. Contrast thresholds of the human eye. JOSA 36(no. 11):624-643.
26. Blackwell, H.R. 1953. Psychophysical thresholds: Experimental studies of methods of measurement. Engineering Research Inst. Univ. of Mich.
27. Blackwell, H.R. 1959. Development and use of a quantitative method for specification of interior il- luminating levels on the basis of performance data.
Illuminating Engineering 54:317-353.
28. Blackwell, O.M. and Blackwell, H.R. 1971. Visual performance data for 156 normal observers of varying age. J of the ZES 1:3-13.
29. Blackwell, H.R., and Scott, D.E. 1973. Analysis of visual performance data obtained in a Landolt ring task without response limitation. J of the ZES 2(no. 4):445-460.
30. CIE, Technical Committee. 1972. A unified framework of methods for evaluating visual perfor- mance aspects of lighting. CIE Publication No. 19.
31. CIE Technical Committee. 1981. An analytical model for describing the influence of lighting para- meters upon visual performance. Vol. 1: Technical Foundations. CIE Publication No. 1912.1.
32. IES of N. America. 1972. IES Lighting Handbook New York.
33. Vicars, W.M., and Lit, A. 1975. Reaction time to incremental and decremental target luminance changes at various photopic background levels. Vision
Research 15:261-265.
34. Lit, A. 1949. The magnitude of the Pulfrich stereophenomenon as a function of binocular dif- ferences of intensity at various levels of illumination.
A w J of Psych 62(no. 2):159-181.
35. Levick, W.R., Cleland, B.G., and Coombs, J.S. 1972. O n the apparent orbit of the Pulfrich phenome- non. Vision Research 12(no. 8):1381-1388.
36. Albrecht, D.G., and Hamilton, D.B. 1982. Striate cortex of monkey and cat:contrast response function.
J of Neurophysiol 48(no. 1):217-237.
37. Barber, T.X. 1976. Pitfalls in human research New York: Pergamon Press Inc.
Appendix A
All the score data in Figures 2 and 3 were fitted with the same general form of equation (1) developed by Rea.4 This equation is repeated in equation (Al) below in a slightly different form. Parameter estimates for each set of data were obtained by a least squares criterion using a non-linear regression computer routine.
where
R = score in equation (1)
R,,, = a free parameter equal to the
maximum score for a given background luminance, L,
n = a free parameter affecting the shape of the curve
ko = a free parameter, also affecting the shape of the curve, representing the in- crement in contrast above threshold contrast (C,) producing half maximum response.
C, = task contrast = (L, - b / L B ) 643) where
L, = task background (e.g., paper) luminance
L,
= task target (e.g., printed digit) luminance LB2
L,
C, = C, at contrast threshold
T h i s paper
i sbeing d i s t r i b u t e d i n r e p r i n t
form by
t h e I n s t i t u t e f o r Research i n
C o n s t r u c t i o n ,
Al i s t
of b u i l d i n g p r a c t i c e
and r e s e a r c h p u b l i c a t i o n s a v a i l a b l e from
t h e I n s t i t u t e
may be o b t a i n e d by w r i t i n g t o
t h e P u b l i c a t i o n s S e c t i o n ,
I n s t i t u t e f o r
Research i n C o n s t r u c t i o n , N a t i o n a l Research
C o u n c i l of
C a n a d a ,
O t t a w a ,
O n t a r i o ,
K1A 0R6.
C e