HAL Id: tel-00979727
https://tel.archives-ouvertes.fr/tel-00979727
Submitted on 16 Apr 2014
HAL is a multi-disciplinary open access
archive for the deposit and dissemination of
sci-entific research documents, whether they are
pub-lished or not. The documents may come from
teaching and research institutions in France or
abroad, or from public or private research centers.
L’archive ouverte pluridisciplinaire HAL, est
destinée au dépôt et à la diffusion de documents
scientifiques de niveau recherche, publiés ou non,
émanant des établissements d’enseignement et de
recherche français ou étrangers, des laboratoires
publics ou privés.
and infection in the early premature infant
Xavier Navarro
To cite this version:
Xavier Navarro. Analysis of cerebral and respiratory activity in neonatal intensive care units for the
assessment of maturation and infection in the early premature infant. Signal and Image processing.
Université Rennes 1, 2013. English. �NNT : 2013REN1S133�. �tel-00979727�
ANNÉE 2013
THÈSE / UNIVERSITÉ DE RENNES 1
sous le sceau de l’Université Européenne de Bretagne
pour le grade de
DOCTEUR DE L’UNIVERSITÉ DE RENNES 1
Mention : Traitement du signal et télécommunications
Ecole doctorale MATISSE
présentée par
Xavier Navarro
préparée à l’unité de recherche LTSI - INSERM U1099
Laboratoire Traitement du Signal et de l’Image
Université de Rennes 1
Analysis of cerebral
and respiratory activity
in neonatal intensive
care units for the
assessment of
maturation and
infection in the early
premature infant
Thèse soutenue à Rennes le 22 octobre 2013
devant le jury composé de :
Anne HUMEAU-HEURTIER
PU, Université d’Angers / Rapporteur
Leif SÖRNMO
Pr, Université de Lund / Rapporteur
Pablo LAGUNA
Pr, Université de Saragosse / Examinateur
Patrick PLADYS
PU-PH, Université de Rennes 1 / Examinateur
Fabienne PORÉE
MCU, Université de Rennes 1 / Encadrant
Guy CARRAULT
Acknowledgments
This Ph.D. thesis has represented four years of work at Laboratoire Traitement du Signal et de l’Image (LTSI) of Rennes after the six months of master’s thesis I started in March 2009. Since my first day in the LTSI, I felt at home thanks to the warm welcome of its director, Prof. Lotfi Senhadji.
First and foremost, I wish to express my sincere gratitude to my mentors, Prof. Guy Carrault and Dr. Fabienne Porée for giving me the privilege to do my Ph.D. thesis in the LTSI. Thanks to their constant support, advice, encouragement and to their efforts to provide all the means during my stay in Rennes, this work came into fruition.
I also would like to thank Prof. Anne Humeau-Heurtier, from Université d’Angers, Prof. Leif Sörnmo, from Lund’s University for accepting reviewing this work and for their proficient comments improving the quality of this work. I also would like to thank Prof. Pablo Laguna from Universidad de Zaragoza, for kindly taking part in the thesis’ evaluation committee and for their constructive comments during the defense.
I am very thankful to M.D. Alain Beuchée, from the CHU of Rennes, for his priceless assistence in the clinical aspects of this thesis but also to his remarkable competences in signal processing that made to work with him very motivating. Prof. Patrick Pladys and M.D. Tiphaine Mialet-Marty contributed actively as well to this thesis, providing helpful advice and valuable knowledge in neonatology. I am also grateful to M.D Camille Arberet, M.D Mathieu Kuchenbuch and Anne-Marie Lamour for their participation in the clinical part.
The help and advice provided by several researchers in the LTSI deserve an special mention. These are Dr. Amar Kachenoura, Dr. Nathalie Costet, Dr. Alfredo Hernández, Dr. Jean-Jacques Bellanger, Dr. Miguel Altuve and David Ojeda.
Likewise, I would like to acknowledge the scientists from other establishments from whom I exchanged relevant discussions and generously shared their codes: Dr. Pierre Borgnat, from ENS Lyon, Prof. Eugene N. Bruce, from the University of Kentucky and Cheolwoo Park, from the University of Georgia.
Finally, but not less importantly, I greatly appreciated the support and encouragement from the LTSI staff and colleagues that led to many unforgettable friendships.
Contents
Résumé xix Introduction 1I Clinical context
5
I Prematurity 7 1 Definitions . . . 72 Particularities of preterm infants . . . 8
2.1 Cerebral activity . . . 8
2.2 Cardiorespiratory system . . . 11
3 Risks due to prematurity . . . 11
3.1 General risks . . . 11
3.2 Apnea of prematurity . . . 12
3.3 Neonatal sepsis . . . 13
4 Neonatal intensive care units . . . 14
4.1 Monitoring equipment . . . 14
4.2 Cares and comfort at NICU . . . 15
4.3 Follow-up of maturation and discharge . . . 15
5 Description of NICU signals . . . 16
5.1 Preterm’s electroencephalogram . . . 16
5.2 Respiration . . . 20
5.3 Electrocardiogram . . . 22
6 Conclusion . . . 23
II Problem statement and aims of the study 31 1 State of the art . . . 31
1.1 Apnea-bradycardia detection . . . 31
1.2 Early detection of infection and effects of immunization . . . 32
1.3 Preterm’s brain activity and sleep . . . 32
2 Databases . . . 33
3.2 Study of the immature breathing . . . 37
4 Thesis outline . . . 38
II Analysis of cerebral activity
45
III Denoising EEG by signal decomposition and artifact cancellation 47 1 Noise in preterm EEG . . . 471.1 Environmental noise . . . 48
1.2 Patient-instrumentation interface noise . . . 48
1.3 Noncerebral electrophysiological interferences . . . 48
1.4 Artifact removal strategies . . . 49
2 Basic preprocessing . . . 51
2.1 Rejection of movement artifacts . . . 51
2.2 Baseline and high frequency noise rejection . . . 51
3 Combination of EEG decomposition and artifact cancellation . . . 53
3.1 State of the art . . . 53
3.2 Description of the proposed method . . . 54
4 Methods used in CEDAC . . . 55
4.1 EEG decomposition . . . 55
4.2 ECG cancellation . . . 62
5 Validation strategy . . . 64
5.1 Generation of artificially contaminated data from real signals . . . 64
5.2 Organization of tests . . . 65
5.3 Preliminary tests and parameter tuning . . . 66
6 Results . . . 69
6.1 Tests on artificial signals . . . 70
6.2 Results in real data . . . 72
7 Conclusion . . . 73
IV Automatic detection of EEG bursts 81 1 State of the art . . . 81
2 Automatic detection of bursts . . . 82
2.1 Introduction to binary classifiers . . . 82
2.2 Thresholding-based classifiers . . . 83
2.3 Logistic regression-based classifiers . . . 85
3 Evaluation methodology . . . 87
3.1 Study design . . . 88
3.2 Measures of agreement . . . 89
3.4 Measures of performance . . . 91
4 Results . . . 92
4.1 Raters agreement . . . 92
4.2 Selection and optimization of detection parameters . . . 93
4.3 Performance of automatic detections . . . 95
4.4 Comparison of visual and automatic detections . . . 96
5 Clinical application . . . 98
5.1 Post-immunization study . . . 99
5.2 Study of maturation . . . 103
6 Conclusion . . . 106
III Analysis of respiratory activity
113
V Extraction of respiratory variability signals 115 1 Preprocessing of breathing . . . 1151.1 Artifact rejection . . . 115
1.2 Band-pass and smoothing filters . . . 118
2 Respiratory cycle detection . . . 120
2.1 Detection algorithm . . . 120
2.2 Validation of automatic marks . . . 121
2.3 Performance of detection . . . 121
3 Clinical application . . . 122
3.1 Study of maturation by linear analysis . . . 122
3.2 Study of infection . . . 125
4 Conclusion . . . 126
VI Nonlinear analysis 131 1 Nonlinearity in biomedical signals . . . 131
2 Measuring complexity . . . 132
2.1 Mutual information . . . 132
2.2 Sample entropy . . . 133
2.3 Lempel-Ziv complexity . . . 134
3 Measures based on chaos estimations . . . 135
3.1 State space reconstruction . . . 135
3.2 Correlation dimension . . . 136
3.3 Numerical noise titration . . . 136
4 Nonlinear indexes . . . 138
5 Clinical application . . . 138
5.1 Nonlinear analysis of temporal signals . . . 138
5.2 Nonlinear analysis of variability signals . . . 144
5.3 Nonlinear analysis of EEG bursts . . . 146
1.1 Definition of the Hurst exponent . . . 153
1.2 H estimation techniques . . . . 154
2 Performance analysis of H estimators . . . 156
2.1 State of the art . . . 156
2.2 Data selection . . . 156
2.3 Evaluation methodology . . . 157
2.4 Long and short-range dependence in real RV signals . . . 159
2.5 Robustness of estimators . . . 161
3 Clinical application . . . 163
3.1 Data selection and parameter tuning . . . 163
3.2 Results and discussion . . . 164
4 Conclusion . . . 165
Conclusions and perspectives 169 List of publications 173 A Blind Source Separation 175 1 Description . . . 175
2 Denoising EEG by BSS . . . 176
B Tables from Part II 181 C The method of surrogate-data 183 1 Temporal domain surrogates . . . 183
2 Frequency domain surrogates . . . 184
List of Figures
I.1 Birth chronogram according to the American Academy of Pediatrics [1]. . . 7
I.2 Definition of ages in prematurity according to the American Academy of Pediatrics [1]. . . 8
I.3 Example of hypnogram from a 35 weeks CA newborn, where the baby felt asleep in a short active sleep
period. The first sleep cycle was measured from the end of the post-waking AS to the end of the next
AS period (following a QS sleep period) [29]. . . 10
I.4 Evolution of the percentage of sleep states from 27 to 41 weeks of conceptional age in neurologically
normal infants [29]. IS decreases progressively in favour of more differentiated sleep states (QS and AS). 10
I.5 Illustration of some of the common elements in the neonatal intensive care unit. . . 14
I.6 Example of tracé continu from a 40 weeks PMA infant in active sleep, with continuous mixed delta plus
theta activity [85]. . . 17
I.7 Example of tracé discontinu from a 27 weeks PMA infant in quiet sleep, with slow delta and theta bursts
and very low (< 20 µV ) background activity [85]. . . 17
I.8 Example of tracé alternant in a 38 weeks PMA infant, with delta bursts of higher amplitude alternating
with lower voltage theta and delta background activity [85]. . . 18
I.9 Discontinuous EEG from a 31 weeks PMA infant in quiet sleep, having delta brushes of rapid activity
distributed asymmetrically (rectangles)[85]. . . 18
I.10 Semidiscontinous EEG tracing in a 36 weeks PMA infant in quiet sleep. A pair of encoches frontales are
identified with arrows and asymmetric bursts are contained into rectangles [85]. . . 19
I.11 Evolution of the characteristics of preterm EEG with post-menstrual age. Legend: RR Rapid rhythms;
TO: Temporo-occipital; QS, AS : Quiet and active sleep; SAD: slow anterior dysrhythmia. . . 20
I.12 EEG from a 39 weeks PMA infant who suffered hypoxic ischemic encephalopathy. Arrows indicate
epileptiform abnormalities (positive slow rolandic waves), alone (simple) and in bursts (double) [98]. . . 20
I.13 Examples of the three typical neonatal respiratory patterns. a) Periodic breathing, b) Erratic breathing
and c) Regular breathing. . . 21
I.14 a) Example of a pre-processed respiratory signal corresponding to a patient born after 32 weeks of
gestation. b) One-minute excerpt showing apnea and irregular breaths, with detected minima (o) and maxima (*). c) Definition of inspiration, expiration and total times within a cycle. d) Resulting RV
signal with the horizontal line marking the apnea threshold (3 ∗ ttot). e) Empirical distribution of the
RV signal. . . 22
I.15 Examples of ECGs from a 20 years old healthy adult (a) and from a 32 weeks PMA healthy preterm
infant (b) [102]. . . 22
II.1 Image of the recording conditions at NICU for the PHYSIDEV database with arrows describing the
electrodes. The infant is placed in a cocoon, trying to minimize external perturbations. . . 34
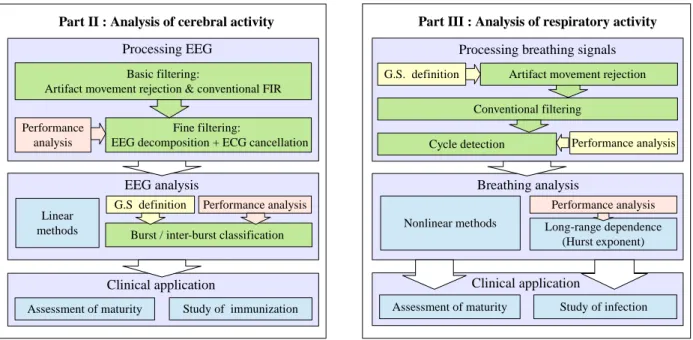
Green: processes that can be automated; yellow: manual procedures involving expert’s intervention;
orange: simulations and performance analyses; blue: exploration of diverse methodologies. . . 39
III.1 Example of power line noise in a patient of 37 weeks PMA. The trace appears thicker due to the
superimposition of the 50 Hz signal. . . 48
III.2 Examples of noise in the patient-instrumentation interface. a) EEG from a 37 weeks PMA infants having electrode pop-up (red circles) and ECG artifacts (arrows). b) EEG contaminated with breathing artifacts
(low-frequency waves) and also a weak ECG noise component in a 38 weeks PMA infant. . . 49
III.3 Examples of non-cephalic noise in the patient-instrumentation interface. a) ECG noise (periodic sharp
spikes). b) EMG noise (high frequency waves in circles). . . 49
III.4 Example of a raw EEG epoch and its power spectrum. Low frequency and 50 Hz power line noise can be noticed in the spectrum, but ECG artifacts (between 4 and 40 Hz approximately) are masked by the θ,
α and β bands. . . . 50
III.5 Basic block diagram of the different filtering steps applied to the EEG from the NICU. The noisy EEG in our database is composed by four channels, simultaneously recorded with an ECG channel and used as a reference if cardiac artifacts need to be canceled. The functions of the numbered blocks are described in TableIII.1. . . 50
III.6 Example of artifact rejection in the raw EEG. Red steps constitute selected periods for rejection. . . 52
III.7 Filter specifications diagrams for a high-pass filter (left) and a low-pass filter (right). As, fs and rs
are the attenuation, the limit frequency and ripple of the stopband, Ap, fpand rpare the counterpart
parameters for the passband. . . 52
III.8 Block diagram to compare different options in the CEDAC framework. . . 55
III.9 Ten-second excerpt of noisy EEG (upper plot) decomposed with EMD. The sum of IMF1 to IMF4
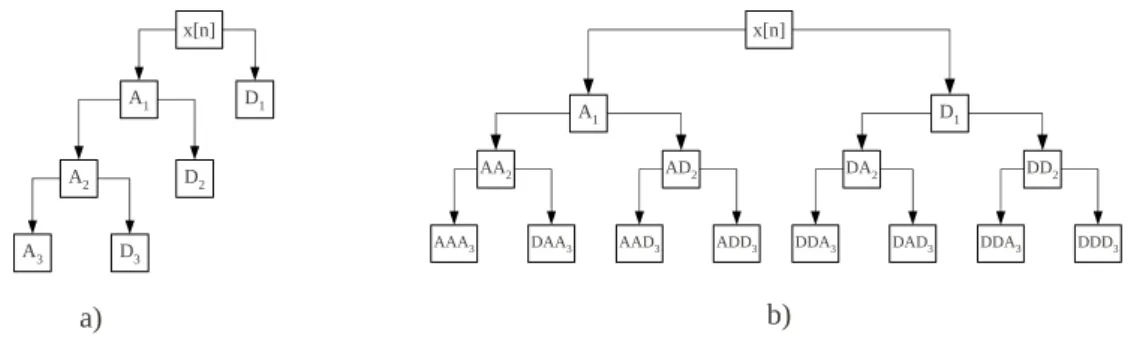
(fM > fECG) constitutes EEGH. . . 56 III.10 Obtaining the approximation and detailed components by a) standard wavelet transform and b) wavelet
packet transform. . . 57
III.11 Illustration of mode mixing. A contaminated sinus with increasing white noise has been decomposed by
EMD. As it can be observed, IMFs 3 to 5 contain mixed frequency tones [21]. . . 59
III.12 The same signal shown in FigureIII.11decomposed by EEMD with 100 realizations of noise. Unlike
FigureIII.11, the IMFs here contain pure tones without mode mixing [21]. . . 60
III.13 Comparison of the decomposition of a delta signal by EEMD (left) and CEEMDAN (right) [21]. As it
can be observed, the superior performance of CEEDMAN results in a smaller number of IMFs. . . 61
III.14 Basic diagram of an adaptive filter. The reference signal, x(n), is supplied by an independent ECG
channel recorded in the NICU. The desired signal, d(n), is the noisy EEG. . . . 63
III.15 Example of the generation of artificially contaminated EEGs by the filtered ECG and LFN. Using the first signal (clean EEG), two examples of Group 1 (second and third signals) have been formed. The fourth signal (a Group 2 example) is formed by the addition of the third signal and LFN at 0 dB. The lower plot shows the originally recorded ECG and the reference x(n) used to test the AF, obtained by
applying the 21th-order FIR filter. . . 65
III.17 Average MSEs of denoising original EEG excerpts plus ECG noise at several SNRs as a function of the number of coefficients, L. They correspond to the set a), represented in solid lines. In dashed lines, the results of denoising set b), original EEGs high-pass filtered and then contaminated with ECG. The lower MSEs obtained in last set demonstrate that avoiding low frequency components in the EEG improves the performance of the AF. The different noise levels are: 0dB (black lines), 5dB (blue lines) and 15 dB
(red lines). The lowest filter orders are marked in circles. . . 67
III.18 Estimation of the instantaneous frequency (blue lines) and energy (green lines) in IMFs. In this example, the fourth IMF (upper signal) of a contaminated EEG from Group 2 has been selected. The detected maxima and minima (red and green asterisks) allowed to estimate the period and energy by half-cycles, represented in the lower plot. The red dashed line is the frequency from which the ECG artifacts are
present, fECG. As IMF4 has fM < fECG, the energies on frequencies exceeding fECG contribute to
critical mixing II. . . 68
III.19 Instantaneous frequencies of all IMFs. The two first IMFs clearly exhibit mode mixing, but since it
occurs beyond the limit of fECG, it has no consequences on the denoising process. The energies carried
by frequencies in the lower whiskers of IMF1, IMF2 and IMF3 crossing the red line constitute critical
mixing I. Likewise, the energies in the frequencies crossing fECGin IMF4 and IMF5 determine critical
mixing II. . . 69
III.20 Critical mixing as a function of several parameters of the EMD. a) Threshold of the sifting process
(setting θ2 = 10θ1 as suggested by [20]) and b) tolerance. The plots show the mean values over the 30
noisy EEG signals from Group 2. Red dashed vertical lines indicate the values minimizing critical mixing. 69
III.21 Critical mixing as a function of several parameters of the CEEMDAN. a) Number of realizations (I) and b) noise level (ε) to assist the decomposition process. The plots show the mean values over the 30 noisy
EEG signals from Group 2. Red dashed vertical lines indicate the values minimizing critical mixing. . . 70
III.22 RMSEs of cleaning noisy signals in Group 1 (ECG noise at several SNRs). a) Using the adaptive filter for canceling cardiac artifacts and b) using ensemble average subtraction. The dotted lines (labeled Raw) correspond to the RMSE between the noisy signals and the original uncorrupted EEG and the blue lines (labeled No decomp) to those of original and cleaned signals only by AF or EAS. As it can be observed,
the improvement of introducing EEG decomposition is particularly advantageous when SNRs are high. 71
III.23 RMSEs of denoised signals from second group (ECG contamination at SNR=5dB and variable LFN)
using the adaptive filter (a) and EAS (b). . . 72
III.24 a) Real contaminated EEG excerpt recorded at NICU and the results of denoising it using HPF+FA and CEEMDAN+AF. b) Detail of the power spectrum between 0.1 and 5 Hz, where it can be observed
that decomposition techniques remove low frequency noise more efficiently than a high-pass filter. . . . 74
IV.1 Diagram of the detection algorithm, identifying the three main blocks. In DP (data preprocessing) the noisy signal is properly cleaned the denoising framework developed in last chapter. In FE (feature extraction), the EEG is filtered again to emphasize the bursts, then characterized by an activity function to obtain the feature signal X. Finally, in CL (classification) the decision threshold T performs a first burst/inter-burst classification, later corrected as a function of the minimal duration of bursts in the gold standard, tB. . . 84
IV.2 Example of step-by-step burst detection using NLEO. EEG′
is the low-pass filtered EEG and XN LEO
the activity signal from which the threshold T determines a first binary classification (Yb′
). Finally,
detection is improved by removing short bursts (Y ). For comparison, the shadowed areas delimit theb
gold standard bursts. . . 85
IV.3 Diagram of the LR detection algorithm, identifying the three main blocks as in FigureIV.1. In this
first and second replications, respectively and the square signal on the bottom is the Yr signal for rater A, YA. . . 90
IV.6 Example of one-minute EEG signal with the raters labels (YA, YB, YC, see legend). Only the consensual
marks are taken into account to establish the gold standard (yellow and blue areas). Areas in white
represent disagreeing zones, not considered to construct the gold standard. . . 91
IV.7 Comparison of Y with automatic detection, Yaut. Zones in blue and red represent false negative and
false positive detections, respectively. Level ø in Y (disagreeing zones) is not considered to compute
performance measures. . . 92
IV.8 Mean agreements using all datasets with the gold standard for each detection algorithm. Dark red zones correspond to optimal detection values. The modified parameters were the sliding window length (W )
and the detection threshold (T ). . . . 94
IV.9 Average agreements with the gold standard (ARY) of the detections performed by the logistic regression
at several window lengths. . . 95
IV.10 ROC curves of the ten datasets. Each point on a ROC curve represents a sensitivity/specificity pair corresponding to a particular decision threshold. In left panel, the detection threshold T is modified for the Mm detector. In right panel the cutoff value c is modified for the LR detector. Curves having closer
points to the upper left corner have better detections. . . 96
IV.11 Performance measures of LOOCV for simple thresholding detections (Mm, ADIF, NLEO) and logistic regression (LV). Horizontal lines of different heights below boxes represent significantly different rates running a Mann-Whitney U test (black lines p < 0.01 and grey lines p < 0.05) among different classifiers.
Boxes having horizontal lines of the same height are not statistically different. . . 97
IV.12 % of spent time in each state obtained from infants having quiet sleep in A and B. Legend: QS, quiet sleep; NQS, non-quiet sleep; QW, quiet wakefulness; AW, active wakefulness. A Mann-Whitney U test
did not find statistically significant differences between A and B. . . 99
IV.13 Relative number of times for each state in one hour. A Mann-Whitney U test did not find statistically
significant differences between A and B rates. . . 100
IV.14 Transition probabilities between states before (A) and after (B) vaccination. . . 101
IV.15 Mean percentages of the different energy bands in EEG. The statistical analysis between percentages
before (blue boxes) and after immunization (red boxes) did not show significant differences. . . 101
IV.16 Comparison of energy percentages in the EEG bands. The test examines 25 patients having non-quiet sleep before (A) and after (B) vaccination. p-values from a Wilkoxon signed rank test are plotted in each
analyzed band. The decrease of δ1 and the augmentation of θ1 components in B are the most significant
results from this test. . . 102
IV.17 Characteristics of burst and inter-burst intervals in newborns from the VACCIN database (blue and red boxes describe data before and after vaccination, respectively). Horizontal lines of different heights below boxes represent significantly different rates in a Mann-Whitney U Test (black lines p < 0.005 and grey lines p < 0.05). . . . 103
IV.18 Number of transitions per hour and percentages of sleep/wake states in both maturation groups (green
boxes, G1; blue boxes, G2). In a) the groups concerned PMA and in b) the weight. . . 105
IV.19 Distribution of the energy bands within two maturation groups (green boxes, GP M A
1 ; blue boxes, GP M A2 ).
Boxes having lines of different height have statistically significant differences (grey lines, p<0.05; black lines, p<0.01). . . 105
IV.20 Description of EEG discontinuity parameters before vaccination, comparing GP M A
1 (green boxes) and
GP M A
2 (blue boxes). Differences are statistically significant if horizontal lines have different heights
(p<0.05). . . 106
V.1 Block diagram proposed to denoise the raw breathing signals and obtain variability series. . . 115
V.2 Unprocessed respiratory signals with artifacts (shadow zones) marked by a clinician. a) Example of a
regular pattern turning into periodic after the artifacts. b) Example of a heavily contaminated signal exhibiting erratic pattern. In view of the similarities between artifacts in regular patterns and erratic
patterns, one of the challenges of our detector will be to discriminate correctly the artifacts. . . 116
V.3 Screen capture of the artifact marking interface. . . 117
V.4 a) ROC curves from LOOCV. b) Boxplots of some measures of performance: sensitivity (Sn) and
specificity (Sp) based on the default cut-off value (c = 0.5), agreement rate (AR) and area under curve
(AUC). c) Mean of the sensitivity/specificity pair at several cut-off values. . . . 119
V.5 a) Example of artifact detection (traces in red) in a patient not used in the training set. As the baseline
evidences, no filtering is still performed at this step. b) Detail of detected artifacts. c) Detail of the
signal, after being processed by the two filters. Note that the small ripple disappears after the SG filter.119
V.6 Illustration of ti, teand ttottimes in a respiratory trace. Red and green lines constitute detected minima
and maxima, respectively. . . 120
V.7 Screen capture of the cycle marking interface. . . 122
V.8 Performance plot of the cycle detector, applying the κ coefficient to two features: standard deviation
(dotted lines) and IQR (solid lines). The optimal operating point, for each feature, is the intersection of the sensibility and positive predictability curves. The horizontal red dashed line indicates this point for
IQR (κ=0.463). . . . 123
V.9 (a) RV signal having periodic breathing and its power density. Periodicities can be found in the spectrum
between 0.05 and 0.1 Hz. (b) RV signal predominantly regular, characterized by a more flat spectrum. . 124
V.10 Respiratory variables for the four maturation groups according to PMA. Horizontal lines of different
heights indicate significant differences in a Mann-Whitney U test. . . 125
VI.1 Example of SpEn computation with a size pattern of m = 2. First a template is constructed (yellow and red points) introducing a delay τ. Then, this pattern is identified in the time-series (orange windows), and finally, the pattern is extended to m + 1. If the points are within the tolerance r (green points), the
matching patterns are counted (green boxes). . . 134
VI.2 Illustration of the noise titration technique. . . 137
VI.3 Example of one-minute breathing signal (a). Return maps plotted from the original and time-delayed
data sets: 6 points (b) and 12 points (c). Estimated D2 with embeddings from 3 to 15 (d). SpEn of
breathing signal (e) calculated with τ from 1 to 20 points (1-cycle length). The respective nonlinear
indexes are obtained by the averaged difference of original and surrogate curves. . . 139
VI.4 Selection the 90-second most regular excerpt in an breathing signal. . . 140
VI.5 Example of computing nonlinear measures in a respiratory signal. a) Regular 90-second excerpt. b) Autocorrelation function, where the first minimum is used as lag to compute the other measures (l = 11).
c) Sample entropy and its nonlinear index across the delays 1 to l. SpEn and NISpEn were obtained by
averaging the l values. d) Correlation integrals obtained by using l = 11 and embedding dimensions m
from 4 to 9. e) Values of D2 and its nonlinear index (NID2) across embeddings, averaged to obtain the
final values. f) Average mutual information computed from delays 1 to l, subsequently normalized by its
Complementary data about these measures is available in AppendixD(means ± std). . . 143
VI.7 Nonlinear indexes obtained by computing the difference of SpEn in original signals and a set of 20 surrogates. Values over zero denote a positive detection of nonlinearity, also confirmed by noise titration. In a) groups assorted by PMA, in b) by PNA and c) by weight. Complementary data about these
measures is available in AppendixD(means ± std). . . 143
VI.8 Results from the nonlinear analysis of RV data. a) Five-minute excerpts b) Ten-minute excerpts. . . 146
VI.9 Example of applying Lempel-Ziv complexity to burst/inter-burst coded sequences. a) Blue and red boxes
are, respectively, sequences before and after vaccination. b) Green boxes correspond to GP M A
1 and blue
boxes to GP M A
2 . . . 147
VII.1 Examples of fLn realizations with several coefficients of variation (cv = σG/µG) at H = 0.6, 0.7 and 0.8.
a) cv = 0.3 b) cv = 0.7 c) cv = 1. . . . 159
VII.2 Average Mutual Information (AMI) computed for the ten first lags in original RV series (upper panels) and small-shuffled surrogates (lower panels). There were significantly significant differences in the first three breaths for regular breathing (a), in the first two breaths for erratic (b) and in the first breath for erratic patterns (c) after performing a Mann-Whitney U-test (∗ ∗ ∗, p < 0.001; ∗∗, p < 0.005; ∗, p < 0.05). 160
VII.3 Illustration of the discrepancy within the estimations of the Hurst exponent (Hcr). Regular RV (a)
showed in general the highest LRD, followed by erratic (b) and periodic (c) patterns. In all cases,Hcr in
periodic RV presented statistically significant differences (p < 0.05) with regard to regular and erratic breathing. . . 161
VII.4 First and second columns: Estimation error from surrogates (ǫsur) in RSS (Hs= 0.5) and SSS (Hs≈Hr).
Third column: Averaged estimation error (ǫsur) for HAS prescribing Hs(0.6, ...0.9). Results for regular
(a), erratic (b) and periodic (c) RV patterns. . . 162
VII.5 Comparison of the mean duration (DAp) and the number of apneas per hour (NAp) obtained by simulated
RV (grey lines) and from real signals (regular RV in triangles, erratic in circles and periodic in diamonds). These plots were obtained by simulated RV at H = 0.6, but similar curves were obtained with values between 0.55 and 0.9. . . 162
VII.6 Performance of estimators in 100 realizations of fLn. The median of the simulation error (ǫsim) in
solid lines and 75% and 95% confidence intervals in dashed-dotted (-.-) and discontinuous (- -) lines,
respectively. Curves for regular breathing in (a), erratic in (b) and periodic in (c). . . 163
VII.7 Example of estimating the Hurst exponent by DFA. F (m) is plotted against several box sizes (m) on a log-log scale for three synthetic series with prescribed H at 0.5, 0.7 and 0.9 (generated by fractional Gaussian noise). . . 164
VII.8 Hurst exponent in infected (red boxes) and healthy (blue boxes) infants, computed on the entire records (first columns) and in sliding windows of 2048, 1024 and 512 samples (second to fourth columns). H was
estimated using the LSSD method in a) and using DFA in b). . . 165
A.1 Example of application of BSS (FastICA algorithm) on a mixing model composed by four observed
signals (in red, represented as Fp1-T3 and Fp2-T4) and four sources (S1 to S4, in blue). . . 176
A.2 Example of application of BSS-CCA. In red, the EEG signals (expressed as Fp1-T3 and Fp2-T4) and in
List of Tables
I.1 Grading of infant’s states according Pretchl & Beintena [25]. . . 9
III.1 Summary of the different noise sources and the proposed solutions to remove them. . . 51
III.2 Order and delay values for several high-pass specifications using Kaiser window design method at a
sampling frequency of 128 Hz. . . 52
III.3 Summary of the results of rejecting movement artifacts by thresholding. The total length of EEGs and the rejected excerpts are given for recordings before (A) and after vaccine (B). This process lead to reject 27.3 over a total of 620 h. . . 72
III.4 Values for the ratios of removed artifacts, R (LFN+ECG) and Rqrs(ECG). An statistical analysis using
Mann-Whitney U-test compared the ratios of denoising methods without decomposition (HPF + AF or EAS) and those using decomposition. Pairs having the same super-indexed letters have statistical
significant differences (p-value < 0.05). In bold, best results. . . . 73
IV.1 List of selected infants, describing gestational (GA) and post-menstrual (PMA) in weeks, post-natal age
(PNA) in days, the weights of birth and current day in grams and sex (1 male; 2 female). . . 88
IV.2 Agreements (%) between first and second visual marks in each rater (intra-rater agreements) and between different raters (inter-rater agreements). As evidenced by the highest intra-rater agreement (86.1%),
operator C is the most self-consistent. Operators B and C, with ARBC= 81.9 have the closest labeling
criterion. . . 93
IV.3 Estimated coefficients (w) and standard error (SE) of the fitted LR model. The z-statistics and p-valuesb
of the Wald test are also given. As it can be observed, Kt has a very small contribution to the model
(small z), so its removal does not harm substantially the model (p=0.8863). . . . 95
IV.4 Pair-wise agreements (%) between the three rater’s marks and LR detections. The mean values for
ARLR−B and ARLR−B surpass the inter-rater agreements described in TableIV.2. . . 97
IV.5 Characteristics of bursts according the different raters (A, B, C) and automatic detection by logistic
regression (LR). A statistical analysis is shown in TableIV.6. . . 98
IV.6 p-values from a Mann-Whitney U test comparing the different burst characteristics according the different
raters and automatic detection by LR. In bold, variables having significant differences (p < 0.05). . . . 98
IV.7 Description of the assorted groups to assess maturation: PMA (postmenstrual age), PNA (postnatal
age), W (Weight at present day) and ∆W (gain of weight from birth). . . 104
V.1 Results from fitting the LR model to the artifact detector. The estimated coefficients (w) correspondingb
to the seven selected features and the intercept, and the standard errors (SE) of the MLE are detailed. We also provide the z-statistics and p-values of the Wald test. The remaining features did not contribute
V.3 Description of the characteristics composing the sub-cohort SEPSIS. There are no significant differences
between the age and weight of infants and duration of records. . . 126
V.4 Results from the comparative study of Sepsis and No-sepsis populations. The variables are expressed as mean ± std. dev. Asterisks denote statistically significant differences in a Mann-Whitney U test (p < 0.05). . . . 126
VI.1 Characteristics of the steadiest excerpts of 90 seconds selected for nonlinear analysis. . . 140
VII.1 Description and some characteristics of the selected signals of each pattern. µLand σLcorrespond to the mean and standard deviation of the lognormal law, respectively. . . 157
B.1 Description of sleep parameters, confronting age and weight groups (before vaccination). . . 181
B.2 Relative energy in several EEG bands versus the age and weight groups in non-quiet sleep (before vaccination). . . 181
B.3 Relative energy in several EEG bands versus age and weight groups in quiet sleep (before vaccination). 182 B.4 Discontinuity parameters describing burst activity versus age and weight groups in quiet sleep (before vaccination). . . 182
D.1 Super-indexes denoting statistically significant differences between groups (p < 0.05). . . 187
D.2 Mean statistics computed in the whole recordings. Results from PMA groups. . . 187
D.3 Mean statistics computed in the whole recordings. Results from PNA groups. . . 188
D.4 Mean statistics computed in the whole recordings. Results from weight groups. . . 188
D.5 Nonlinear measures averaged in the five most five regular 90-second excerpts. Results from PMA groups.188
D.6 Nonlinear measures averaged in the five most five regular 90-second excerpts. Results from PNA groups.188
List of acronyms
ADIF Averaged sum of the absolute values of amplitudes
aEEG Amplitude-integrated electroencephalogram
AIT Algorithmic information theory
AMI Average mutual information
ApEn Approximate entropy
AS Active sleep
AOP Apnea of prematurity
AW Active wakefulness
BSS Blind Source Separation
CA Conceptional age
CCA Canonical correlation analysis
CEDAC Combination of EEG decomposition and artifact cancellation
CEEEMDAN Complete ensemble empirical mode decomposition with adaptive noise
CHU Centre hospitalier universitaire
CL Classification
CPAP Continuous positive airway pressure
CWT Continuous wavelet transform
DFA Detrended fluctuation analysis
DFT Discrete Fourier transform
DP Data preprocessing
DWT Discrete wavelet transform
ECG Electrocardiogram
EEG Electroencephalogram
EEMD Ensemble empirical mode decomposition
EMD Empirical mode decomposition
EMG Electromyogram
EOG Electrooculogram
EOS Early onset sepsis
FARIMA Fractional autoregressive-integrated moving average models
fBm Fractional Brownian motions
FE Feature extraction
FFT Fast Fourier transform
fGn Fractional Gaussian noise
FIR Finite impulsional response filters
fLn Fractional lognormal noise
FN Number of false negatives
FP Number of false positives
Fp1,Fp2 Left and right fronto-temporal electrodes
FT Fourier transform
GA Gestational age
GKA Gaussian kernel algorithm
HAS Hurst-adjusted surrogates
HF High Frequency
HHT Hilbert-Huang transform
HRV Heart rate variability
HT Hilbert transform
iAAFT Iterated amplitude adjusted Fourier transformed surrogates
IBI Interburst intervals
IC Independent component
ICA independent component analysis
LIST OF ACRONYMS
IMF Intrinsic modal function
INSERM Institut national de santé et de recherche médicale
INTEM Intelligent monitoring system developed in the LTSI
IQR Inter-quartile range
IS Indeterminate sleep
IT Information Theory
LF Low Frequency
LFN Low frequency noise
LLE Largest Lyapunov exponent
LOOCV Leave-one-out cross-validation
LOS Late onset sepsis
LR Logistic regression
LRD Long-range dependence
LSSD Least squares based on standard deviation method
LTSI Laboratoire de Traitement du Signal et de l’Image
LZ Lempel-Ziv complexity
MLE Maximum likelihood estimate
Mm Maximum - minimum operator
NI Nonlinear index
NICU Neonatal intensive care unit
NIDCAP Newborn individualized developmental care and assessment program
NL Noise limit
NLEO Nonlinear energy operator
NREM Sleep states without rapid eye movements
PMA Post-menstrual age
QS Quiet sleep
QW Quiet wakefulness
REM Sleep state with rapid eye movements
ROC Receiver operating characteristic curve
RR Cardiac cycle duration
RSS Random-shuffled surrogates
RV Respiratory variability
SAT Spontaneous activity transients
SEPIA Surveillance, Explication et Prévention de l’Insuffisance cardiaque et de l’Apnée-bradycardie
SG Savitzky-Golay filter
Sn Sensitivity
SNR Signal-to-Noise Ratio
Sp Specificity
SpEn Sample entropy
SRD Short-range dependence
STFT Short-time Fourier transform
SSS Small-shuffled surrogates
SVM Support vector machines
T3,T4 Left and right temporal electrodes
TN Number of true negatives
TP Number of true positives
VLBW Very low-birth-weight infants
Résumé
L’incidence des naissances prématurés augmente progressivement dans le monde et est devenue un enjeu global de santé. Les répercussions entraînent non seulement une augmentation de la mortalité et la morbidité pendant l’enfance, mais également quelquefois des incapacités à l’âge adulte. Les avancées récentes dans le domaine du traitement du signal et son intégration dans les unités de soins intensifs néonatales (USIN) ont permis le développement de marqueurs non-invasifs, rapides et fiables du suivi du bébé prématuré. A titre d’exemple, l’évaluation de l’activité cardiaque et de sa variabilité au cours du temps a permis la mise au point d’outils efficaces pour la détection et la prédiction de l’apnée-bradycardie. Cependant, la disponibilité d’index objectifs permettant le diagnostic précoce d’infection généralisée (Sepsis) ou encore quantifiant la maturité restent encore aujourd’hui une question ouverte en néonatalité où des réponses sont attendues.
L’objectif de ce travail était d’étudier plusieurs modalités d’observation enregistrés en USIN de manière continue, en particulier l’électroencéphalogramme et la respiration. En ce qui concerne L’ECG, De nombreux travaux ont été menés par le Laboratoire Traitement du Signal et de l’Image (LTSI) dans le contexte de la détection de sepsis. Ceci explique que l’ECG n’a pas été abordé explicitement dans le cadre de ce travail. En revanche, le signal de respiration et l’EEG n’avaient jamais été auparavant analysés.
Pour l’EEG, son recueil en USIN se fonde sur un nombre réduit d’électrodes et implique de fait des enregistrements fortement bruités. Une partie de ce travail a donc été de minimiser les bruits superposés à l’EEG compte tenu des particularités de ces signaux contenant des formes très immatures, une forte non-stationnarité caractérisée par un tracé alternant transitoire de basses fréquences (bouffées EEG) et des périodes d’inactivité. Une approche originale, associant des techniques de décomposition de signal et d’annulation de bruit, a été donc proposée et étudiée en profondeur au Chapitre III. Les décompositions de l’EEG s’appuient sur la transformée discrète d’ondelettes (TDO), la décomposition modale empirique (DME) et la DME ensembliste avec bruit adaptatif (DMEEBA). L’annulation du bruit ECG exploite le filtrage adaptatif (FA) ou la correction par soustraction de l’interférence cardiaque moyenne (SIM).
Nous avons ainsi pu montrer, tant sur des simulations réalistes que sur des signaux réels, l’intérêt et la supériorité de la combinaison de la DMEEBA et le FA pour minimiser la distorsion de ces signaux EEG. Lorsque les signaux contiennent du bruit cardiaque et de basse fréquence, cette dernière association permet en effet d’augmenter le taux de suppression de bruit jusqu’au 50% par rapport à l’utilisation d’un filtrage passe-bande classique associé au FA.
sur la régression logistique (LR) de plusieurs paramètres. La LR permet la classification en bouffées et en intervalles inter-bouffées (IIB). Un étude comparative avec un détecteur de seuil classique, utilisé classiquement en néonatologie, a montré la supériorité de notre approche, présentant des performances en sensibilité de 96.1% (contre 91.4%) et de 95.9% en spécificité (contre 93.6%). En parallèle, nous avons également mené une étude sérieuse en comparant les performances d’annotation de bouffées de plusieurs experts. Nous avons ainsi souligné que le détecteur proposé présente un taux de concordance très satisfaisant avec trois experts cliniques différents.
Sur le plan clinique, nous nous sommes intéressés à la maturité du bébé prématuré ex-utero. L’objectif final étant à terme de proposer aux cliniciens des indices quantifiant cette maturité. Sur la base de données à notre disposition, nous avons pu montrer que la durée des bouffées et leurs fréquences d’apparition permettraient de quantifier la maturité.
Nous nous sommes également intéressés à l’impact de la vaccination sur l’activité cérébrale du nouveau-né. Cette analyse venait en complément d’une étude portant sur la variabilité cardiaque sur la même cohorte qui avait montré une augmentation des incidences cardio-respiratoires (notamment bradycardies et désaturations) aux données post-vaccinales. L’analyse quantitative de l’EEG, des hypnogrammes et des bouffées sur la base de données à notre disposition montrent que l’immunisation perturbe très faiblement le sommeil avec cependant une redistribution des énergies dans le spectre de l’EEG. En particulier, on a constaté une diminution de la puissance dans la bande delta inférieur (0.5 - 1.5 Hz) et une augmentation notable de la puissance dans la bande thêta inférieur (5.1 - 8 Hz).
Pour la deuxième modalité abordée dans ce mémoire, la respiration, il importe de rappeler que ce signal n’avait jamais été analysé par notre équipe de recherche. Il a été étudié sous sa forme temporelle mais aussi sous sa forme de séries de variabilité de cycle respiratoire, identiquement aux études de l’analyse de la variabilité cardiaque. Un détecteur de cycles respiratoires a donc été mis au point dans le Chapitre V. Il repose sur un débruitage préalable, afin de rejeter les artefacts de mouvements très fréquents en USIN, et un classifieur. Une nouvelle fois, ce classifieur se fonde sur la régression logistique et l’apprentissage à partir d’annotations d’experts. Les performances mesurées sur les bases de données à notre disposition montrent une sensibilité et une spécificité autour de 86% pour la réjection des artefacts, une valeur positive prédictive et une sensibilité de 97.7% pour la détection des cycles respiratoires.
Appliquée à la quantification de la maturation, nous avons souligné que le nombre d’apnées, et leur durée, la durée du cycle respiratoire ainsi que les puissances dans les bandes de basse fréquence -obtenues à partir d’une analyse spectrale des signaux de variabilité- varient avec la maturation du bébé. Pour la détection en ligne d’infection, nous avons constaté que l’écart type de la durée du cycle respiratoire et la durée des apnées s’allongeaient avec l’infection.
Le Chapitre VI s’est intéressé à l’application de méthodes non linéaires tels que la dimension de corrélation, l’entropie d’échantillonnage et la titration numérique de bruit pour l’étude la maturation. Dans un premier temps, sur des séries respiratoires régulières de courte durée, nous avons vérifié l’existence de non-linéarité. Dans un second temps, vis-à-vis de critères maturatifs, cette propriété évolue d’une manière irrégulière tendant à diminuer. Ces résultats contredisent des études similaires.
Résumé
L’ultime chapitre –centré sur l’analyse d’une autre propriété non-linéaire, la dépendance long terme (DLT)–, avait pour objectif d’utiliser l’exposant de Hurst (H) pour la détection d’infection à partir de séries de variabilité respiratoire. Afin de mener à bien cette étude, nous avons recherché le meilleur estimateur l’exposant de Hurst parmi trois : basé sur la transformé d’ondelettes (DWT), la “Detrended Fluctuation Analysis“ (DFA) et le ”Least Squares based on Standard Deviation“ (LSSD). Une analyse de performances sur signaux simulés à H prescrit a été conduite. Le simulateur exploite soit des données de substitution (surrogates), appelé ”Hurst-adjusted surrogates” (HAS), soit un modèle stochastique à bruit fractionnaire Gaussien. Outre le contôle du H, l’intérêt est de générer des signaux qui présentent des caractéristiques très similaires aux patterns respiratoires néonataux : Régulier, périodique et erratique. Les simulations ont montré que, pour le problème posé, les estimations d’H issues de la DFA et du LSSD s’avèrent plus robustes (biais et variance d’estimation plus faibles).
L’application de l’exposant de Hurst comme indicateur potentiel d’infection a été ensuite exploré. La population de nouveau-nés infectés témoigne une diminution significative de sa valeur d’H -mettant en exergue une dégradation de l’organisation fractale- par rapport à la population saine.
Ce travail a également conduit plusieurs plateformes logicielles et déjà exploitables par les cliniciens en recherche. La première concerne l’annotation des bursts, la deuxième celle des cycles respiratoires et des périodes artefactées. Ces stations représentent en effet un point de départ fondamental pour mener une étude à grande échelle sur la discordance entre plusieurs annotateurs. Comme déjà mentionné, les PHRC INTEM et CARESS-PREMI vont nous permettre de constituer des bases de données uniques sur plusieurs centres et ainsi évaluer les pratiques en tenant compte des effets centres.
Les suites à donner à ce travail sont multiples. En ce qui concerne le traitement du signal EEG, il importe de constituer une base de données horizontal permettant de valider l’ensemble des résultats obtenus. Ces derniers ne peuvent être à ce jour que considérés comme préliminaires dans la mesure où la base de données étudiée est réduite. En profitant des méthodes de classification, il sera alors pertinent d’analyser l’ensemble des grapho-éléments constituant l’EEG néonatale pour mener une étude de la maturation.
En ce qui concerne la seconde modalité, la respiration, il convient également de constituer une base de données horizontale élargie. Sur un plan plus méthodologique et pour le détecteur de cycles respiratoire, une comparaison avec d’autres méthodes de classification, telles que les séparateurs de vaste marge ou réseaux de neurones, serait necessaire afin d’envisager l’amélioration des performances actuelles.
Concernant les differents paramètres issus des outils linéaires et non-linéaires, la conception d’une analyse statistique multivariée permettrait vraisemblablement d’améliorier les performances la détection d’infection. Il est en effet naturel dans ce contexte d’exploiter nos résultats antérieurs fondés sur la variabilité cardiaque. Cette perspective fait explicitement partie du protocole hospitalier de recherche clinique CARESS-PREMI qui a la volonté de valider l’ensemble des outils fondés sur la variabilité cardiaque et respiratoire pour la détection d’infection. Ce protocole, coordonné par notre partenaire clinique, implique trois CHU (Rennes, Lille et Angers) et represente autant d’elements positifs et favorables pour l’exploitation clinique auprès du bébé prématuré des solutions décrites dans ce mémoire.
Introduction
The incidence of preterm births is increasing consistently worldwide and has become a global health concern, having repercussions not only on the increased mortality and morbidity rates during infancy, but also on the potential disabilities in adulthood [1]. Apnea-bradycardia and early onset sepsis are, without a doubt, two major issues of prematurity as they are manifested more frequently than in full-term populations [2].
Thanks to the introduction of neonatal intensive care units a few decades ago and to the development of computer-assisted monitoring systems, diagnostic and treatments can start without delay, improving the prognosis of these premature babies [3]. Recently, more sophisticated tools based upon physiological signals have emerged, leading to the vast research area with the “dream” of providing fast and non-invasive diagnostic indicators.
To succeed in such a purpose, the advances in signal processing applications and their integration in neonatal intensive care units are a real challenge. For instance, the assessment of the cardiac activity has been especially prolific, providing effective detection tools to prevent apnea-bradycardia [4, 5].
On the contrary, the electroencephalogram (EEG) and the respiratory trace have been less explored. This dissertation is focused on these signals and proposes issues for the early diagnosis of septicemic infection, the availability of objective maturity indexes or the influence of immunization.
The knowledge of the signals acquired in the NICU and their physiological particularities are essential and are described in a first chapter. Preterm’s EEG, characterized by a highly non-stationary activity and immature breathing, having a variety of patterns conditioned by apnea [6,7], are studied in detail. In Chapter II, a literature review focusing on the study of physiological signals from preterm infants is presented. The previous research related to these topics done by the Laboratoire Traitement du Signal et de l’Image (LTSI), in collaboration with the University Hospital (CHU) of Rennes, is also introduced, as well as a description of the two clinical databases recorded at the CHU since the last years.
The second part is devoted to the EEG, obtained from a simplified four-electrode system, and characterized by nonstationary patterns such as tracé alternant and slow delta waves. These signals are often artifacted and have remarkably different characteristics from adults’, hence an important effort will be done to preprocess them properly. In view of the multiple and complex noise sources and knowing that preserving the original waveform is crucial, a new denoising framework combining EEG decomposition and noise cancellation is introduced in Chapter III. An ensemble of tests compares different combinations of these methods, including a recent improved version of empirical mode decomposition [8], to find the most effective solution.
Afterwards, an automatic detector based in logistic regression is designed in Chapter IV to classify accurately burst/inter-burst intervals (IBIs) in EEG. Two clinical applications, the influence of immunization on the brain
activity and the investigation of some maturative indexes based upon the EEG, are also described.
In the last part of this work, breathing signals, obtained from abdominal movements, are exploited both in the temporal form and as respiratory variability (RV) signals. An artifact-rejection algorithm and an automatic cycle detector are designed for this purpose in Chapter V. Maturation and sepsis diagnosis are first studied by using linear signal processing methods. Next, Chapter VI carries out several analyses in breathing signals to quantify their nonlinear content, including classical chaos-based methods and noise titration [9–11]. These nonlinear tools are then explored to quantify the degree of maturation in premature newborns.
The long-range dependence property [12], estimated by the Hurst exponent (H), is studied in Chapter VII. A comparison of several estimation techniques of H is first performed, testing their robustness by evaluating the errors in artificial RV signals with prescribed H. To obtain signals with similar characteristics than the typical immature breathing patterns, a modified fractional Gaussian model and a newly-proposed surrogate technique are designed. The last part of the chapter goes back to a clinical application, the interest of the Hurst exponent as a real-time index to detect late onset sepsis.
In view of to the very challenging tools designed in this dissertation, several conclusions and perspectives are finally drawn.
Bibliography
[1] W. H. Organization. March of dimes, PMNCH, save the children, WHO. Born too soon: the global action report on preterm birth. Technical report (2012).
[2] J. M. Abu-Shaweesh and R. J. Martin. Neonatal apnea: What’s new? Pediatric Pulmonology, Pediatric Pulmonology 43(10), 937–944 October (2008).
[3] D. K. Richardson, J. E. Gray, S. L. Gortmaker, D. A. Goldmann, D. M. Pursley, and M. C. McCormick.
Declining severity adjusted mortality: Evidence of improving neonatal intensive care. Pediatrics 102(4), 893–899
October (1998).
[4] G. Pravisani, A. Beuchée, L. Mainardi, and G. Carrault. Short term prediction of severe bradycardia in premature newborns. In Computers in Cardiology, 2003, pages 725 – 728 September (2003).
[5] F. Portet, F. Gao, J. Hunter, and S. Sripada. Evaluation of on-line bradycardia boundary detectors from
neonatal clinical data. Conference proceedings: ... Annual International Conference of the IEEE Engineering in
Medicine and Biology Society. IEEE Engineering in Medicine and Biology Society. Conference 2007, 3288–3291 (2007).
[6] J. S. Hahn, H. Monyer, and B. R. Tharp. Interburst interval measurements in the EEGs of premature infants
with normal neurological outcome. Electroencephalography and clinical neurophysiology 73(5), 410–418 November
(1989).
[7] M.-F. Vecchierini, M. André, and A. d’Allest. Normal EEG of premature infants born between 24 and 30 weeks
gestational age: Terminology, definitions and maturation aspects. Neurophysiologie Clinique/Clinical Neurophysiology
37(5), 311–323 (2007).
[8] M. E. Torres, M. A. Colominas, G. Schlotthauer, and P. Flandrin. A complete ensemble empirical mode decomposition with adaptive noise. In 2011 IEEE International Conference on Acoustics, Speech and Signal
Processing (ICASSP), pages 4144–4147. IEEE May (2011).
[9] J. S. Richman and J. R. Moorman. Physiological time-series analysis using approximate entropy and sample
entropy. American Journal of Physiology - Heart and Circulatory Physiology 278(6), H2039 –H2049 June (2000).
[10] A. Lempel and J. Ziv. On the complexity of finite sequences. IEEE Transactions on Information Theory 22(1), 75–81 (1976).
[11] C.-S. Poon and M. Barahona. Titration of chaos with added noise. Proceedings of the National Academy of Sciences 98(13), 7107 –7112 June (2001).
Part I
Chapter I
Prematurity
The first part of this thesis introduces the premature birth, provides clinical definitions and outlines the problem statement. More particularly, this chapter aims at introducing the physiological and clinical problems associated to prematurity, as well as providing a brief review of the extensive research contributing to improve the overall preterm’s quality of life.
1 Definitions
In humans, prematurity refers to the broad category of neonates born between 24 and 37 weeks after the last menstrual period, in contrast to full-term birth, in which infants are born between 37 and 42 weeks (See Figure I.1).
Full-term birth 0 weeks
First day of last menstrual period
Gestation Premature birth
24 26 37
Early preterm Late preterm
33 42
Extr. preterm
Figure I.1–Birth chronogram according to the American Academy of Pediatrics [1].
Newborns undergo rapid changes as they are born. Stating the significance of the degree of prematurity their ages can be defined, as recommended by the standard terminology of the American Academy of Pediatrics [1], in gestational, chronological or post-conceptional terms (See FigureI.2). Likewise, different categories of prematurity are defined regarding at the post-menstrual age (PMA):
Extremely preterm infant, born before 26 weeks PMA. Early preterm infant, born between 26 and 32 weeks PMA.
Late or moderate preterm infant, born between 33 and 37 weeks PMA.
Newborns weighing less than 1 500 grammes at birth, regardless of their postmenstrual age, are also referred as very low-birth-weight (VLBW) infants. This group constitutes the 10-12% of premature births and is at high risk for significant mortality and morbidity [2].
Postmenstrual age
Gestational age Chronological age
Birth Expected date of delivery Conception
Corrected age
Date of assessment First day of last
menstrual period
Figure I.2–Definition of ages in prematurity according to the American Academy of Pediatrics [1].
Nowadays, more than 55 000 infants are born prematurely every year in France, representing approximately the 7% of births [3], and more than 400 000 in the United States [4]. Worldwide, it is estimated that preterm births in 2010 amounted to about 15 millions and, only in three of the 184 censored countries, the preterm birth rate decreased between years 1990 and 2010 [5].
Preterm birth is the main cause of neonatal mortality and morbidity, increased as the younger the infant is born: while only half of extremely preterm infants survive, the expectancy of survival rises to more than 90% between 27 and 28 weeks PMA [6]. Although the favorable outcome has improved since the implantation of neonatal intensive care units (NICUs) in the early 70’s, prematurity also tends to increase every year [5]. The causes for this phenomenon are not completely known, but approximately the 60% of premature births are provoked by medical complications during pregnancy and the remaining 40% are spontaneous [7].
Obviously, prematurity is a major global concern and, as a recent report of the World Health Organization outlined [2], more initiatives need to be proposed both in family planning and strategic investments in research and innovation to prevent and minimize the problem.
2 Particularities of preterm infants
During the third trimester of pregnancy (gestation weeks 29 to 40) the fetus undergoes important changes in the brain and lungs, the last organs to develop. The brain increases rapidly in size and establishes connections between nerve cells and the lungs are provided with surfactant while the blood-air barrier is established [8]. Hence, during the first weeks of extrauterine life, breathing and sleep-wake patterns in preterm infants are the most remarkable external manifestations of the immaturity of the lungs and the brain, respectively.
In comparison to their full-term counterparts, these manifestations, procured by the measure of physiological signals, have some particularities and reflect their maturation. Understanding the observed signals and sleep-wake organization in neonatal intensive care units is, then, crucial in the assessment of the infants evolution and in the implementation of individualized developmental programs.
2.1 Cerebral activity
Early brain development
During fetal development, the brain is subject to rapid and complex changes. Within the six weeks following conception, the neural tube (basic brain and spinal cord templates) is established. Before 24 weeks post-menstrual age, a massive proliferation of neurons and glial cells takes place, followed by a period called pattern formation
I.2 Particularities of preterm infants
in which neurons migrate and axons grow to form the framework of intercellular wiring. At early preterm phases (25-33 weeks PMA) the development of the brain is characterized by a remarkable complex activity involving neuronal maturation and connectivity in the frontal, somatosensory, visual and auditory cortex. After the 34th week, changes in sensory processing at the cortical level seem to occur, as suggests the overall advancement in the organization of cortical pathways [9]. In the term neonatal phase, the cortical circuitry reorganizes and there is a rapid development of spines and synapses [10].
The earlier is the interruption of gestation before the term phase, the more vulnerable the premature brain becomes. Actually, a decreased cephalic volume [11,12] and histological differences [9,13] can be observed when compared to term infants’ brain, but more importantly, preterm birth is associated with cerebral structural alterations. Although major tissue lesions are relatively rare, there are common alterations in preterm infants at term-equivalent age such as white matter disease, abnormal cortical and cerebellum development and other morphological abnormalities. Often subtle, they require computer-assisted imaging techniques to be evaluated [14].
In neurological examinations –tests evaluating muscular tone– premature infants at term ages are more hyperexcitable and tend to have less flexor tone in the limbs [15], and electroencephalograms are described more frequently by characteristic discontinuous patterns [16,17]. But from the functional point of view, the true effect of developing the brain at preterm ages is not completely known. It is well documented that the extrauterine period can accelerate some neurophysiologic behavior (EEG organization and sleep), but at the same time, the cardiorespiratory function presents more immature patterns than full-term matched cohorts. This contradiction seems to be a reflect of the adaptive measures of the immature brain facing the environmental stress [18,19].
Sleep-wake organization
The organization of sleep and waking patterns in the neonatal period has been considered a relevant indicator of the neuro-physiological maturation and underlying functioning of the brain and can be used to predict developmental outcome [16,20,21]. Moreover, sleep has implications on many physiological responses, such as the cardiovascular and respiratory systems [22,23].
The behavior of newborns was first analyzed by Prechtl and Beintena in 1967 [24], who demonstrated the predictable occurrence of the observed physiological rhythms (circadian rhythms), subsequently called behavioral states (described in TableI.1).
State 1 Eyes closed, regular breathing, no movement
State 2 Eyes closed, irregular breathing, no gross movements State 3 Eyes open, no gross movements
State 4 Eyes open, gross movements, no crying State 5 Eyes open or closed, crying
Table I.1–Grading of infant’s states according Pretchl & Beintena [25].
Later, variables from the polysomnography such as respiration, heart rate, EEG and eye movements were included to this classification to become the well-known quiet, active sleep and wakefulness used to describe neonatal sleep-wake patterns during the first six months in infancy [26]. Although these sleep states exist in fetuses and preterm infants, their earliest age of appearance is still controversial [27,28] and hence no general
consensus has been reached among neonatologists. Depending on the degree of maturity, the sleep-wake behavior can be classified according to the following states [29], albeit different versions exist:
Quiet sleep (QS): The breathing and heart ratio are predominantly regular. Eye or corporal movements are not observed. EEG is basically discontinuous.
Indeterminate sleep (IS): Contains patterns from both quiet and active sleep. Some authors do not differen-tiate indeterminate from active sleep.
Active sleep (AS): The heartbeat and respiratory rhythms are irregular. Sporadic movements occur and rapid eye movements (REM) are present intermittently. EEG activity is continuous and mixed.
Quiet wakefulness (QW): Infants appear alert with the eyes open and a quiet motor activity. Active wakefulness (AW): Infants appear irritated or crying. QW patterns may be included.
The graphical representation of sleep states as a function of time is known as hypnogram (see an example in FigureI.3). QW AS IS QS 1st cycle 2nd cycle 10 min AW
Figure I.3–Example of hypnogram from a 35 weeks CA newborn, where the baby felt asleep in a short active sleep period. The first sleep cycle was measured from the end of the post-waking AS to the end of the next AS period (following a QS sleep period) [29].
Normal infants undergo a rapid evolution of the organization of the sleep states during the preterm period. Quiet sleep is rare at the earliest preterm ages but it increases progressively, whereas indeterminate sleep decreases in favor of an augmentation of active sleep (see FigureI.4) [29]. The amount of waking states also increases during this period, continuing beyond term ages [30].
31-34 35-36 37-38 39-41 20 40 60 80 27-30 % QS IS AS
Figure I.4–Evolution of the percentage of sleep states from 27 to 41 weeks of conceptional age in neurologically normal infants [29]. IS decreases progressively in favour of more differentiated sleep states (QS and AS).