HAL Id: inserm-00529787
https://www.hal.inserm.fr/inserm-00529787
Submitted on 26 Oct 2010HAL is a multi-disciplinary open access archive for the deposit and dissemination of sci-entific research documents, whether they are pub-lished or not. The documents may come from teaching and research institutions in France or abroad, or from public or private research centers.
L’archive ouverte pluridisciplinaire HAL, est destinée au dépôt et à la diffusion de documents scientifiques de niveau recherche, publiés ou non, émanant des établissements d’enseignement et de recherche français ou étrangers, des laboratoires publics ou privés.
Single cells spreading on a protein lattice adopt an
energy minimizing shape
Benoit Vianay, Jos Käfer, Emmanuelle Planus, Marc Block, François Graner,
Hervé Guillou
To cite this version:
Benoit Vianay, Jos Käfer, Emmanuelle Planus, Marc Block, François Graner, et al.. Single cells spreading on a protein lattice adopt an energy minimizing shape. Physical Review Letters, American Physical Society, 2010, 105 (12), pp.128101. �10.1103/PhysRevLett.105.128101�. �inserm-00529787�
Single Cells Spreading on a Protein Lattice Adopt an Energy Minimizing Shape
Benoit Vianay,1 Jos Käfer,2,† Emmanuelle Planus,3 Marc Block,3 François Graner,2,4 and Hervé Guillou1,‡
1Institut Néel, CNRS et Université Joseph Fourier, BP166, 38042 Grenoble Cedex 9, France
2Laboratoire de Spectrométrie Physique, UMR 5588, UJF Grenoble I & CNRS, 140 Avenue de la Physique, 38402
Saint Martin d’Hères, France
3INSERM U823, Equipe DySAD, Institut Albert Bonniot, Site Santé, BP170, 38042 Grenoble, France 4Institut Curie, UMR3215 CNRS, U934 Inserm, 26 rue d’Ulm, 75248 Paris Cedex 05, France
ABSTRACT
When spreading onto a protein microlattice living cells spontaneously acquire simple shapes determined by the lattice geometry. This suggests that, on a lattice, living cells’ shapes are in thermodynamic metastable states. Using a model at thermodynamic equilibrium we are able to reproduce the observed shapes. We build a phase diagram based on two adimensional parameters characterizing essential cellular properties involved in spreading: the cell’s compressibility and fluctuations.
Living cells are out of equilibrium systems regulated by a complex network of biochemical reactions [1]. Cell adhesion to the extracellular matrix (ECM) or to neighboring cells is a fundamental biological phenomenon that is involved in stem cell differentiation and in numerous pathologies [2,3]. The specific interactions between the ECM and the membrane proteins are crucial since they trigger biochemical signaling [4]. Cell adhesion is a dynamic process [5] that relies on membrane protrusions for the search for new ligand, the engagement of specific receptors, the activation of the contractile machinery based on the actin-myosin interaction, and the slow relaxations of the viscous cytoskeleton [6,7] that finally leads to spreading. An extensive thermodynamic description of adherent cell shapes would require the knowledge of all the generalized forces and fluxes [8]. Although this is possible to address theoretically for the actin cytoskeleton, in an elegant and general way [9], the experimental measurements of the molecular details are difficult.
A simplification might be achieved by physically limiting the number of configurations that a single cell shape can take. Protein micropatterns have been used to control the contact area [10], the size of focal adhesions [11] and the distance between engaged receptors [12], cell polarization [13,14] as well as the overall stress distribution within cells or tissues [15,16]. They provide a controllable external parameter, and force cells to organize in different shape classes: this reduces statistical dispersion and facilitates data analysis as well as modeling [17–19].
In this Letter we use ECM protein square lattices of controlled geometry (Fig. 1). We perform statistical analysis of spread cell shapes and numerical simulations based on an equilibrium thermodynamic model. Both our experimental observations and our phase diagram obtained numerically suggest that the observed shapes correspond to metastable states in an energy landscape. Our results justify in fine the purely mechanical approach used in alternative models [17–19].
Each pattern is made of a lattice of 5µm x 5 µm square adhesive spots of a protein fragment of fibronectin [20] complemented by antiadhesive poly(ethylene-glycol). The fragment includes the specific interaction site with the integrins, which are transmembrane proteins responsible for adhesion and signaling in the 3T3 mouse fibroblasts [1]. These cells are harvested and plated onto the patterns, then left to spread for 3 to 4 h before fixation in paraformaldehyde and immunostaining; for details on the method, see Ref. [21].
The spreading process described in [21,22] involves long membrane protrusions such as filopodia, a type of protrusion with parallel actin filaments. This contrasts with nonpatterned supports where lamellipodia with dendritic actin filaments are dominant. As a result, the spreading rateis reduced and cell polarization induced by the migration is not observed within the spreading time.
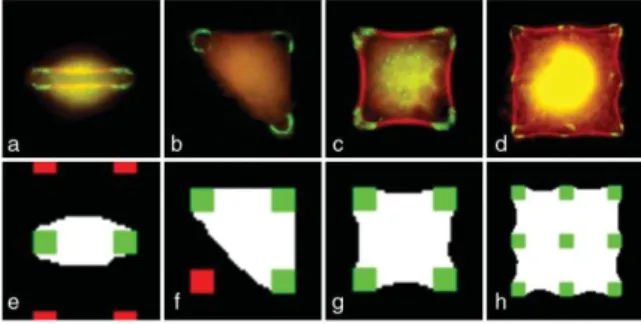
FIG. 1. Cell shapes on a square lattice of adhesive spots. Top: experimental cell shapes when spreading occurs on 2 (a) 3 (b) 4 (c) or 9 (d) adhesive spots. Focal adhesions are labeled in green and the actin cytoskeleton is labeled in red. The distance between adhesive spots is 10 µm. Bottom: corresponding simulated cells shapes. unoccupied adhesive spot; green: occupied adhesive spot.
Statistical studies on fixed cells showed that the most likely shape depends strongly on the pitch of the ECM lattice. For small pitch (below 10 µm) many shapes are very similar to those observed on nonpatterned supports. If the distance between adhesive spots is comparable with the characteristic protrusion length [22], spreading is constrained by the lattice. For larger pitches, between 10 and 15 µm, cells adopt various simple shapes matching the protein lattice. Typical observed shapes are shown in [Figs. 1(a)–1(d)]. The shape with the higher occurrence is a four adhesive spots square [Fig. 1(c)]. The shapes that are more often observed have the longer lifetime and probably correspond to local minima of an energy functional.
We use simulations to test if the cells’ shape can be described by energy minimization, in order to find parameters and measures that can be compared to biological experiments. Here we model cells as two-dimensional (2D) objects on a 2D square lattice. Cells are supposed to be homogeneous: the cytoskeleton and the nucleus are not explicitly taken into account. The cellular Potts model (CPM) was introduced originally [23] to simulate variable cell shape and size in an assembly of interacting cells. It minimizes a functional depending on geometrical cell parameters (such as area and perimeter) and on an adhesive constraint. We apply it here to single cells. We choose to minimize the following energy based on the balance between adhesion and cortical tension [24–26]:
Here, the experimentally observed strong interaction between integrins and fibronectin is considered by adding an adhesive constraint that corresponds to a negative cellsubstrate interaction energy [24,25], which is kept constant in all the simulations presented: Jcs = 250. Aa is the cell adhesive area (in contact with ECM spots), much smaller than spread area Acell. The total length of interface between the cell and the culture medium is the perimeter pcell. Jcm > 0 is the energy per unit length of this interface. It describes the biological contractility of the stress fibers, which is mediated by myosin [25,26]. High contractility means a high value of Jcm, which straightens the cell contours. A0 is the cells’ preferred area and _A is the area elastic compression modulus: the last term of Eq. (1) enforces area conservation through an energy cost due to the deviation of cell’s area from its nominal value. Since the actin gel in the volume of the cell is contractile through the action of myosin, this last term too is associated with the activation of myosins, in addition of passive components related to the elastic compressibility of the cytoskeleton, actin cortex, and cytoplasm. The possible cross talks between the signaling pathways are not considered in this Letter. The pressure difference between the intra- and extracellular part is
At constant adhesion surface, the minimization of the energy functional leads to the following equation which fixes the membrane curvature (Laplace law):
If the pressure difference is positive, an increase in perimeter increases the area. This corresponds to swelled cells that extend beyond the adhesion spots [Figs. 1(a) and 1(b)]: these cells are not well spread. In contrast, if the pressure difference is negative, then an increase in perimeter will decrease the area. This corresponds to tight cells that are well spread and curved toward the interior of the surface defined by the adhesion spots [Figs. 1(c) and 1(d)].
We apply Monte Carlo sampling and the Metropolis algorithm as in [23,27,28]. We choose each site on the lattice at random; we propose a change in its value, and accept it with a Boltzmann probability distribution dependent on the fluctuation amplitude T, playing the role of an
effective temperature:
During one Monte Carlo step (MCS), each pixel is considered for a value change once. We test the model for various parameter values. Stable shapes are obtained for the ranges 1<T<1000, 0.1 <A < 100, and 5<Jcm<50. Higher T produces cell dissociation whereas lower T freezes the cells and forbids any optimization. Large A prevents area deviation from its nominal value.
We first aim at qualitatively reproducing the diverse classes of observed shapes within one set of simulation parameters. We perform simulations with an array of 100 x 100 pixels. The scale in simulation is 0:5 µm/pixel to match the optical resolution (0:58 µm/pixel). T is set to 300. After the initial area relaxation, interface fluctuations allow the cell to explore its close environment. After 104 MCS of optimization, cell shape is annealed by slowly decreasing T to 20 (T= -3 each 10 MCS) and relaxes for 4
x 103MCS at T = 20 in order to have smooth interfaces. Some simulated shapes are shown on Figs. 1(e)– 1(h). We obtain a good visual agreement with observed shapes for both swelled and tight cells.
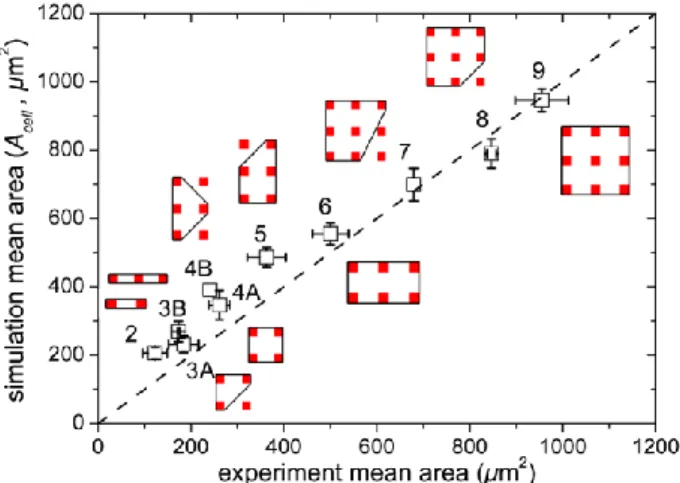
We then statistically analyze the simulated and experimentally observed cell shapes. The values of A0 are selected to span uniformly the observed experimental area distribution (from 50 µm2to 1200 µm2). Cell shapes are classified according to the number of adhesive spots occupied. For each class of shape the mean area is computed. Simulation parameters are tuned in order to match the mean area of simulated and experimental shapes. The values A= 0.1 and Jcm=30 yield good correlation with experimental observations (Fig. 2). This indeed suggests that the protein lattice forms an adhesive energy landscape in which cell shapes correspond to local minima. In real cells, the transition between shapes occurs by crossing energy barriers with active large membrane fluctuations such as filopodia [21,22]. The description of these transitions is beyond the scope of the present CPM simulations.
FIG. 2. Comparison of cell areas in experiments and in simulations. Each point corresponds to one class of shape
labeled by the number of adhesive spots. The
corresponding shapes are sketched with straight lines. Bars are standard deviations. The dashed line is y =x.
To fine tune the model parameters, detailed simulations focus on the four spots squares [Figs. 1(c) and
1(g)]. Forty images of square cells were acquired using high resolution optics (X60 oil, NA = 1:4, 0.18µm/pixel) and simulations were realized on 200 X 200 pixels array at a scale of 10/62 µm/pixel. From Eq. (1) we choose two adimensionalparameters that reflect independent features of these CPM simulations: M = AAo3/2/Jcm and S = T/(JcmAo1/2). An extensive study of the effect of these parameters yields a phase diagram of the spread cells (Fig. 3).
The parameter M is a measure of the competition between the elastic compressibility of the cell body and stress fibers contractility: it determines the curvature of the interface between the cell and the medium. For a given A0 <Asq, increasing M decreases the radius of curvature. Considering only myosin activity, this effect can be understood as the relative decrease of their activity in stress fiber (Jcm decreases) with respect to their activity in the cytoplasmic actin gel (A increases).
The parameter S is a measure of the competition between the interface fluctuations and stress fibers contractility. An increase in S at constant curvature leads to fluctuations of a larger amplitude, which is seen on average as a smoother transition between the cell and the extracellular medium (Fig. 4). At small M, if S is too large, interface fluctuations are sensitive to boundary conditions and simulations yield unphysical results. At large M and S, the cost of interface is reduced and the cell breaks in smaller parts attached to the substrate. For particular values of M and S represented by the dashed line in and simulations yield unphysical results. At large M and S, the cost of interface is reduced and the cell breaks in smaller parts attached to the substrate. For particular values of M and S represented by the dashed line in Fig. 3, the interface deviates less than 2 pixels from the straight line: the curvature is thus zero within our measurements accuracy. According to Eq. (2) the pressure difference is then 10 times smaller than the pressure difference in cells with maximal curvature (R ≈ 5 µm).
FIG. 3. Phase diagram of cell shapes as a function of parameters M and S. A0=10
4
is fixed for all simulations. The area of the exact square shape is Asq = 15 376 square pixels. Dots represent tight cells, triangles represent swollen cells, and squares represent unstable cells. Lines are guides for the eyes, they mark the approximate transition between stable and unstable regions (solid lines) and between swollen and tight cells (dashed line).
Images representing 400 averaged shapes illustrate the shapes observed for the corresponding values of the parameters. The colors represent the fraction of occupancy (see inset of Fig. 4). The shape atM = 40, S = 0:5 can be unstable, the stable result is represented. The large black circle represents the values for living cells: M = 20, S = 0.25 (see text).
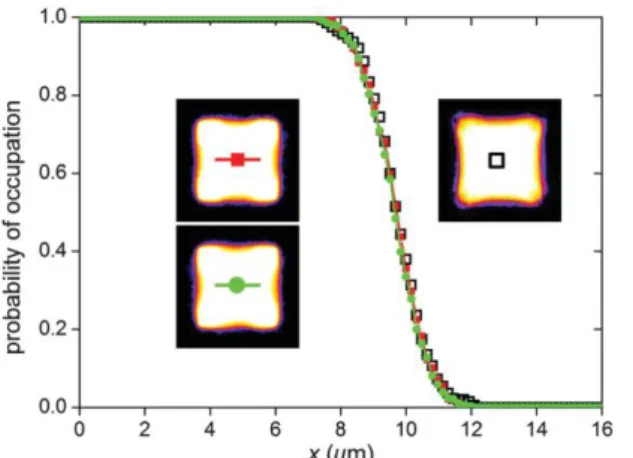
We now seek a method to place the observed shapes onto the diagram of Fig. 3 and find for a cells’ population the values of the parameters M and S. To compensate for biological variability we average the binary images and measure the curvature by fitting a circle through the line of occupation fraction 1/2 . According to the diagram of Fig. 3this curvature is fixed by the value of the parameter M. Thewidth of the transition region between the cell body andthe culture medium is then determined by the value of S.The corresponding results are represented on Fig. 4 wherethe cross sections obtained for the experiments are compared with those obtained numerically for two different sets of parameters. A good agreement is achieved for M =20 ± 5 and S = 0.25 ± 0:3. In Fig. 3 the corresponding position of the averaged living cells is marked by a large black circle. These values only apply to a square cell covering four adhesive spots; other shapes have differentmembrane curvatures, and a different phase diagram, thus different values for M and S can be found in the same way for these shapes.
FIG. 4 Cross sections of cells. X is the distance to the cell center along the horizontal axis. The probability of occupation is defined for each pixel as the fraction of cells which occupy this pixel. Open squares: experiments averaged on 40 thresholded cell profiles (ensemble average). Closed squares and closed circles: simulated cell profiles (time and ensemble average) for a different set of parameters but identical M = 20 and S = 0.25 values (filled squares: Jcm = 10, A = 2 x10
-4 , T = 250, A0 = 104; closed circle: Jcm = 5, A= 10-4, T = 125, A0 = 104). Insets: corresponding images of the occupation fraction. The color scale has been chosen to enhance low values of intensity [29].
In conclusion, the observation of multiple stable shapes suggests that these shapes are at the metastable minima of an adhesion energy landscape. The optimization of biological cells’ shapes is thus fast compared with the process of barrier crossing (by filopodia and lamellipodia) which is biologically limiting the spreading. The geometry of the protein lattice and parameters such as the line tension, the adhesion surface energy, and the area elastic modulus are sufficient to reproduce essential features of the experimentally observed shapes within a thermodynamic equilibrium model. More experiments are required to relate the values of the model parameters quantitatively to biological data. It would be of great interest to inhibit biochemical regulation pathways and monitor the evolution of the position of shapes in the phase diagram. Preliminary results obtained using blebbistatin, a myosin inhibitor, seem to increase M and decrease S, which, in terms of this model, can be explained as a decrease in stress fiber contractility (Jcm) with respect to the cytosol elastic compressibility (A) and a decrease in fluctuation amplitude (T).
ACKNOWLEGMENTS
This work was supported in part by ANR Contract No. ANR-08-PCVI-0027. B.V. was supported by MESR. H. G. and B.V. thank the ‘‘Pôle Capteurs et Calorimétrie’’ and the ‘‘Pôle Cryogénie’’ of the Institut Néel for their technical support.
REFERENCES
[1] B. Alberts, D. Bray, J. Lewis, M. Raff, K. Roberts, and J. D. Watson, Molecular Biology of the Cell (Garland Publishing, New York, 1994).
[2] J. P. Thie´ry, C.R. Physique 4, 289 (2003).
[3] M. A. Schwartz and D.W. DeSimone, Curr. Opin. Cell Biol. 20, 551 (2008). [4] E. Zamir and B. Geiger, J. Cell Sci. 114, 3583 (2001).
[5] D. A. Lauffenburger and A. F. Horwirtz, Cell 84, 359 (1996). [6] D. C. Morse, Macromolecules 31, 7030 (1998).
[8] S. R. de Groot and P. Mazur, Non-Equilibrium Thermodynamics (North-Holland Publishing Company, Amsterdam, 1969).
[9] K. Kruse et al., Eur. Phys. J. E 16, 5 (2005). [10] C. S. Chen et al., Science 276, 1425 (1997). [11] D. Lehnert et al., J. Cell Sci. 117, 41 (2004).
[12] E. A. Cavalcanti-Adam et al., Biophys. J. 92, 2964 (2007). [13] M. The´ry et al., Proc. Natl. Acad. Sci. U.S.A. 103, 19771 (2006). [14] A. Brock et al., Langmuir 19, 1611 (2003).
[15] M. The´ry et al., Cell Motil. Cytoskeleton 63, 341 (2006).
[16] W. R. Legant et al., Proc. Natl. Acad. Sci. U.S.A. 106, 10097 (2009).
[17] V. S. Deshpande, R. M. McMeeking, and A. G. Evans, Proc. Natl. Acad. Sci. U.S.A. 103, 14 015 (2006). [18] I. B. Bischofs et al., Biophys. J. 95, 3488 (2008).
[19] I. B. Bischofs, S. S. Schmidt, and U. S. Schwarz, Phys. Rev. Lett. 103, 048101 (2009). [20] D. J. Leahy, I. Aukhil, and H. P. Erickson, Cell 84, 155 (1996).
[21] H. Guillou et al., Exp. Cell Res. 314, 478 (2008).
[22] H. Guillou, B. Vianay, M.R. Block, and J. Chaussy, arXiv:0908.2953v1. [23] F. Graner and J. A. Glazier, Phys. Rev. Lett. 69, 2013 (1992).
[24] J. P. Rieu et al., Biophys. J. 79, 1903 (2000).
[25] J. Ka¨fer et al., Proc. Natl. Acad. Sci. U.S.A. 104, 18549 (2007). [26] T. Lecuit and P.-F. Lenne, Nat. Rev. Mol. Cell Biol. 8, 633 (2007).
[27] A. F. M. Mare´e, V. A. Grieneisen, and P. Hogeweg, Single Cell Based Models in Biology and Medicine, Mathematics and Biosciences in Interaction (Birkha¨user, Basel, 2007), Chap. 2, p. 107.
[28] P. Marmottant et al., Proc. Natl. Acad. Sci. U.S.A. 106, 17 271 (2009).