Publisher’s version / Version de l'éditeur:
Vous avez des questions? Nous pouvons vous aider. Pour communiquer directement avec un auteur, consultez la première page de la revue dans laquelle son article a été publié afin de trouver ses coordonnées. Si vous n’arrivez pas à les repérer, communiquez avec nous à PublicationsArchive-ArchivesPublications@nrc-cnrc.gc.ca. Questions? Contact the NRC Publications Archive team at
PublicationsArchive-ArchivesPublications@nrc-cnrc.gc.ca. If you wish to email the authors directly, please see the first page of the publication for their contact information.
https://publications-cnrc.canada.ca/fra/droits
L’accès à ce site Web et l’utilisation de son contenu sont assujettis aux conditions présentées dans le site
LISEZ CES CONDITIONS ATTENTIVEMENT AVANT D’UTILISER CE SITE WEB.
North American Contribution to the 2nd International Conference on Permafrost,
pp. 759-766, 1973
READ THESE TERMS AND CONDITIONS CAREFULLY BEFORE USING THIS WEBSITE. https://nrc-publications.canada.ca/eng/copyright
NRC Publications Archive Record / Notice des Archives des publications du CNRC :
https://nrc-publications.canada.ca/eng/view/object/?id=ab5fd675-2a03-4aa5-ab1f-250354731bca
https://publications-cnrc.canada.ca/fra/voir/objet/?id=ab5fd675-2a03-4aa5-ab1f-250354731bca
NRC Publications Archive
Archives des publications du CNRC
This publication could be one of several versions: author’s original, accepted manuscript or the publisher’s version. / La version de cette publication peut être l’une des suivantes : la version prépublication de l’auteur, la version acceptée du manuscrit ou la version de l’éditeur.
Access and use of this website and the material on it are subject to the Terms and Conditions set forth at
Performance of a warm-oil pipeline buried in permafrost
Reprinted from
PERMAFROST:
The North American Contributionto the Second International Conference
ISBN 0-309-02 1 15-4
N A T I O N A L ACADEMY O F SCIENCES Washington, D.C. 1973
PERFORMANCE OF A WARM-OIL PIPELINE
BURIED I N PERMAFROST
George
H.
Watson
[I]
and Raymond
K.
Rowley
121
William A. Slusarchuk
MACKENZIE V A L L E Y PIPELINE RESEARCH LIMITED
Calgary, Alberta
INTRODUCTION
To study the behavior of permafrost as a foundation material for a warm-oil pipeline, Mackenzie Valley Pipe Line Research Limited, with technical assistance from the Division of Build- ing Research, National Research Council of Canada, installed a 27-rn test section of 0.61-m-diameter pipe near Inuvik, N.W.T. The surrounding foundation material (ice-rich silty clay) was thawed by circulating oil at 71 OC.
The principal objectives of the field test, which began in July 1971 and concluded in January 1972, were to
1. Measure pore pressure within the foundation during thawing and assess its effect on shear-strength values for analyses of slope stability;
2. Measure temperature within the foundation and deter- mine the location and rate of movement of the thaw front;
3. Monitor settlement of both foundation and pipe dur- ing thawing and freezeback; and
4. Determine representative frozen bulk densities for each soil layer within the foundation, predict values of pipe settlement, and compare these values with the measured movements.
N A T I O N A L RESEARCH COUNCIL O F C A N A D A
Ottawa, Ontario
SITE CONDITIONS
The Inuvik test site is located in the continuous permafrost zone (at about lat. 68O20' N, long. 1 3 3 ~ 4 5 ' W) adjacent to the Mackenzie River Delta.
The buried test section was located adjacent to existing oil-circulating facilities. A gravel work pad had been built on the site previously but not used. The greatest depth of ice- rich silt was found at this location. It was also an economical location because of its proximity to the existing support facilities.
A generalized soil profile, obtained from large-diameter (30 cm) cores, is given in Table I.
INSTALLATION O F TEST FACILITY
The 0.61-m pipe was installed during the first week of July 1971. A small backhoe was used to remove the 1.21-m thick- nesses of gravel pad and dig a trench approximately 1 m deep into the virgin soil. The pipe was bedded on sand and the ditch backfilled with sand to the bottom of the gravel fill. The gravel fill was then restored.
Settlement rods were attached to the pipe at the centre and
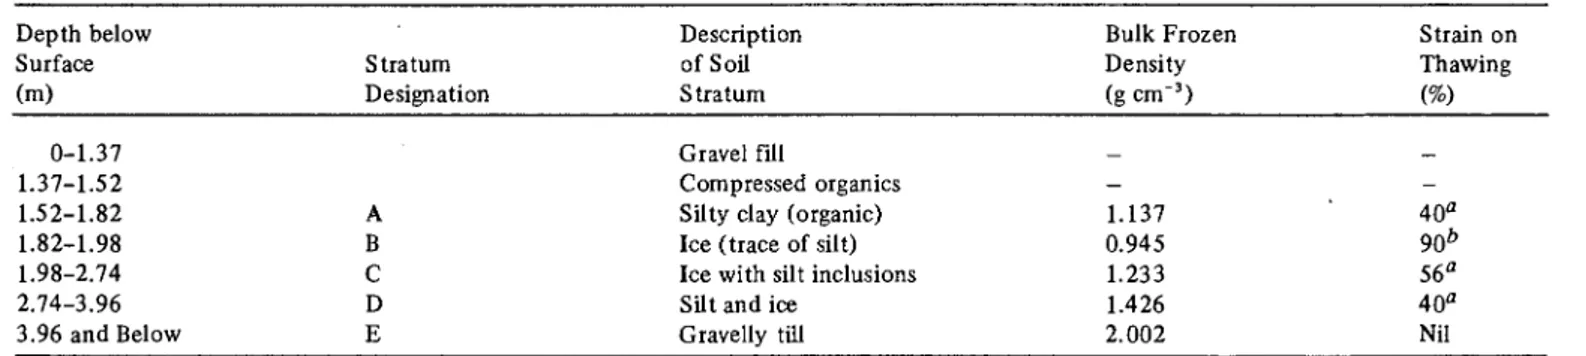
TABLE I Generalized Soil Profile of lnuvik Test Site
Depth below Description Bulk Frozen Strain on
Surface Stratum of Soil Density Thawing
(m) Designation Stratum (g cm-3) (%)
0-1.37 Gravel fill - -
1.37-1.52 Compressed organics - -
1.52-1.82 A Silty clay (organic) 1.137 40'
1.82-1.98 B Ice (trace of silt) 0.945 9ob
1.98-2.74 C Ice with silt inclusions 1.233 56'
2.74-3.96 D Silt and ice 1.426 40'
3.96 and Below E Gravelly till 2.002 Nil
'
Estimated from laboratory tests at in siru overburden pressure Estimated from field frozen bulk density, measured on core samples.760 SESSION V I I : PRINCIPLES O F CONSTRUCTION I N PERMAFROST REGIONS
both ends, and temperature sensing points installed within it. of 11 piezometers and 28 thermistors. A second series of Protective sleeves were installed around the settlement rods "floating" (i.e., not anchored) single-sensor piezometer to prevent damage. probes was installed as an auxiliary system for the rigid an-
chored assemblies. A series of standpipes was installed t o
TEST SECTION OPERATION
The flow of warm oil through it began on 22 July 1971. The oil temperature was maintained at approximately 7 1 "C until 1 October 1971 when the heaters broke down and cir- culation was stopped. The oil temperature gradually decreased,
until by 3 November 1971 it was down to 3 OC. Warm oil circulation was then resumed and continued until January 1972.
Pore pressure and thermistor readings were taken daily and a settlement survey was made at least twice weekly. Grid surveys were also taken before, during, and after the test to define surface settlement.
INSTRUMENT SELECTION AND INSTALLATION
Although development of instruments for measuring soil properties in unfrozen soils is well advanced, only limited progress had been made in instrumentation for measuring pore pressures in frozen soils during thaw. It was recognized that t o instrument the frozen foundation of the proposed facility, some development work would be necessary, especially for pore pressure measurement, to ensure that the instruments would perform adequately and be sturdy enough to withstand arctic conditions. Details of the instrumentation used are described e l ~ e w h e r e . ~
Selecting the piezometer was the most difficult task. The unit had t o be sensitive in the low range of pore pressure values anticipated in the test, yet rugged enough to withstand possible high freezeback pressures. A rapid response was also required.
Standpipe, closed hydraulic, electrical diaphragm, and pneumatic units were considered. Tlle pneumatic unit was chosen because it met the requirements of sensitivity plus ruggedness and also had been used successfully in frozen dyke foundations.' This instrument functions by the application of gas pressure through a closed-loop system t o balance the pore pressure acting against the sensing element. For use in impervious soils, this type of piezometer has a single bellows t o minimize time lag. Any change in pore pressure results in minute movement of the bellows, requiring displacement of only a very small amount of pore water.
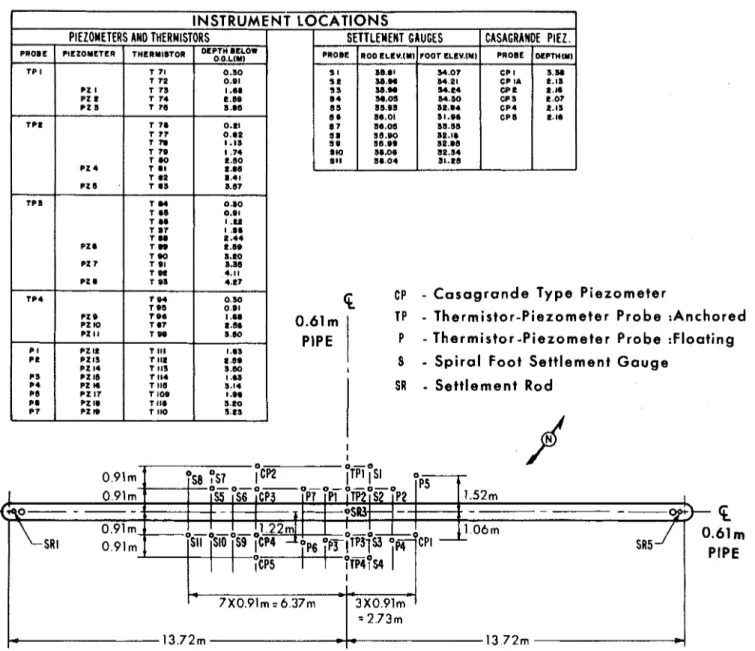
Instrument locations in the ground around the pipe were selected on the basis of thermal simulator predictions, ex- perience gained from a previous test loop,' and known soil and ice conditions (Figure 1). Four piezometer-thermistor probes, anchored at depth, were used t o monitor the cross- section locations and were placed close to the centre of the test section. These multiple sensor probes contained a total
monitor the groundwater levels across and along the pipe during thaw.
Installation of the instruments started on 10 July 197 1. Standard piezometer installation procedures were followed with minor changes because of the permafrost. Each pie- zometer-thermistor unit was placed in the hole with the sensor openings surrounded by a plug of sand at least 45 cm long. The sand was saturated with a glycol mixture to ensure a "hard" system. A 45-cm (minimum) compacted bentonite seal was then placed above each sand plug.
The chambers around the piezometers in both single- and multiple-sensor probes were saturated with a mixture of water and glycol. Their calibration was re-checked before in- stallation. In assembling the probes, an extra length of casing was provided at the bottom. Just before placement, the depth of the instrument hole was measured accurately and the extra casing cut off as necessary to allow the probe t o be set at the correct elevation.
A small heated hut was built close to the instrumented area to house all the reading equipment and readout points for the piezometers. All thermistor leads were run t o the existing instrument trailer and connected to the readout equipment.
For measuring temperature, thermocouples, resistance- temperature devices (RTD'S) and thermistors were considered. Thermistors were chosen because they had been used success- fully at the Inuvik site and could be easily incorporated into the existing digital readout system. The existing datum stations, used to monitor the soil-temperature profile t o sup- ply data for a thermal simulator, consisted of a series of thermistors to a depth of 7.5 m.
In view of the limitations of the conductive model used for predicting thaw-front location,' additional instrumenta- tion was installed (e.g., ground surface temperature sensors) to upgrade the input data so that the buried test section's thermal effects on the foundation could be simulated later. Field-measured soil thermal conductivities are being used in continuing analytical studies. Convection effects in this case were minimal as the level site made for little groundwater flow.
The National Research Council of Canada has developed settlement gages for use in permafrost and their spiral foot gage was selected for use in this study.''3
As pore pressures were expected to be small, the elevation of the groundwater level in the thaw bulb had t o be accu- rately defined. For this purpose, data from the standpipes were supplemented by direct measurements of the water table elevation in the trench, a t the centre and end settle- ment points of the buried pipe. A well-established water
Watson et al.: Performance of a Warm-Oil Pipeline Buried in Permafrost 761
-
N T L O C A T I O N S
I
1
SETTLEMENT GAUGESI
CASAGRANM PIEZ.1
CP
-
C a s a g r a n d e T y p e P i e z o m e t e r0.61 m T P
-
Thermistor-Piezometer P r o b e :Anchored PIPE1
P-
T h e r m i s t o r - P i e z o m e t e r Probe :Floating5
-
S p i r a l Foot Settlement G a u g ei
SR-
S e t t l e m e n t Rod 0.911 +1
I I 0.91m7
1.52m 9 , I , . I;
ps+-
- 0.91m1
0-0-0-0 I I I I1 . 2 2 m I I 1.06mSRI 0 . 9 1 m
f
1sII 0 1. IS$ 1cP4'lp6
~ K ~ ~~O C P TI ~ ~ ~-
%
0.61 m
PlPE
FIGURE 1 Plan of instrumentation around buried pipe.
table elevation was defined with 5 of 6 Casagrande tips be- ing in good agreement with the directly measured elevations in the trench.
Elevation control was maintained on the Casagrande tips during the period of severe ground movement by measuring from a predetermined elevation to the water table with a standard electrical probe.
During the initial stages of the test, the ice layer close to the bottom of the pipe melted and most of the support cribbing at the north end of the oil flow lines had to be re- moved. A flexible hose connection was installed in the 15-cm supply line to ensure that it would not be overstressed and that settlement would not be impeded at this end of the buried section.
FOUNDATION AND PlPE PERFORMANCE Pore Pressure
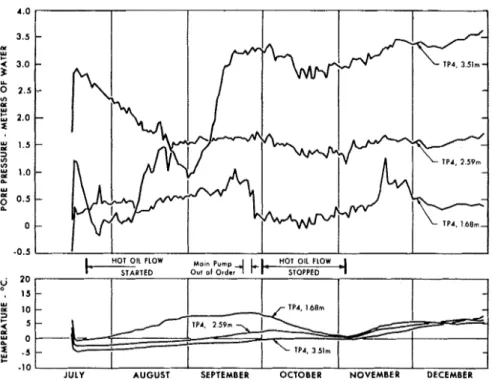
Pore water pressures within the thaw bulb were measured to determine if excess pore pressures existed during thawing. It was also hoped to trace the path of the melt water as it flowed from the thaw front. The anchored piezometer probes pro- vided the most useful data for pore pressure analysis, as both the distance between piezometers on a probe and their eleva- tions were known at all times. Hydraulic gradients, reflecting the amount of excess pore pressure and, therefore, the extent of the loss of the frictional component of the soil strength can be readily calculated from probe readings.
762 SESSION V l l : PRINCIPLES O F CONSTRUCTION I N PERMAFROST REGIONS
Over 90 percent of the piezometers appeared to function ~ a ~ i s f a c t o r i l y . The deeper ones indicated an increase in pore pressure during the initial freezeback period immediately after installation. This increase was probably the result of pressures generated by the volume expansion of freezing water. In some cases these pressures were large as evidenced by values obtained from one tip that were greater than the capacity of the readout equipment (21 m of water). After initial freezeback and before thawing, the high pressures dis- sipated, and in most cases negative pore pressures were recorded. These negative pressures were possibly due t o the lensing action and associated contraction in the ice-rich silty clay as the soil was gradually restored to equilibrium condi- tions.
As the thaw front advanced toward each piezometer unit, a rapid rise in pore pressure was recorded. The maximum readings for each o f the tips in the anchored probes are shown on Table 11. The maximum pressures occurred at dif- ferent times, and every functioning tip recorded a pressure in excess o f the hydrostatic head.
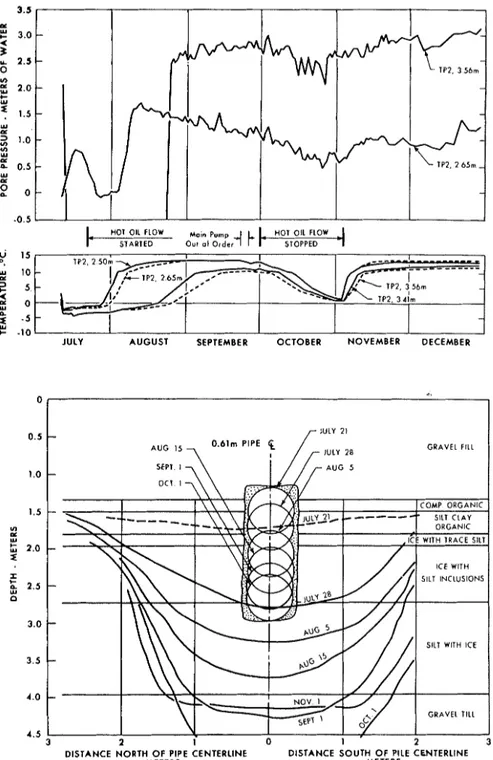
In near-surface areas and close t o the trench, pore pres- sures dissipated rapidly. At depth they were sustained for much longer, and in some cases n o dissipation was observed during the test (Figures 2 and 3).
The excess pore pressures developed during the test did not approach the value of the total overburden pressure, so that a significant effective stress was always present within the thaw plug in spite of the existence of hydraulic gradients.
A large portion of the overburden pressure came from the gravel pad that extended above the water table.
FIGURE 2 Pore pressure and temperature readings (TP 4).
TABLE II Date and Magnitude of Maximum Pore Pressures
Initial Maximum Approximate Maxi-
Depth of Pore Pres- mum Excess Pore Date of Maxi- Unit sure (m of Pressure (m of mum Pore
Probe (m) water) water) Pressure
a 3 Oct. 20 Nov. 12 Aug. 20 Nov. 5 Aug. 5 Sept 10 Sept. 19 Nov. 28 Sept. 23 Nov. a Not functioning.
The pore pressure results revealed two general trends: First, the maximum value recorded by each piezometer indi. cated an excess of hydrostatic pressure. Second, for each of the multiple piezometer strings, the excess pore pressures al- ways increased with depth, showing that hydraulic gradients existed by which water was moved away from the thaw front.
Although it is difficult t o establish a flow net for condi- tions within the thaw plug, measured pressures indicate that the water released by thawing flowed upward toward the trench.
HOT OIL FLOW
20 Out o l O r d e r 4 STOPPED
4
15
.I0 I I I I I 1 I
Watson et al.: Performance of a Warm-Oil Pipeline Buried in Permafrost 763 u I S O. u8 10 -
2
5. - 2 ul 0 - n -FIGURE 3 Pore pressure and temperature s - 5
-
Y
I- - 1 0
readings (TP 2) JULY AUGUST SEPTEMBER OCTOBER NOVEMBER DECEMBER
FIGURE 4 Position of O ° C isotherm during the test.
0.61m PlPE 5
,
LJ:::y2:8
GRAVEL F l l lI
Temperature
To monitor the location and rate of movement of the thaw front, temperatures were recorded at 46 points around the buried pipe (Figure 4). The thaw rate was found to be more rapid than had been predicted by a thermal simulator, as pipe settlement had not been incorporated in the simulator program.
Initially, the thaw front advanced rapidly both down- ward and to either side of the pipe, but the rate slowed down
DISTANCE NORTH O F PIPE CENTERLINE DISTANCE SOUTH O F PILE CENTERLINE
- METERS METERS
with increasing distance between the pipe and the 0 "C iso-
therm. In the early stages of the test, the thawed zone assumed the shape of a shallow bowl, but as the pipe (heat source) settled, the thaw front advanced more rapidly down- ward than horizontally, and the shape of the thawed zone became that of a deep bowl.
The vertical distance from the bottom of the pipe to the 0 "C isotherm followed the square-root-of-time law defined
as follows:
764 SESSION V I I : PRINCIPLES O F CONSTRUCTION I N PERMAFROST REGIONS
where x = the vertical distance from the bottom of the pipe to the 0 "C isotherm in metres;
/3
= a constant in m h s ; and t = time in h.The value of
/3
determined from the field test was 0.046 m h%. Computing the constant /3 from Stefan's equation gives a value of 0.057 m h % . This result indicates that, even though the pipe settled more than 1.3 m, the square-root-of-time law can be used to predict the location of the thaw front beneath it.Settlement
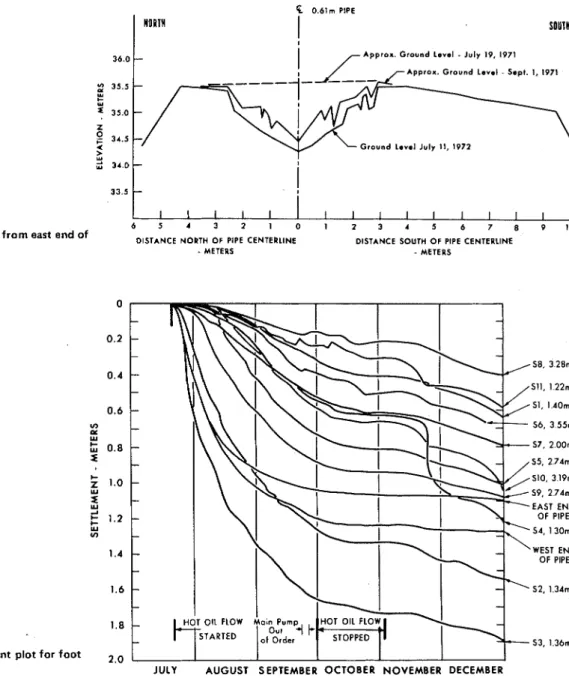
Figure 5 shows surface profiles across the centre of the buried section on 19 July 1971 (before the test), 1 September 1971
(immediately after the thaw front below the pipe passed out of the ice-rich permafrost layers), and 11 July 1972 (after the test was completed). Almost all the settlement resulted from the thawing of the upper ice-rich, permafrost layers. The till was dense and settled very little on thawing. When the thaw front first penetrated the till, the maximum settlement of the ground surface (and the pipe) was approximately 0.98 m or 8 0 percent of the total settlement during the test.
Settlement was measured at 11 points at various depths within the foundation (Figure 6). Elevations were taken from the tops of steel rods with spiral foot gages attached to their bases. This method works well when foundation movement takes place parallel to the axis of the rod. Thawing around the pipe resulted in two-dimensional movement. In addition
P 0.61rn PlPE
!
sown36.0
-
Approx. Ground Lerel - July 19, I971Approa. Ground Lerel - Sept. 1. I971
Ground Lerel July 11, 1972
i 3 4 0 -
33.5
-
I I I I I l l I l l I I I I I
6 5 4 3 2 1 0 1 2 3 4 5 6 7 8 9 1 0
FIGURE 5 Surface profile 14 mfromeast end of
DISTANCE NORTH OF PIPE CENTERLINE DISTANCE SOUTH OF PIPE CENTERLINE
test section. - METERS - METERS
F I G U R E 6 Time gages and pipe.
versus settlement plot for foot
S8. 3 28m Sll, 1.22m S1, I.AOm 56, 3 5 5 m 57, 2.00m S5. 2 7Am 510, 3 19m S9. 2 7Am EAST E N D OF PlPE SA. 1 3 0 m WEST E N D OF PlPE 52, 1.34111 53, 1.36111
Watson et al.: Performance of a Warm-Oil Pipeline Buried in Permafrost 765
to moving downward, the thawed material tended t o slough inward toward the pipe, causing the adjacent settlement rods t o bow.
As elevation readings were taken from the tops of t h e bowed rods, settlement values were from 0.09 to 0.21 m t o o high. Corrections t o these values were incorporated in the analysis of the pipe performance.
Three groups of gages were installed t o determine settle- ment within the different layers of ice-rich permafrost as it thawed. The gages in each group were located at the same distance from the pipe centreline but at different elevations. Although the amount of rod bowing was slightly different for each group, it was practically the same for the individual gages within each group. Consequently, the error introduced by bowing was essentially eliminated when the difference in
Approximately 8 0 percent of the settlement between any two gages had occurred by the time the thaw front reached the bottom gage, and most of the remaining 2 0 percent took place within the next 2 weeks.
Elevation measurements were taken on the steel rods attached to the pipe t o monitor its settlement. As these rods were protected from bending by a 30-cm sleeve, pipe settle- ment was determined accurately.
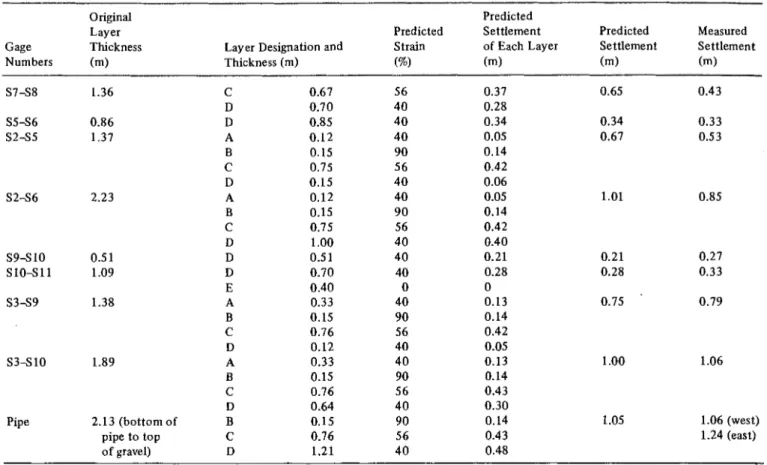
Measured and predicted settlement 1. alues are presented
in Table 111. The predicted values are based on laboratory thaw-settlement tests and the soil profile determined from the borings used for instrument installation. The frozen bulk density versus thaw settlement relationship used t o predict these values is presented e l ~ e w h e r e . ~
settlement between gages in the same group were calculated.
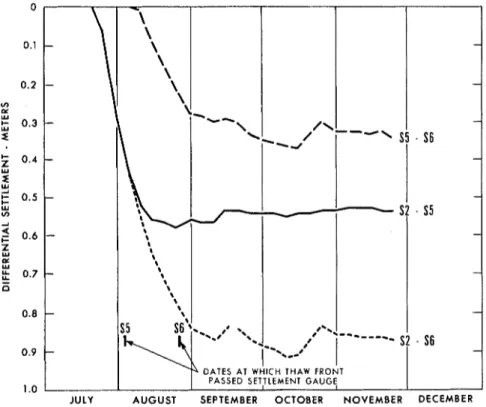
Figure 7 shows the settlement-difference plots for one group, CONCLUSIONS
including the date at which the thaw front passed each gage 1. During thawing of the foundation, excess pore pres- foot. The group consisted of gages S 2 , S 5 , and S 6 , which
were located 1 m away from the pipe centreline. Originally, S2 was located at an elevation of 34.21 m , S5 at 32.84 m , and S 6 at 3 1.98 m.
S 2 began t o settle shortly after the warm oil started cir- culating. The curves for S2-S5 and S2-S6 are identical until approximately 5 August when the thaw front passed S5. The S2-S5 curve then started to level off and became almost horizontal in about 2 weeks. The S2-S6 and S5-S6 curves also started t o level off after the thaw front passed the lower gage, and became horizontal after 2 weeks.
sures were recorded. In the upper layers, t w o of three pi- ezometers indicated that the pore pressures dissipated rapidly. At greater depths, pore pressure rose to a maximum value and remained nearly constant during the testing period. Although the values of excess pore pressures are small, a hydraulic gradient was developed at depth. This factor should be considered in slope-stability calculations.
2 . Comparison of computed and measured locations of the thaw front indicate that the square-root-of-time law can be used to predict the thaw front location beneath the pipe. 3. Settlement measurements show variability over short
766 SESSION V I I : PRINCIPLES O F CONSTRUCTION I N PERMAFROST REGIONS
TABLE Ill Differential Settlement Summary
Original Predicted
Layer Predicted Settlement Predicted Measured
Gage Thickness Layer Designation and Strain of Each Layer Settlement Settlement
Numbers (m) Thickness (m) (%I (m) (m) (m)
S 7 S 8 S 5 S 6 S 2 S 5 S 2 S 6 S 9 S 1 0 S l O S l l S 3 S 9 S 3 S 1 0 Pipe 1.36 0.86 1.37 2.23 0.5 1 1.09 1.38 1.89 2.13 (bottom of pipe to top of gravel) 1.06 (west) 1.24 (east)
distances. However, the amount of settlement was predicted within practical accuracy by using average values obtained from laboratory thaw-settlement tests.
4. Settlement followed thawing closely and continued after the 0 "C isotherm had passed. This could indicate a high initial permeability after thawing, which decreased sub- stantially with time.
5. The conditions that promoted thawing were accelerated in terms of the proposed pipeline conditions. For the test section, oil was circulated at 71 O C from the start of the test,
whereas for the pipeline a buildup from 38 to 60 O C in 5 years
is proposed. Under full-scale operation, the slower heat buildup would result in lower pore pressures and slower settlement rates.
ACKNOWLEDGMENTS
The authors are grateful for the interest and assistance of their col- leagues throughout the project, particularly L. W. Gold, T. L. Speer, and W. Miller.
This paper is a joint contribution of Mackenzie Valley Pipe Line Research Limited and the Division of Building Research, National Research Council of Canada and is published with the approval of the Research Coordinator of Mackenzie Valley Pipe Line Research Limited and the Director of the Division of Building Research.
REFERENCES
1. Bozozuk, M., G. H. Johnston, and 1.1. Hamilton. 1963. Deep benchmarks in clay and permafrost areas. Field testing of soils. ASTM Spec. Tech. Publ. No. 322. p. 265-275.
2. Gupta, R. C., R. G. Marshall, and D. Badke. 1972. Instrumenta- tion of dykes on permafrost-Kettle generating station. 25th Can. Geotech. Conf.
3. Johnston, G. H. 1965. Permafrost studies at Kelsey hydroelectric generating station-Research and instrumentation. NRC Div. Bldg. Res. Tech. Paper No. 178. 35 p.
4. Morgenstern, N. R., and J. F. Nixon. 1972. Onedimensional con- solidation of thawing soils. Can. Geotech. J.8(4).
5. Rowley, R. K., G. H. Watson, R. G. Auld, and T. M. Wilson. 1972. Permafrost of a 48-inch warm-oil pipeline supported on permafrost. 25th Can. Geotech. Conf.
6. Slusarchuk, W. A., G. H. Watson, and T. L. Speer. 1972. Instrumen- tation around a warm-oil pipeline buried in permafrost. 25th Can. Geotech. Conf.
7. Watson, G. H., R. K. Rowley, and W. A. Slusarchuk. Determination of some frozen and thawed properties of permafrost soils. (In preparation)
NOTES
[ l ] On loan from Acres Consulting Services, Calgary, Alberta, Canada. [2] On loan from Standard Oil of California.