ORIGINAL ARTICLE
N-terminal pro-B-type natriuretic peptide and functional
capacity in patients with obstructive sleep apnea
Micha T. Maeder&Peter Ammann&Hans Rickli&
Otto D. Schoch&Wolfgang Korte&Christoph Hürny&
Jonathan Myers&Thomas Münzer
Published online: 29 September 2007
# Springer-Verlag 2007
Abstract The obstructive sleep apnea syndrome (OSAS) is associated with cardiovascular abnormalities including left ventricular hypertrophy, left ventricular diastolic dysfunc-tion, and endothelial dysfunction. The present study evaluated whether N-terminal pro-B-type natriuretic peptide (NT-proBNP) and peak oxygen consumption (peak VO2), both integral markers of cardiovascular function, are related to OSAS severity. In addition, we tested whether NT-proBNP levels depend on body composition in OSAS patients, similar to what has been reported in patients without OSAS. Eighty-nine patients with untreated OSAS underwent NT-proBNP measurement, dual X-ray
absorpti-ometry, and cardiopulmonary exercise testing. In a repre-sentative subgroup (n=32), transthoracic echocardiography was performed. The severity of OSAS was classified based on apnea–hypopnea index (AHI) values as mild (AHI 5–15 h−1), moderate (AHI 15–30 h−1), and severe (AHI >30 h−1). OSAS was mild in 19 (21%), moderate in 21 (24%), and severe in 49 (55%) patients. NT-proBNP levels did not differ among patients with mild [30 (10–57)], moderate [37 (14–55)], and severe [24 (13–49) pg/ml; p= 0.8] OSAS and were not related to body mass index (r= 0.07; p=0.5), percent lean body mass (r=−0.17; p=0.1), and percent fat mass (r=0.18; p=0.1). Percent predicted peak VO2was on average normal and did not differ among patients with mild (115 ±26), moderate (112±23), and severe OSAS (106±29%; p=0.4). Body weight-indexed peak VO2did not differ among patients with mild (31.9± 10.3), moderate (32.1±7.9), and severe OSAS (30.0 ± 9.9 ml kg−1 min−1; p=0.6) either. Lower NT-proBNP (β=−0.2; p=0.02) was independently but weakly associated with higher body weight-indexed peak VO2. In the echocardiography subgroup, NT-proBNP was not signifi-cantly related to left ventricular mass index (r=0.26; p= 0.2). In conclusion, NT-proBNP and peak VO2 are not related to OSAS severity, and NT-proBNP poorly reflects left ventricular hypertrophy in OSAS. The lack of a relationship between NT-proBNP and OSAS severity is not due to a significant influence of body composition on proBNP. There is an association between higher NT-proBNP and lower peak VO2, indicating that NT-proBNP is a marker of cardiorespiratory fitness in patients with OSAS. However, the association is too weak to be clinically useful. Keywords Obstructive sleep apnea . Natriuretic peptides . Body mass index . Exercise capacity .
Left ventricular hypertrophy
M. T. Maeder
:
P. Ammann:
H. Rickli Division of Cardiology, Kantonsspital, St. Gallen, SwitzerlandO. D. Schoch
Multidisciplinary Sleep Center and Division of Pulmonary Medicine, Kantonsspital,
St. Gallen, Switzerland W. Korte
Institute for Clinical Chemistry and Hematology, Kantonsspital, St. Gallen, Switzerland
C. Hürny
:
T. MünzerCenter of Geriatric Medicine and Rehabilitation, Bürgerspital, St. Gallen, Switzerland
J. Myers
Cardiology Division, Palo Alto Veterans Affairs Medical Center, Stanford University,
Palo Alto, CA, USA M. T. Maeder (*)
Division of Cardiology, University Hospital, Petersgraben 4,
4031 Basel, Switzerland
Introduction
The obstructive sleep apnea syndrome (OSAS) is associated with various cardiovascular abnormalities, including in-creased sympathetic nerve activity [1], subclinical athero-sclerosis [2], endothelial dysfunction [3], left ventricular hypertrophy [4,5], and left ventricular diastolic dysfunction [4, 6, 7]. There is an association between OSAS and hypertension [8], and OSAS has also been recognized as a risk factor for the development and progression of heart failure [9]. These cardiovascular abnormalities appear to depend on the severity of OSAS [5,7,8,10], and many of them are attenuated or reversed after treatment with continuous positive airway pressure ventilation [2,3,6,11]. B-type natriuretic peptide (BNP) and the N-terminal fragment of its precursor peptide (N-terminal pro-B-type natriuretic peptide; NT-proBNP) are markers of cardiomyocyte stretch and, thereby, cardiac dysfunction. There is an associ-ation between BNP and/or NT-proBNP and left ventricular hypertrophy [12, 13], left ventricular diastolic dysfunction [14, 15], and impaired functional capacity [16–18]. Thus, BNP and NT-proBNP might be suitable biomarkers to detect subclinical cardiovascular stress induced by OSAS, and given the relationship between OSAS severity and cardiac dysfunc-tion [5,7,10], BNP and NT-proBNP might be related to the presence and severity of OSAS. However, previous studies failed to identify such an association [19–22]. All these studies, however, were either comparatively small or had other limitations, including a long time interval between sleep study and hormone measurement [19] and the use of BNP instead of NT-proBNP [19,20], the former having a much shorter half-life (20 min) than NT-proBNP (several hours) [23, 24]. Furthermore, apart from testing the association between BNP/NT-proBNP and the presence and severity of OSAS, no attempts have been made to establish the relationship between circulating BNP or NT-proBNP levels and cardiovascular abnormalities in OSAS. In particular, it is unknown whether BNP and NT-proBNP levels are related to exercise capacity, similar to what had been reported in subjects with heart failure [17,18]. In patients not limited by pulmonary disease or musculoskeletal problems, exercise capacity is an integral measure of cardiovascular perfor-mance. Interestingly, data on exercise testing in patients with OSAS but without overt cardiovascular disease are quite sparse [25–27].
Assuming more severe cardiovascular dysfunction and thus increased myocyte stretch at rest and impaired cardiac output during exercise in patients with more severe OSAS, we hypothesized that NT-proBNP levels and peak oxygen consumption (peak VO2) depend on disease severity expressed as the apnea–hypopnea index (AHI) in a native OSAS population without obvious cardiac disease. Further-more, we hypothesized that NT-proBNP and peak VO2
would also be related in OSAS patients. Finally, as a previous study revealed a relationship between NT-proBNP and body mass index and body composition [28], we evaluated whether this also applies for OSAS patients and thereby might influence the relationship between NT-proBNP levels, measures of OSAS severity, and cardiovas-cular performance.
Materials and methods Patients and protocol
We studied 96 outpatients with a new diagnosis of OSAS established by polysomnography. Only patients with a normal electrocardiogram (sinus rhythm, absence of signif-icant Q waves, or left-bundle-branch-block) were eligible. Patients with a history of heart failure, significant pulmo-nary disease, anemia, peripheral arterial occlusive disease, or other conditions limiting exercise capacity were excluded. All patients underwent measurement of NT-proBNP and serum creatinine, cardiopulmonary exercise testing with gas exchange techniques, and dual X-ray absorptiometry. Due to the relationship between NT-proBNP and renal function [29], patients with an estimated glomerular filtration rate [30] <30 ml/min/1.73 m2were not included in the analysis. In the last 32 consecutive patients included in the study, an echocardiogram was also performed to verify that only patients with preserved left ventricular systolic function were studied as attempted by the inclusion criteria and to test the association between NT-proBNP and left ventricular hyper-trophy and measures of left ventricular diastolic dysfunction. All examinations were performed within 1 to 3 days before institution of continuous positive airway pressure ventilation. The study was performed in accordance with the ethical standards laid down in the 1964 Declaration of Helsinki. Participants gave written informed consent, and the local ethics committee approved the study protocol.
Polysomnography
Fully supervised polysomnography was performed in all patients using a commercially available monitoring system (Mepal, MAP Medizin-Technologie, Martinsried, Germany). Minimum time spent in the laboratory was 6 h. Sleep was measured with the three standard electroencephalographic channels. Electromyographic signals were collected for eye movements, chin activity, and leg movements. Respiration was traced with thoracic and abdominal piezoelectric bands, and air flow was measured with nasal pressure prongs. All studies were analyzed by an experienced sleep technologist supervised by a physician specialized in sleep medicine. Apnea was defined as complete (>80%) reduction in the
flow signal (assessed via nasal pressure prongs) lasting for ≥10 s, and hypopnea was defined as >50% reduction in the airflow signal lasting for≥10 s accompanied by a decrease in oxygen saturation >3% or an arousal. The AHI was defined as the number of episodes of apnea and hypopnea per hour of sleep monitored. The diagnosis of OSAS was based on symptoms of daytime sleepiness (according to the Epworth sleepiness scale [31]) and an AHI≥5 h−1[32]. The severity of OSAS was classified based on AHI values as mild (AHI 5–15 h−1), moderate (AHI 16–30 h−1), and severe (AHI >30 h−1). As additional measures of the severity of OSAS, arousal index and desaturation index were assessed. Assessment of body composition
Weight was measured to the nearest 0.1 kg on a calibrated scale, and height was determined using a wall-mounted stadiometer. Body mass index was calculated as weight (in kg) divided by height to the power of two, and body surface area was calculated using the Mosteller formula [33]. Lean body mass was determined by dual X-ray absorptiometry [34] using a commercially available scanner (Lunar DPX-NT, Lunar, General Electrics Healthcare, Munich, Germany). We used the scanner-installed software package (Encore Version 6.7). The subjects were measured in light clothing. The scanner was calibrated every morning, and three times a week, a bone phantom scan was used to determine scan quality. Laboratory analysis
After an overnight fast, serum samples were collected at 7:00 A.M. into EDTA tubes and stored at −70°C for later
analysis. NT-proBNP was measured in 2006 using a commercially available highly sensitive and specific im-munoassay based on double antibody sandwich technique (Elecsys proBNP, Roche Diagnostics, Basel, Switzerland) [35,36]. The technicians involved in NT-proBNP analysis were blinded to clinical data.
Cardiopulmonary exercise testing
Participants underwent cardiopulmonary exercise testing on a treadmill ergometer (CS-200, Schiller, Baar, Switzerland). All tests were performed between 3:00 and 7:00P.M.under
regular medication. Before the test, the tightness of the facemask was adjusted manually to avoid leakage. To allow familiarization with the test mode, the protocol started with a warm-up period of 6 min of constant work load (speed 1.6 km/h, inclination 6%), followed by an individualized ramp protocol, which was selected according to the patient’s subjective estimate of physical fitness from a set of 12 ramp protocols for exercise capacities ranging from 4 to 17 metabolic equivalents (as estimated from speed and
grade of the treadmill) to achieve a test duration of approximately 10 min (ramp portion of the test) [37]. During the tests, subjects were verbally encouraged to exercise until exhaustion. A 12-lead electrocardiogram was recorded continuously, and blood pressure (by indirect arm-cuff sphygmomanometry) was assessed every 2 min. Expired gases were acquired continuously, and oxygen consumption and carbon dioxide output (VCO2) were recorded in rolling 30-s averages (ErgoScope, Ganshorn, Niederlauer, Germany). Calibration of the system was performed before each test.
Functional capacity was expressed as peak VO2 (abso-lute, percent predicted from age, gender, and height [38], and indexed to body weight). For each test, the relation between minute ventilation (VE) and VCO2was plotted to determine the VE/VCO2 slope. All data points from the beginning to the end of exercise were included to determine the VE/VCO2slope [39]. To ensure appropriate effort, only subjects achieving a respiratory exchange ratio (i.e., VCO2 divided by oxygen consumption) ≥1.0 at peak exercise were included in the analysis.
Echocardiography
Echocardiographic studies (Toshiba Powervision 8000, Osaka, Japan) were performed by one single operator using standard techniques [40]. Measures of left ventricular and left atrial dimensions were obtained in the parasternal long axis view. Left ventricular mass was calculated based on an anatomically validated formula [41]. All measurements were indexed to body surface area. Left ventricular hypertrophy was defined as a left ventricular muscle mass index (LVMI) >125 g/m2in men and >110 g/m2in women, which is the definition employed in a previous study showing a relationship between BNP and left ventricular mass index in patients with hypertension [13] to allow comparison with that study. Left ventricular ejection fraction (LVEF) was determined from the apical view by biplane calculation or visual estimation in case of a poor acoustic window. The pulse-wave Doppler sample was placed at the tips of mitral valve leaflets in the apical four-chamber view, and the ratio of the peak flow velocity in early diastole and the peak flow velocity at atrial contrac-tion (E/A ratio) and deceleracontrac-tion time were determined. Statistical analysis
Statistical analysis was performed using a commercially available software package (SPSS, Version 10.1, Chicago, IL, USA). Categorical data were expressed as numbers and percentages. Continuous data were expressed as the mean ± SD or the median (interquartile range) where appropriate. The chi-square test was used to compare categorical data.
For comparison of continuous data, the unpaired t test or the Mann–Whitney U test was used as appropriate. For comparison of several groups, the chi-square test, analysis of variance (ANOVA), or the Kruskal–Wallis test was applied. Pearson’s or Spearman’s rank correlation coeffi-cients were calculated to identify associations between parameters of interest.
Multiple linear regression analysis was performed to identify pretest predictors of peak VO2. For variables with a skewed distribution, ln-transformed values were employed. Variables with ap value <0.1 at the univariate analysis were included in the multivariate model (forward stepwise technique). A receiver operator characteristics (ROC) curve was constructed for the ability of NT-proBNP to predict a peak VO2<20 ml kg−1min−1, a widely used cut-off for an impaired exercise capacity [42], and the area under the
ROC curve was determined. A p value <0.05 was considered statistically significant.
Results Patients
Of 96 patients undergoing cardiopulmonary exercise testing, seven were excluded because of a respiratory exchange ratio <1.0, leaving 89 patients for the present analysis. Patient characteristics are shown in Table1.
OSAS was mild in 19 (21%), moderate in 21 (24%), and severe in 49 (55%) patients. Patients with severe OSAS were more likely to be male and had higher absolute lean body mass than those with mild and moderate OSAS. Body
Table 1 Patient characteristics
All AHI 5–15 h−1 AHI 15–30 h−1 AHI >30 h−1 p value
Number 89 19 21 49 Age (years) 49.5±9.7 48.4±9.1 47.6±8.4 50.1±10.5 0.4 Gender (female) 11 (12%) 6 (32%)** 4 (19%)*** 2 (4%)**,*** 0.002 Body composition Height (cm) 173±8 171±8 173±7 175±8 0.1 Weight (kg) 91±14 85±12** 87±10 94±15** 0.02 Body mass index (kg/m2) 30.2±4.6 29.4±5.1 29.3±4.1 30.9±4.5 0.3 Lean body mass (kg) 55.6 (51.6–60.6) 53.0 (47.0–55.2)** 53.7 (50.7–58.9)*** 58.5 (54.7–63.1)**,*** <0.001
Lean body mass (%) 65 (59–68) 64 (56–68) 65 (58–68) 64 (60–68) 0.8 Fat mass (kg) 27.9 (23.5–35.6) 25.7 (23.1–33.3) 25.9 (22.7–34.0) 29.1 (24.3–36.2) 0.6 Fat mass (%) 33 (29–39) 33 (29–41) 32 (30–40) 34 (29–39) 0.8 Cardiovascular risk factors
Hypertension 56 (63%) 11 (58%) 8 (38%)*** 37 (76%)*** 0.01 Hypercholesterolemia 73 (82%) 13 (68%) 18 (86%) 42 (86%) 0.2 Diabetes 9 (10%) 1 (5%) 1 (5%) 7 (14%) 0.4 Smoking 52 (58%) 10 (53%) 12 (57%) 30 (61%) 0.9 Medication ACEI or ARB 19 (21%) 2 (11%) 2 (10%) 15 (31%) 0.06 β-blockers 11 (12%) 3 (16%) 2 (10%) 6 (12%) 0.8 Diuretics 15 (17%) 2 (11%) 2 (10%) 11 (22%) 0.3 Calcium channel blockers 9 (10%) 0 2 (10%) 7 (14%) 0.2
Aspirin 8 (9%) 1 (5%) 1 (5%) 6 (12%) 0.5
Statin 15 (17%) 1 (5%) 2 (10%) 11 (22%) 0.2 OSAS severity
Epworth sleepiness score 13 (9–15) 14 (9–17) 13 (10–15) 11 (9–15) 0.4 AHI (h−1) 34 (17–53) 11 (8–12)*,** 25 (18–27)*,*** 52 (38–74)**,*** <0.001 Arousal index (h−1) 44 (28–63) 23 (17–35)** 34 (28–41)*** 60 (46–80)**,*** <0.001 Desaturation index (h−1) 15 (7–37) 5 (3–7)*,** 10 (6–15)*,*** 36 (21–48)**,*** <0.001 GFR (ml/min/1.73 m2) 92.9±14.1 92.0±8.6 96.3±15.5 91.7±15.2 0.5 Thep values are given for the results of ANOVA, chi-square, or Kruskal–Wallis test, respectively.
AHI Apnea–hypopnea index, ACEI angiotensin-converting-enzyme inhibitors, ARB angiotensin-receptor blockers, OSAS obstructive sleep apnea syndrome,GFR glomerular filtration rate
*p<0.05 for AHI 5–15 vs AHI 15–30 h−1 (results of post hoc testing) **p<0.05 for AHI 5–15 vs AHI >30 h−1 (results of post hoc testing) ***p<0.05 for AHI 15–30 vs AHI >30 h−1 (results of post hoc testing)
weight was higher in patients with severe than those with mild OSAS. Patients with severe OSAS were more likely to have hypertension as compared to patients with moderate OSAS. As expected, the groups differed with respect to objective measures of OSAS severity. However, they were similar with respect to the Epworth sleepiness scale and other characteristics.
NT-proBNP and OSAS severity
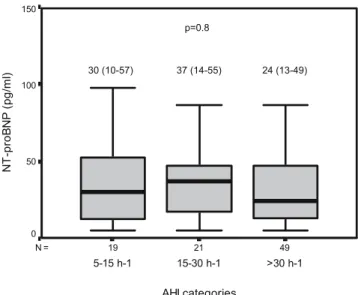
The median proBNP value was 24 (13–49) pg/ml. NT-proBNP values did not differ across different AHI categories (p=0.8) as shown in Fig. 1. There was no significant relationship between NT-proBNP and Epworth sleepiness score (r=0.17; p=0.1), arousal index (r=0.03; p=0.7), or desaturation index (r=−0.05; p=0.7).
As there were significant gender differences across the AHI categories, analysis was repeated after exclusion of the 11 female subjects. However, NT-proBNP values did not differ among men with mild [18 (8–38) pg/ml], moderate [23 (14–52) pg/ml], and severe [24 (13–49) pg/ml] OSAS (p=0.57).
NT-proBNP and body composition
NT-proBNP was not related to body mass index (r=0.07; p=0.5) nor absolute (r=−0.13; p=0.2) or percent lean body mass (r=−0.17; p=0.1) nor total (r=0.14; p=0.2) or percent fat mass (r=0.18; p=0.1).
Functional capacity and OSAS severity
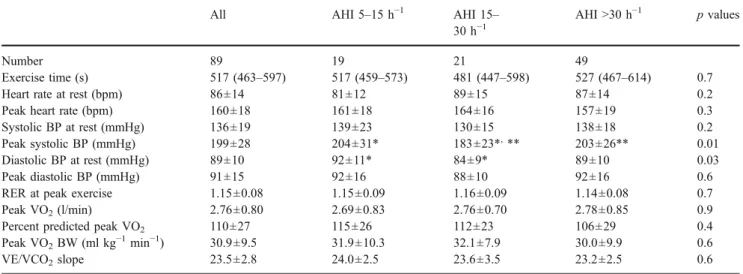
Data from cardiopulmonary exercise testing are shown in Table2. No patients showed an ischemic response. Patients
with mild OSAS had higher diastolic blood pressure at rest as compared to patients with moderate OSAS, and patients with moderate OSAS had lower systolic blood pressure at peak exercise as compared to the other two AHI groups. However, peak heart rate, absolute peak VO2, percent predicted peak VO2, and peak VO2 indexed for body weight did not differ across the AHI categories. Among the whole study population, 11 (12%) patients had a peak VO2 <20 ml kg−1 min−1. Values for the VE/VCO2 slope were generally very low and did not differ across the AHI categories.
If the 11 female subjects were excluded from the analysis, absolute (p=0.41) and percent predicted (p= 0.31) peak VO2 did not differ among men with mild, moderate, and severe OSAS either. Percent predicted peak VO2was on average normal in men with mild (116±26%), moderate (111± 19%), and severe (105 ± 28%) OSAS. ANOVA revealed lower body weight-indexed peak VO2 in men with more severe OSAS (p=0.02), but body mass index was higher in more severe OSAS (p=0.02). Further analysis by post hoc testing (Bonferroni) revealed only borderline differences with respect to body weight-indexed peak VO2 (p=0.055) and body mass index (p=0.062) in subjects with AHI between 5 and 15 h−1 and those with AHI >30 h−1. Otherwise, no differences were obtained. Exercise capacity and NT-proBNP
There was a moderate correlation between ln NT-proBNP and peak VO2(Fig.2). In the univariate analysis, peak VO2 was also associated with age (r=−0.42; p<0.001), gender (r=−0.32; p=0.02), body mass index (r=−0.50; p<0.001), resting heart rate (r=−0.30; p=0.004), ln arousal index (r= 0.25; p=0.02), and ln desaturation index (r=−0.23; p= 0.03). There was no significant association between peak VO2 and ln AHI (r=−0.15; p=0.17). In the multivariate model, male gender (β=0.23; p=0.008), younger age (β=−0.29; p=0.001), lower body mass index (β=−0.35; p<0.001), lower resting heart rate (β=−0.24; p=0.004), and lower NT-proBNP (β=−0.2; p=0.02) were indepen-dently associated with higher peak VO2. However, the area under the ROC curve for the ability of NT-proBNP to predict a peak VO2<20 ml kg−1min−1was only 0.55 (p= 0.6). An optimal NT-proBNP cut-off of 24 pg/ml had sensitivity of 73% and a specificity of 50% for the prediction of a peak VO2<20 ml kg−1min−1.
Left ventricular mass and function
Patients undergoing echocardiography (n=32) and patients not doing so (n=57) were similar with respect to age (49.1±8.4 vs 49.8±10.5 years; p=0.7), body mass index (29.4±5.7 vs 30.6±3.8 kg/m2;p=0.2), AHI [32 (16–57) vs 37 (24–52) h−1; 49 21 19 N = AHI categories >30 h-1 15-30 h-1 5-15 h-1 N T -p ro B N P (p g/ ml ) 150 100 50 0 30 (10-57) 37 (14-55) 24 (13-49) p=0.8
Fig. 1 Boxplots showing NT-proBNP values in different AHI categories.Boxes indicate median values and interquartile ranges
p=0.5], and NT-proBNP [25 (14–48) vs 22 (11–61); p=0.70]; thus, the echocardiography subgroup was representative of the entire study population.
Echocardiography findings are presented in Table 3. Four (13%) patients had left ventricular hypertrophy. All patients had an LVEF ≥50%. There was a significant correlation between AHI and left ventricular posterior wall thickness. Otherwise, AHI was not related to any echocar-diographic parameter. NT-proBNP was not significantly related to LVMI. If left ventricular mass was indexed as height to the power of 2.7 instead of body surface, NT-proBNP was similarly not related to LVMI. There was a
trend toward a correlation between NT-proBNP and LVEF (p=0.06).
Discussion
The present study confirms previous findings in that, in OSAS patients, NT-proBNP levels were generally low and not related to disease severity as expressed by AHI. In addition, our findings suggest that this is not due to a significant influence of body composition on NT-proBNP levels. There was a statistically significant but compara-tively weak independent relationship between NT-proBNP and functional capacity.
In previous studies, BNP or NT-proBNP levels measured before [20, 22, 43] or after [20–22, 44] sleep were not found to be elevated in patients with OSAS. Similarly, a recent analysis among 623 patients from the Framingham study did not find an association between AHI and BNP [19]. However, in the latter study, the median time between BNP measurement and polysomnography of 79 (27–280) days is an important limitation given that the half-life of BNP is approximately 20 min [23]. In the present examination, which to the best of our knowledge is the largest and most detailed study on NT-proBNP in OSAS, patients underwent phlebotomy in the morning after polysomnography, and the more stable NT-proBNP (half-life several hours) [24] instead of BNP was measured. Despite this, there was nevertheless no association between subjective measures of daytime sleepiness and objective measures of OSAS severity.
Ln NT-proBNP 7 6 5 4 3 2 1 peak VO2 (ml/kg -1 min -1) 60 50 40 30 20 10 0 r=-0.33; p=0.002 n=89
Fig. 2 Scatter plot showing the relationship between NT-proBNP (ln-transformed values) and peak VO2
Table 2 Cardiopulmonary exercise testing results
All AHI 5–15 h−1 AHI 15– 30 h−1
AHI >30 h−1 p values
Number 89 19 21 49
Exercise time (s) 517 (463–597) 517 (459–573) 481 (447–598) 527 (467–614) 0.7 Heart rate at rest (bpm) 86±14 81±12 89±15 87±14 0.2 Peak heart rate (bpm) 160±18 161±18 164±16 157±19 0.3 Systolic BP at rest (mmHg) 136±19 139±23 130±15 138±18 0.2 Peak systolic BP (mmHg) 199±28 204±31* 183±23*,** 203±26** 0.01 Diastolic BP at rest (mmHg) 89±10 92±11* 84±9* 89±10 0.03 Peak diastolic BP (mmHg) 91±15 92±16 88±10 92±16 0.6 RER at peak exercise 1.15±0.08 1.15±0.09 1.16±0.09 1.14±0.08 0.7 Peak VO2(l/min) 2.76±0.80 2.69±0.83 2.76±0.70 2.78±0.85 0.9
Percent predicted peak VO2 110±27 115±26 112±23 106±29 0.4
Peak VO2BW (ml kg−1min−1) 30.9±9.5 31.9±10.3 32.1±7.9 30.0±9.9 0.6
VE/VCO2slope 23.5±2.8 24.0±2.5 23.6±3.5 23.2±2.5 0.6
Thep values are given for the results of ANOVA and the Kruskal–Wallis test, respectively.
AHI Apnea–hypopnea index, BP blood pressure, peak VO2peak oxygen consumption,peak VO2BW peak VO2indexed for body weight,RER
respiratory exchange ratio,VE/VCO2slope relationship between minute ventilation and carbon dioxide production
*p<0.05 for AHI 5–15 vs AHI 15–30 h−1 (results of post hoc tests) **p<0.05 for AHI 5–15 vs AHI >30 h−1 (results of post hoc tests)
In the Framingham population, the authors concluded that OSAS in their cross-sectional setting was not associ-ated with persistent daytime left ventricular dysfunction as reflected in morning natriuretic peptide levels [19]. Al-though this is a possible explanation for the negative findings, one should also consider the alternative possibility that left ventricular dysfunction and other cardiovascular abnormalitieswere present, but were not reflected by BNP. Natriuretic peptide levels are influenced by many factors other than left ventricular wall stress, and it has not been determined whether BNP and NT-proBNP levels in OSAS patients actually reflect left ventricular wall stress and its echocardiographic surrogates. In patients with hyperten-sion, an association between BNP and LVMI (left ventric-ular mass indexed to body weight) has been reported [13]. However, in the present study, the relationship between NT-proBNP and LVMI did not reach statistical significance, even when left ventricular mass was indexed to height to the power of 2.7 as suggested for obese subjects [45], nor was NT-proBNP related to measures of left ventricular diastolic dysfunction. The only association between NT-proBNP and echocardiographic measures was a trend toward a correlation with LVEF, although LVEF was preserved in all patients. Thus, NT-proBNP clearly did not accurately reflect left ventricular hypertrophy and dysfunc-tion in our study subgroup, which was representative for the whole sample with respect to age, body mass index, AHI, and NT-proBNP.
There is evidence for a relationship between OSAS and congestive heart failure [9], and impaired exercise tolerance is a hallmark of this condition [16]. Peak VO2 is closely related to cardiac output [46], which in turn depends on preload, left ventricular systolic and diastolic function, and
afterload, the latter two factors being abnormal in many OSAS patients according to previous studies [3, 4, 6, 8]. Interestingly, data on exercise capacity in OSAS patients are sparse and conflicting [25–27]. Whereas in the study by Oztürk et al. [25], peak VO2values were similar in OSAS patients and controls; Lin et al. [26] reported lower peak VO2in patients with OSAS as compared to controls. In a retrospective analysis, Guillermo et al. [27] found lower peak VO2 in patients with AHI >20 h−1 as compared to controls, whereas overall peak VO2 did not differ among patients with OSAS and controls. In the present study among OSAS patients without obvious cardiac disease, peak VO2 was overall normal without significant differ-ences across the AHI categories. This indicates that OSAS per se—even if severe—is not necessarily associated with impaired exercise tolerance, and that any cardiovascular abnormalities—if present—must be regarded as subclinical. However, many patients had antihypertensive therapy, and blood pressure values were normal or only moderately elevated in most cases. Results might have been different if blood pressure would have been untreated. Values for the VE/VCO2slope were normal across the AHI groups, which well fits the fact that exercise capacity was normal.
Although untreated severe OSAS is associated with a higher risk of fatal and nonfatal cardiovascular events when compared to healthy people and patients with wild or moderate OSAS [47], and NT-proBNP is a predictor of major cardiovascular events and death [48], peak VO2and NT-proBNP values did not differ among the AHI sub-groups, which is an unexpected finding.
In patients with heart failure, peak VO2has been found to be moderately related to BNP and NT-proBNP [17,18], and it has even been proposed that BNP might be used to
Table 3 Left ventricular structure and function and relationship with AHI and NT-proBNP (n=32)
Echo parameter Echo vs AHI Echo vs NT-proBNP
R p R p
Left ventricular end-diastolic diameter (mm/m2) 23.1±2.9 −0.15 0.4 0.005 1.0
Left ventricular end-systolic diameter (mm/m2) 15.3±2.8 −0.08 0.6 −0.05 0.8 Interventricular septal diameter (mm/m2) 5.8±0.9 −0.2 0.2 0.05 0.8 Left ventricular posterior wall diameter (mm/m2) 4.8±0.8 −0.47 0.007 0.25 0.2 Relative wall thickness 0.42±0.09 −0.26 0.2 0.18 0.3 Left ventricular mass (g) 173 (151–220) 0.002 1.0 0.18 0.3 Left ventricular mass index (g/m2) 85 (77–101) −0.12 0.6 0.26 0.2
Left ventricular mass index (g/m2.7) 42.1 (33.1–50.7) −0.09 0.6 0.17 0.3 Left ventricular ejection fraction (%) 63±5 −0.19 0.3 0.34 0.06 Left atrial size (mm/m2) 17.9±2.3 −0.12 0.5 0.14 0.4 Peak flow velocity in early diastole (E; m/s) 0.66 (0.57–0.76) −0.3 0.1 0.05 0.8 Peak flow velocity at atrial contraction (A; m/s) 0.66 (0.54–0.78) 0.06 0.8 0.25 0.2 E/A ratio 0.91 (0.80–1.28) −0.2 0.3 −0.17 0.4 Deceleration time (ms) 222 (193–259) 0.24 0.2 0.12 0.5 R Spearman’s correlation coefficients between echocardiographic measures and AHI and NT-proBNP, respectively
predict low exercise capacity in these patients [17]. Interestingly, NT-proBNP was also associated with peak VO2 in the present study of OSAS patients without symptoms and signs of heart failure. However, similar to the relationship between peak VO2 and BNP in patients with mild-to-moderate chronic heart failure undergoing treadmill exercise (r=−0.31; p<0.05) [18], this correlation was only moderate (r=0.33), and although interesting from a pathophysiological point of view, it might not be clinically useful.
Several recent studies revealed an inverse relationship between natriuretic peptides and body mass index [28,49, 50], suggesting that cut-points for natriuretic peptides for the diagnosis of acute heart failure [51] and the prediction of prognosis in chronic heart failure [52] should be adjusted for body mass index. We, therefore, considered that low NT-proBNP levels in OSAS patients might be due to frequent coexisting obesity and altered body composition. However, in contrast to a previous publication [28], we did not find an association between NT-proBNP and body mass index and body composition, and thus, lack of a relation-ship between OSAS severity NT-proBNP levels is not due to a significant influence of body composition on NT-proBNP. Limitations
Our study has several limitations. The sample size was small, and there was no control group of similarly obese patients without OSAS. A second limitation was the lack of a more systematic and detailed examination of left ventricular diastolic function. The E/A ratio and decelera-tion time are imperfect measures of left ventricular diastolic function due to their U-shaped relationship with the severity of left ventricular diastolic dysfunction. However, it has been previously observed that most OSAS patients without significant associated cardiac disease have a normal mitral filling pattern or impaired relaxation, and that more advanced left ventricular diastolic dysfunction (i.e., pseudonormal and restrictive patterns) is rare [6]. Given the inclusion criteria, mean deceleration time and atrial size values, this was also likely the case in our population. Accordingly, a lowerE/A ratio and a longer deceleration time might have been acceptable although imperfect parameters for more impaired relaxation.
Conclusions
Circulating levels of NT-proBNP do not reflect OSAS severity as expressed by AHI, and this is not due to a significant influence of body composition on NT-proBNP levels. However, this does not necessarily mean that left ventricular hypertrophy and dysfunction are absent, as
indicated by the poor correlation between NT-proBNP and measures of left ventricular hypertrophy and diastolic dysfunction. A new observation is that that a higher NT-proBNP level is an independent predictor of a lower peak VO2, indicating that NT-proBNP is global marker of cardiopulmonary fitness. However, the association is too weak to be clinically useful.
Acknowledgment The excellent technical assistance by Monika Ott is greatly appreciated. This study was supported by Swiss National Foundation (Grant No. 3200-068115 to T.M., O.D.S., and C.H.).
References
1. Somers VK, Dyken ME, Clary MP, Abboud FM (1995) Sympathetic neural mechanisms in obstructive sleep apnea. J Clin Invest 96:1897–1904
2. Drager LF, Bortolotto LA, Figueiredo AC, Krieger EM, Lorenzi-Filho G (2007) Effects of CPAP on early signs of atherosclerosis in obstructive sleep apnea. Am J Respir Crit Care Med (in press). DOI10.1164/rccm.200703-500Oc
3. Ip MS, Tse HF, Lam B, Tsang KW, Lam WK (2004) Endothelial function in obstructive sleep apnea and response to treatment. Am J Respir Crit Care Med 169:348–353
4. Fung JW, Li TS, Choy DK, Yip GW, Ko FW, Sanderson JE, Hui DS (2002) Severe obstructive sleep apnea is associated with left ventricular diastolic dysfunction. Chest 121:422–429
5. Dursunoglu D, Dursunoglu N, Evrengul H, Ozkurt S, Kuru O, Kilic M, Fisekci F (2005) Impact of obstructive sleep apnoea on left ventricular mass and global function. Eur Respir J 26:283–288 6. Arias MA, Garcia-Rio F, Alonso-Fernandez A, Mediano O, Martinez I, Villamor J (2005) Obstructive sleep apnea syndrome affects left ventricular diastolic function: effects of nasal contin-uous positive airway pressure in men. Circulation 112:375–383 7. Cloward TV, Walker JM, Farney RJ, Anderson JL (2003) Left
ventricular hypertrophy is a common echocardiographic abnor-mality in severe obstructive sleep apnea and reverses with nasal continuous positive airway pressure. Chest 124:594–601 8. Peppard PE, Young T, Palta M, Skatrud J (2000) Prospective
study of the association between sleep-disordered breathing and hypertension. N Engl J Med 342:1378–1384
9. Shahar E, Whitney CW, Redline S, Lee ET, Newman AB, Javier Nieto F, O'Connor GT, Boland LL, Schwartz JE, Samet JM (2001) Sleep-disordered breathing and cardiovascular disease: cross-sectional results of the Sleep Heart Health Study. Am J Respir Crit Care Med 163:19–25
10. Shivalkar B, Van de Heyning C, Kerremans M, Rinkevich D, Verbraecken J, De Backer W, Vrints C (2006) Obstructive sleep apnea syndrome: more insights on structural and functional cardiac alterations, and the effects of treatment with continuous positive airway pressure. J Am Coll Cardiol 47:1433–1439 11. Bazzano LA, Khan Z, Reynolds K, He J (2007) Effect of
nocturnal nasal continuous positive airway pressure on blood pressure in obstructive sleep apnea. Hypertension 50:417–423 12. Vasan RS, Benjamin EJ, Larson MG, Leip EP, Wang TJ, Wilson PW,
Levy D (2002) Plasma natriuretic peptides for community screening for left ventricular hypertrophy and systolic dysfunction: the Framingham heart study. JAMA 288:1252–1259
13. Conen D, Zeller A, Pfisterer M, Martina B (2006) Usefulness of B-type natriuretic peptide and C-reactive protein in predicting the presence or absence of left ventricular hypertrophy in patients with systemic hypertension. Am J Cardiol 97:249–252
14. Krishnaswamy P, Lubien E, Clopton P, Koon J, Kazanegra R, Wanner E, Gardetto N, Garcia A, DeMaria A, Maisel AS (2001) Utility of B-natriuretic peptide levels in identifying patients with left ventricular systolic or diastolic dysfunction. Am J Med 111:274–279
15. Lubien E, DeMaria A, Krishnaswamy P, Clopton P, Koon J, Kazanegra R, Gardetto N, Wanner E, Maisel AS (2002) Utility of B-natriuretic peptide in detecting diastolic dysfunction: compari-son with Doppler velocity recordings. Circulation 105:595–601 16. de Groote P, Dagorn J, Soudan B, Lamblin N, McFadden E,
Bauters C (2004) B-type natriuretic peptide and peak exercise oxygen consumption provide independent information for risk stratification in patients with stable congestive heart failure. J Am Coll Cardiol 43:1584–1589
17. Kruger S, Graf J, Kunz D, Stickel T, Hanrath P, Janssens U (2002) Brain natriuretic peptide levels predict functional capacity in patients with chronic heart failure. J Am Coll Cardiol 40:718–722 18. Rocca HP, Weilenmann D, Follath F, Schlumpf M, Rickli H, Schalcher C, Maly FE, Candinas R, Kiowski W (1999) Oxygen uptake kinetics during low level exercise in patients with heart failure: relation to neurohormones, peak oxygen consumption, and clinical findings. Heart 81:121–127
19. Patwardhan AA, Larson MG, Levy D, Benjamin EJ, Leip EP, Keyes MJ, Wang TJ, Gottlieb DJ, Vasan RS (2006) Obstructive sleep apnea and plasma natriuretic peptide levels in a community-based sample. Sleep 29:1301–1306
20. Svatikova A, Shamsuzzaman AS, Wolk R, Phillips BG, Olson LJ, Somers VK (2004) Plasma brain natriuretic peptide in obstructive sleep apnea. Am J Cardiol 94:529–532
21. Tasci S, Manka R, Scholtyssek S, Lentini S, Troatz C, Stoffel-Wagner B, Luderitz B (2006) NT-pro-BNP in obstructive sleep apnea syndrome is decreased by nasal continuous positive airway pressure. Clin Res Cardiol 95:23–30
22. Vartany E, Imevbore M, O'Malley M, Manfredi C, Pasquarella C, Scinto L, Fine J (2006) N-terminal pro-brain natriuretic peptide for detection of cardiovascular stress in patients with obstructive sleep apnea syndrome. J Sleep Res 15:424–429
23. Holmes SJ, Espiner EA, Richards AM, Yandle TG, Frampton C (1993) Renal, endocrine, and hemodynamic effects of human brain natriuretic peptide in normal man. J Clin Endocrinol Metab 76:91–96
24. Hall C (2004) Essential biochemistry and physiology of (NT-pro) BNP. Eur J Heart Fail 6:257–260
25. Oztürk LM, Metin G, Cuhadaroğlu C, Utkusavaş A, Tutluoğlu B (2005) Cardiopulmonary responses to exercise in moderate-to-severe obstructive sleep apnea. Tuberk Toraks 53:10–19 26. Lin CC, Hsieh WY, Chou CS, Liaw SF (2006) Cardiopulmonary
exercise testing in obstructive sleep apnea syndrome. Respir Physiol Neurobiol 150:27–34
27. Guillermo LQ, Gal TJ, Mair EA (2006) Does obstructive sleep apnea affect aerobic fitness? Ann Otol Rhinol Laryngol 115:715–720 28. Das SR, Drazner MH, Dries DL, Vega GL, Stanek HG, Abdullah
SM, Canham RM, Chung AK, Leonard D, Wians FH Jr, de Lemos JA (2005) Impact of body mass and body composition on circulating levels of natriuretic peptides: results from the Dallas Heart Study. Circulation 112:2163–2168
29. Goetze JP, Jensen G, Moller S, Bendtsen F, Rehfeld JF, Henriksen JH (2006) BNP and N-terminal proBNP are both extracted in the normal kidney. Eur J Clin Invest 36:8–15
30. Levey AS, Bosch JP, Lewis JB, Greene T, Rogers N, Roth D (1999) A more accurate method to estimate glomerular filtration rate from serum creatinine: a new prediction equation. Modifica-tion of Diet in Renal Disease Study Group. Ann Intern Med 130:461–470
31. Johns MW (1991) A new method for measuring daytime sleepiness: the Epworth sleepiness scale. Sleep 14:540–545
32. Anonymous (1999) Sleep-related breathing disorders in adults: recommendations for syndrome definition and measurement techniques in clinical research. The report of an American Academy of Sleep Medicine Task Force. Sleep 22:667–689 33. Mosteller RD (1987) Simplified calculation of body-surface area.
N Engl J Med 317:1098
34. Taaffe DR, Lewis B, Marcus R (1994) Regional fat distribution by dual-energy X-ray absorptiometry: comparison with anthropome-try and application in a clinical trial of growth hormone and exercise. Clin Sci (Lond) 87:581–586
35. Karl J, Borgya A, Gallusser A, Huber E, Krueger K, Rollinger W, Schenk J (1999) Development of a novel, N-terminal-proBNP (NT-proBNP) assay with a low detection limit. Scand J Clin Lab Invest Suppl 230:177–181
36. Yeo KT, Wu AH, Apple FS, Kroll MH, Christenson RH, Lewandrowski KB, Sedor FA, Butch AW (2003) Multicenter evaluation of the Roche NT-proBNP assay and comparison to the Biosite Triage BNP assay. Clin Chim Acta 338:107–115 37. Fletcher GF, Balady GJ, Amsterdam EA, Chaitman B, Eckel R,
Fleg J, Froelicher VF, Leon AS, Pina IL, Rodney R, Simons-Morton DA, Williams MA, Bazzerre T (2001) Exercise standards for testing and training: a statement for healthcare professionals from the American Heart Association. Circulation 104:1694–1740 38. American Thorax Society/American College of Chest Physicians (2003) ATS/ACCP Statement on cardiopulmonary exercise test-ing. Am J Respir Crit Care Med 167:211–277
39. Arena R, Myers J, Aslam SS, Varughese EB, Peberdy MA (2003) Technical considerations related to the minute ventilation/carbon dioxide output slope in patients with heart failure. Chest 124:720– 727
40. Schiller NB, Shah PM, Crawford M, DeMaria A, Devereux R, Feigenbaum H, Gutgesell H, Reichek N, Sahn D, Schnittger I (1989) Recommendations for quantitation of the left ventricle by two-dimensional echocardiography. American Society of Echocardiogra-phy Committee on Standards, Subcommittee on Quantitation of Two-Dimensional Echocardiograms. J Am Soc Echocardiogr 2:358– 367
41. Lang RM, Bierig M, Devereux RB, Flachskampf FA, Foster E, Pellikka PA, Picard MH, Roman MJ, Seward J, Shanewise JS, Solomon SD, Spencer KT, Sutton MS, Stewart WJ (2005) Recommendations for chamber quantification: a report from the American Society of Echocardiography’s Guidelines and Stand-ards Committee and the Chamber Quantification Writing Group, developed in conjunction with the European Association of Echocardiography, a branch of the European Society of Cardiology. J Am Soc Echocardiogr 18:1440–1463
42. Weber KT, Janicki JS, McElroy PA (1987) Determination of aerobic capacity and the severity of chronic cardiac and circulatory failure. Circulation 76:VI40–VI45
43. Kita H, Ohi M, Chin K, Noguchi T, Otsuka N, Tsuboi T, Itoh H, Nakao K, Kuno K (1998) The nocturnal secretion of cardiac natriuretic peptides during obstructive sleep apnoea and its response to therapy with nasal continuous positive airway pressure. J Sleep Res 7:199–207
44. Moller DS, Lind P, Strunge B, Pedersen EB (2003) Abnormal vasoactive hormones and 24-hour blood pressure in obstructive sleep apnea. Am J Hypertens 16:274–280
45. de Simone G, Daniels SR, Devereux RB, Meyer RA, Roman MJ, de Divitiis O, Alderman MH (1992) Left ventricular mass and body size in normotensive children and adults: assessment of allometric relations and impact of overweight. J Am Coll Cardiol 20:1251–1260
46. Cooke GA, Marshall P, al-Timman JK, Wright DJ, Riley R, Hainsworth R, Tan LB (1998) Physiological cardiac reserve: development of a non-invasive method and first estimates in man. Heart 79:289–294
47. Marin JM, Carrizo SJ, Vicente E, Agusti AG (2005) Long-term cardiovascular outcomes in men with obstructive sleep apnoea-hypopnoea with or without treatment with continuous positive airway pressure: an observational study. Lancet 365:1046–1053 48. Kistorp C, Raymond I, Pedersen F, Gustafsson F, Faber J,
Hildebrandt P (2005) N-terminal pro-brain natriuretic peptide, C-reactive protein, and urinary albumin levels as predictors of mortality and cardiovascular events in older adults. JAMA 293:1609–1616
49. Wang TJ, Larson MG, Levy D, Benjamin EJ, Leip EP, Wilson PW, Vasan RS (2004) Impact of obesity on plasma natriuretic peptide levels. Circulation 109:594–600
50. Olsen MH, Hansen TW, Christensen MK, Gustafsson F, Rasmussen S, Wachtell K, Borch-Johnsen K, Ibsen H, Jorgensen T, Hildebrandt
P (2005) N-terminal pro brain natriuretic peptide is inversely related to metabolic cardiovascular risk factors and the metabolic syn-drome. Hypertension 46:660–666
51. Daniels LB, Clopton P, Bhalla V, Krishnaswamy P, Nowak RM, McCord J, Hollander JE, Duc P, Omland T, Storrow AB, Abraham WT, Wu AH, Steg PG, Westheim A, Knudsen CW, Perez A, Kazanegra R, Herrmann HC, McCullough PA, Maisel AS (2006) How obesity affects the cut-points for B-type natriuretic peptide in the diagnosis of acute heart failure. Results from the Breathing Not Properly Multinational Study. Am Heart J 151:1006–1012
52. Horwich TB, Hamilton MA, Fonarow GC (2006) B-type natriuretic peptide levels in obese patients with advanced heart failure. J Am Coll Cardiol 47:85–90