HAL Id: inserm-00426352
https://www.hal.inserm.fr/inserm-00426352
Submitted on 10 Dec 2009
HAL is a multi-disciplinary open access
archive for the deposit and dissemination of
sci-entific research documents, whether they are
pub-lished or not. The documents may come from
teaching and research institutions in France or
abroad, or from public or private research centers.
L’archive ouverte pluridisciplinaire HAL, est
destinée au dépôt et à la diffusion de documents
scientifiques de niveau recherche, publiés ou non,
émanant des établissements d’enseignement et de
recherche français ou étrangers, des laboratoires
publics ou privés.
spikes: insights from a neural network model.
Sophie Demont-Guignard, Pascal Benquet, Urs Gerber, Fabrice Wendling
To cite this version:
Sophie Demont-Guignard, Pascal Benquet, Urs Gerber, Fabrice Wendling. Analysis of intracerebral
EEG recordings of epileptic spikes: insights from a neural network model.. IEEE Transactions on
Biomedical Engineering, Institute of Electrical and Electronics Engineers, 2009, 56 (12), pp.2782-95.
�10.1109/TBME.2009.2028015�. �inserm-00426352�
Analysis of intracerebral EEG recordings of
epileptic spikes: insights from a neural network
model
Sophie Demont-Guignard, Pascal Benquet, Urs Gerber, Fabrice Wendling
Abstract— The pathophysiological interpretation of EEG signals recorded with depth electrodes (i.e. local field potentials, LFPs) during interictal (between seizures) or ictal (during seizures) periods is fundamental in the pre-surgical evaluation of patients with drug-resistant epilepsy. Our objective was to explain specific shape features of interictal spikes in the hippocampus (observed in LFPs) in terms of cell and network-related parameters of neuronal circuits that generate these events. We developed a neural network model based on “minimal” but biologically-relevant neuron models interconnected through GABAergic and glutamatergic synapses that reproduces the main physiological features of the CA1 subfield. Simulated LFPs were obtained by solving the forward problem (dipole theory) from networks including a large number (~3000) of cells. Insertion of appropriate parameters allowed the model to simulate events that closely resemble actual epileptic spikes. Moreover, the shape of the early fast component (‘spike’) and the late slow component (‘negative wave’) was linked to the relative contribution of glutamatergic and GABAergic synaptic currents in pyramidal cells. In addition, the model provides insights about the sensitivity of electrode localization with respect to recorded tissue volume and about the relationship between the LFP and the intracellular activity of principal cells and interneurons represented in the network.
Index Terms—CA1; computational modeling; hippocampus; local field potentials; population spikes
I. INTRODUCTION
Epilepsy, one of the most common neurological disorders afflicting approximately 1% of the population, is characterized by recurrent seizures that profoundly affect the patients’ lives. Over the past decades, clinical and experimental studies have improved our understanding of several underlying mechanisms involved in epilepsies. However, many issues remain unresolved. In particular, difficulties remain in the
interpretation of intracerebral EEG signals (depth-electrodes, local field recordings) recorded in patients with drug-resistant epilepsy during the pre-surgical assessment. In most partial epilepsies, two types of “markers” are usually observed in these signals. On the one hand, seizures are characterized by fast oscillations in the gamma (25-40 Hz) band of the EEG [1-4]. This “fast tonic discharge” gradually changes into slower “clonic activity”, mostly in the theta band. On the other hand, between seizures, signals are characterized by the occurrence of so-called “interictal paroxysmal events” that mostly consist of transient spikes or spike-waves.
S. Demont-Guignard is supported by the Region Bretagne. The authors also thank Pr Fabrice Bartolomei for human interictal depth-EEG recordings and for his comments and suggestions on this manuscript.
S. Demont-Guignard and F. Wendling are with INSERM, U642, Rennes, F-35000, France and Université de Rennes 1, LTSI, F-35000, France, e-mail: fabrice.wendling@univ-rennes1.fr.
P. Benquet is with CNRS UMR6026, Université de Rennes 1, Rennes, F-35000, France and Université de Rennes 1, LTSI, F-F-35000, France. U. Gerber is with Brain Research Institute; Zurich; CH-8057, Switzerland.
In this paper, we focus on this second type of activity. It has been hypothesised in several studies [5] that morphological features (amplitude, duration, sharpness) of interictal events may reflect excessive excitability of neuronal networks that generate these events. Therefore, interictal events convey important information regarding the “epileptogenic” properties of neuronal tissue. The objective of the present study is to “decode” this information using a computational modeling approach.
We present a biologically-inspired model of a neural network reproducing the main physiological features (principal cells, interneurons, connectivity) of the CA1 subfield of the hippocampus, a mesial structure of the temporal lobe often involved in temporal lobe epilepsy (TLE). Using dipole theory, this model incorporates a sufficiently large number of cells (in the order of 3000) to allow the simulation of a local field potential (LFP) as recorded with a depth electrode positioned in the anterior hippocampus of an epileptic patient. The model was therefore used to investigate how cell-related and network-related parameters influence the LFP. More specifically, our goal was to characterize the parameters that alter the morphological features of simulated waveforms in response to a stimulation that mimics an afferent volley of action potentials from the CA3 area via the Schaffer collaterals to the CA1 network. Parameter sensitivity analysis was used to derive input values that permitted the model to simulate events closely resembling actual epileptic spikes. In particular, the shape of the early fast component and the late slow component of the epileptic spike could be linked to the relative contribution of glutamatergic and GABAergic synaptic currents in pyramidal cells, controlled, in the model, by modifying the conductances associated with these currents.
In addition, the model provided insights into i) the sensitivity of electrode localization with respect to the recorded volume, ii) the relationship between the LFP and the intracellular activity in principal cells and interneurons and iii) the shape of the network response as reflected in the LFP with respect to the stimulation parameters. Parts of this work have been published previously in preliminary form [6].
II. A DETAILED MODEL OF THE CA1 SUBFIELD OF THE HIPPOCAMPUS
We have developed a physiologically and biophysically plausible neural network model of the CA1 subfield of the hippocampus, a sub-cortical structure often involved in temporal lobe epilepsy. It consists of biologically-inspired neurons (pyramidal cells) and interneurons (basket and oriens-lacunosum moleculare - OLM - cells) interconnected according to available data on the actual circuitry of the hippocampus [7]. In line with the many studies reviewed below in section II.A, we used a compartmental modeling approach as well as the Hodgkin-Huxley formalism to describe the membrane properties of neurons. The novelty of our proposed model of a CA1 pyramidal cell (presented in section II.B) lies in the fact that even though it is reduced to two compartments (in line with Pinsky and Rinzel’s work [8] on CA3 pyramidal neurons), it accounts for a variety of somatic and dendritic currents of potential interest in epilepsy. Several of these currents are not represented in models published elsewhere. In addition, we validated this cell model experimentally using signals recorded intracellularly from organotypic hippocampal slices (see section IV.A) before studying the effects of network-parameters that lead to the generation of epileptic spikes (section V.B).
A. Background
During the patt decades and since the first biomathematical description of the action potential in the squid giant axon [9, 10], computational modeling of single neurons and of networks of neurons has advanced considerably. Classically, in single cell models, compartments are used to represent parameters related to neuronal morphology, to passive (membrane capacitance, axial resistivity, leak conductance, membrane time constant) and to active electrical properties (voltage-gated and ligand-gated ion channels) that are specific to each cell type, and that obey current balance equations (see (1)-(2)-(3)). Table 1 provides the main features of previously published detailed models that reproduce the activity of pyramidal cells in the CA1 and CA3 subfields of the hippocampus. The first detailed models were developed by Traub and colleagues [11] in the 1980s, and were used to study the impact of network synchronization on the generation of epileptiform activity. Regarding these pioneering studies, it is noteworthy that Pinsky and Rinzel [8] showed that a spatially-reduced version (2 compartments, soma + dendrites) of Traub’s CA3 model [12] (19 compartments: soma + axon + dendrites) can still preserve most of the essential features of the initial model. As depicted in table 1, models differ with
respect to structural (number of compartments, presence/absence of the axon) and functional characteristics (transmembrane currents). Indeed, the number of compartments ranges from one [13] to several hundreds [14]. Although the minimal configuration of one compartment for the soma alone can be used, most of the models include at least one compartment for the dendrites. The representation of the axon space is generally not included. It is noteworthy that some of the models presented in table 1 correspond to more advanced versions based on previously presented models. It can also be observed that for both subfields, some currents are always included (voltage-dependent sodium currents INa,
potassium delayed-rectifier currents IKDR) such as those
directly involved in action potential (AP) generation. In some cases, additional currents such as muscarinic potassium current Im, after-hyperpolarisation calcium-dependent
potassium currents IAHP are added to represent
accommodation of spike frequency.
B. CA1 pyramidal cell: proposed reduced model
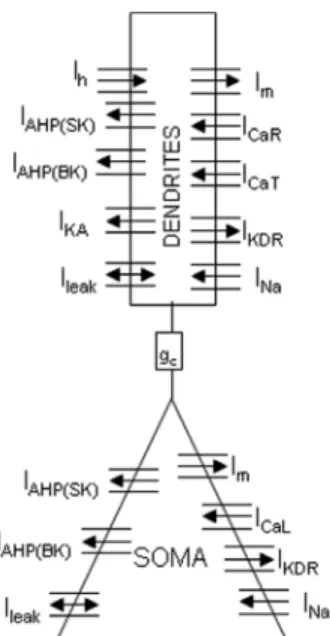
We followed Pinsky and Rinzel’s approach [8] and developed a ‘reduced’ two-compartmental model of a CA1 pyramidal neuron illustrated in figure 1. Our rationale was to achieve a compromise between physiological relevance and computing time. In this regard, our model does not provide a very accurate 3D representation of the dendritic tree (which requires a high number of compartments) but allows the simulation of LFPs from networks that include a sufficiently large number of cells.
Figure 1: Reduced CA1 pyramidal neuron computational model (two compartments). Each compartment has voltage-dependent sodium currents (INa), potassium delayed-rectifier currents (IKDR), calcium-dependent
potassium (IAHP) currents, a muscarinic potassium current (Im) and a
non-specific leak current (ILeak). The soma has in addition an L-type calcium
current (ICaL). Dendrites have T and R-type calcium currents (ICaT, ICaR), a
fast inactivating potassium current (I
R KA) and a hyperpolarization activated
cationic current (Ih). Coupling between soma and dendrites is ensured by
TABLEI
SUMMARIZED LITERATURE REVIEW OF PYRAMIDAL NEURON MODELS FOR CA1 AND CA3 SUBFIELDS IN THE HIPPOCAMPUS. Authors CA Number of compartments Ionic currents
Dendrites Soma Axon Dendrites Soma Axon
Traub et al., 1991 [12] 3 19 INa, IKDR, IKC, IKA, ICa, IKAHP Pinsky et Rinzel, 1994 [8] 3 1 1 0 INa, IKDR ICa, IKAHP, IKC, Warman et al., 1994 [15] 1 16 INa, ICa, IKDR, ICT, IA, IM, IAHP Migliore, 1996 [16] 1 14 1 1 If, INa, IKDR, Ih If, INa, IKDR, Ih INa, IKDR, IKM, Ih Almeida et al., 1998 [17] 1 6 INa, IK Kamondi et al., 1998 [18] 1 1 1 0 INa, IK INaP, IKS Migliore et al, 1999 [19] 1 202 INa, IKDR, IKA INa, IKDR, IKA INa, IKDR, IKA Varona et al., 2000 [20] 1 265 INa, ICa, IKDR, IM, IA, IKC, IKAHP Menschik and Finkel., 2000 [21]
3 385 INa, IKDR, IKC, IKA, ICaT, ICaN, ICaL, IKAHP, Im
Tiesinga et al., 2001 [22] 3 1 1 0 INa, IKDR IK ICa, IKC, IKAHP, IM, O, INaO Sargsyan et al, 2001 [23] 1 18 1 0 INa, IKDR Poolos et al., 2002 [24] 1 202 INa, IKDR, IKA, , Ih INa, IKDR, IKA, Ih INa, IKDR, IKA , Ih Watanabe et al., 2002 [25] 1 202 INa, IKDR, IKA INa, IKDR, IKA INa, IKDR, IKA Migliore, 2003 1 202 INa, IKDR, IKA, , Ih INa, IKDR, IKA, Ih INa, IKDR, IKA , Ih Poirazi et al, 2003 [26]
1 183 INa, IKDR, IKA, Ih, ICaT, ICaRR, ICaL,
IAHP(SK) , IAHP(BK) , Im INa, IKDR, IKA, Ih, ICaT, ICaRR, I IAHP( m CaL, SK) , IAHP(BK) , I INa, IKDR, IKA, Ih,
ICaT, ICaRR, ICaL,
IAHP(SK), IAHP(BK),
Im
Heilman and ochi, 2004 Quattr
1 1 1 1 INaT, IKDR, IKA Ca, ICaL, ICaT,
I R, I N I ICa , I T, I R, ICaN INaT, IKDR, ICaN [27] , , IK Ca Ca
NaT, IKDR, IKA,, IKCa, L Ca Ca
Gasparini and al., 2004 [28]
1 INa, IKDR, IKA, , Ih INa, IKDR, IKA, Ih INa, IKDR, IKA , Ih
Hajòs et al, 2004 256 0 INa, IKDR, IKM, IKA, ICa, IKAHP, IKCT, Ih
[29] 1 Migliore et al., 1 202 I , I , I , Ih I , I , I , I INa, IKDR, IKA , Ih 2005 [14] Na KDR KA, Na KDR KA h Kali et Freund, 455 0 INa, IK 2005 [30] 1 DRR IKAHP,
ICaT, ICaL, I N, ICaR, Ih
I ,
, IKA, IKM, IKC, Ca
Na¸IKDR, IKA, IKM
IKC, IKAHP, ICaT, ICaN
Golomb et al, 1 0 1 0 INa, INaP, IKDR, IA, ,
2006 [13] IM Golomb et al, 1 0 1 0 INa, I M, 2006 [13] NaP, IKDR, IA, I ICa, IC, IsAHP Li et Ascoli, 1 202 INa, IKDR, IKA, Ih INa, IKDR, IKA, Ih INa, IKDR, IKA, Ih 2006 [31] Orbán et al, 2006 [32] 1 256 0 INa, IK, IKA, IKM, IKC, ICa, IKAHP, INa, I , IKC, Ih K, IKA, IKM ICa, IKAHP The present 1 1 1 0 I , I , I SK), IKDR, Ih, , I AHP(BK) , IAHP( , ICaR, ICaT I I Na, IKDR, IAHP(BK) , , ICaL model Na KA (SK), Im m AHP
Based on the Hodgkin and Huxley formalism [9, 10], equations of conservation of electric charge for the two compartments can be written as follows:
( )
m( )
m ion
ion
dt
According to this formalism, the cell membrane acts as a capacitor Cm connecting the membrane potential Vm (stated
Vs for the soma and Vd for the dendrites) to currents passing
through the membrane; with I(t) (Is(t) for the soma or Id(t) for the dendrites) the injected input current. For the sum of the
dV
I t =C + ∑I t (1)
ionic curre ts, each current Iion is given by n
. . .( ) ion ion m ion
I =g x y V −E (2).
In (2), gion represents the ionic conductance; x.y (the
product of the gating variables) is the open-channel reversal potential. Gating variables
. . .( ) ion ion m ion
I g x y V E
probability and Eion the
also obey the following differential equations:
= − (3). For ble x
approaches the asympto
a Vm, the varia c value ti
( )
( )
( )
m x m V β + (4) m x x V V x α α = infwith the time constant
( )
( )
m x( )
m x xV α V τ + = 1 (5), where α V β an [34], rrent (Ih,and OLM cells. These interneurons n from
B.
ons firing action potentials and ii) the delay between these action d β are voltage-dependant functions empirically adjusted to
fit experimental data (APPENDIX 1).
Special attention was paid to the selection of the main ionic channels (voltage-gated and leak) included in the model. In this respect, it differs from previous work in that it accounts for more currents than classical reduced models. The selection of the main ion channels (voltage-gated and leak) was performed based on a review of the literature and was reinforced by data recorded in an experimental preparation (organotypic rat hippocampal slices, see Section IV.A). Current equations were taken from more detailed models published elsewhere and summarized in APPENDIX 1. In brief, the shape of the AP was mainly generated by INa, IKDR
and ICa (low and high threshold calcium currents). In addition,
to replicate physiological firing rates potassium channels activated by intracellular calcium ions were added (IAHP).
Similarly, a rapidly inactivating potassium current IKA, present
only in the dendritic compartment [33], was also included in consideration of its potential role in epileptiform activity as well as a hyperpolarization-activated cationic cu within the dendritic compartment [35]]), and Im [36, 37].
A. CA1 interneuron models: OLM and basket cells
The hippocampal circuitry comprises excitatory principal cells and inhibitory interneurons. Although principal neurons are rather uniform within each hippocampal subfield, a large morphological and functional heterogeneity is typical of interneurons [38, 39]. We included only the two most common types of GABAergic interneurons in our model of the CA1 network: basket
were represented by single compartment models take the literature [29].
CA1 network model: connectivity parameters and stimulation
Network simulations included glutamatergic (AMPA and NMDA) and GABAergic synapses. The corresponding equations are provided in APPENDIX 2. Simulated cells were connected to reproduce the CA1 circuit (fig. 2-a and b) in accordance with commonly accepted assumptions (location of synapses and receptors, synaptic strength, connectivity patterns). The percentage of pyramidal cells was set at 80%, that of interneurons at 20%. The number of basket cells was set to equal the number of OLM cells. Regarding connectivity patterns, the number of connections per cell and the maximum distance between two connected cells were fixed according to the literature [7]. The probability of a connection was based on a Gaussian distribution: physiologically, the probability of a connection between two neurons is larger when the two cells are close, and is null beyond a maximum distance. The maximum distance depended on the connection type. If d(presynaptic cell, postsynaptic cell) denotes the maximum distance at which the presynaptic cell can connect a given cell, values were adjusted as follows: d(pyr, pyr)=20µm, d(pyr,
bas)=500µm, d(pyr, olm)=500µm, d(bas, pyr)=700µm, d(bas, bas)=700µm, d(olm, pyr)=840µm and d(olm, bas)=840µm. selected in CA1, that are contacted by axons firing action potentials and ii) the delay between these action potentials occurring according to a Gaussian distribution.
Pyramidal neurons and interneurons were evenly distributed in a 3D space, as shown in figure 2-c. Finally, the whole network was stimulated with an afferent volley of quasi-synchronous action potentials coming from an “external array of cells” (fig. 2-d). The objective was to mimic the input from CA3 to CA1. In practice, the stimulation of the CA1 network depends on two parameters: i) the number of cells, randomly and uniformly selected in CA1, that are contacted by ax potentials occurring according to a Gaussian distribution.
III. RECONSTRUCTION OF THE LOCAL FIELD POTENTIAL (LFP) Here, we assumed that the simulated LFP corresponds to the signal induced by the network at the level of a point extracellular electrode placed in its center. The computation of this simulated LFP was based on dipole theory with the following assumptions. First, due to their spatial arrangement ‘in palisades’, the pyramidal cells are the main contributors to the LFP. Second, each pyramidal cell is considered as a point source, i.e. a current dipole formed by a sink and a source.
Figure 2: Network structure and reconstruction of the field potential. a) The network model is intended to reproduce several essential features of the CA1 subfield (hippocampus). b) It includes oriens-lacunosum moleculare (OLM) and basket (BAS) interneurons and pyramidal cells (PYR). Each cell is represented by a compartmental model. The respective percentages of cells and the connectivity patterns (synaptic interactions only) were fixed according to the literature. c) The extracellular field recording is calculated by solving the forward problem from the network to the measurement electrode (V) using dipole theory. d) The CA1 network stimulation was obtained by i) stimulating an “external” array of cells representing CA3 pyramidal cells (direct current injection at the soma) and ii) using evoked APs as the input to the network. The asterisk (*) symbolize randomly selected cells in CA1 that are stimulated. The number of stimulated cells and the delay (Δt) among afferent APs can be varied.
Third, all current dipoles are positioned within a volume According to these postulates, th of th
conductor characterized by homogeneous conduct e potential V e electric di
ivity.
i
pole associated with a cell i is: 2
4 . i i i i r u d V σ π G G = (6)
where σ is the conductivity, ri is the distance between cell i and the point of measurement (i.e. the recording electrode), uGi
is a unit vector on the straight line going from cell i (center of the soma compartment) to the recording point dGi, is the dipole moment (figure 2-c).
Under the quasi-static approximation and according to the superposition theorem, the contributions of all pyramidal cells sum up instantaneously at the level of the extracellular recording electrode, which is typically positioned in the middle of the dendritic layer along the somato-dendritic axis c. Therefore, the total potential V d at
at the center of the modeled network, as illustrated in figure generate the level of the re
n
cording electrode is given by: V =
∑
Vi (7)= i 1
where N is the total umber of pyramidal cells.
To compute V, the only variable that must be estimated is the dipole moment di
N
G
(6). Regarding the orientation, the dipole was aligned with the main axis of the cell. In our reduced two-compartment model of the pyramidal neuron, we assumed that the sink and the source are located at the level of somatic compartment and the dendritic compartment, respectively. Regarding the magnitude of the dipole moment
i
d
the G
, we estimated the magnitude of the longitudinal current flowing along the somato-dendritic axis as a function of the de dritic and somatic m ed numerical integration:
n embrane potential obtain by
i i c i d i s i V V g l S
dG = − . . . where i is the cell index, i s
V and
i d
V , respectively, denote the so atic and dendritic membrane potential, g
m
approximates a cone of radius RS = 7.5 µm and of height HS = 15 µm (Ssoma at the ratio Ssoma/Si =
cubator at 36°C. After 2-3 weeks in vi
itially increased neuronal spike frequency and cterized by
. It was verified that interictal spikes analyzed in this study were generated at the level of an cornu ammonis).
a sampling frequency of 20 kHz. For a network including about 3000 cells, the simulation of a 1.7 second segment of activity required 40 minutes on a quad-core PC computer.
c is the coupling conductance between the somatic and dendritic compartments, li is the distance between the sink and the source, and Si is the total membrane surface. Regarding the numerical values, we chose gc = 1 mS.cm-2,
i
l
= 157.5 µm (half of the size of the dendritic tree and half of the soma size). For Si, we assumed that the soma
= πR(R+√(R²+h²))) and th 0.15 as in [8].
IV. REAL DATA
A. Intracellular data from hippocampal slices
Organotypic slice culture preparation. Hippocampal slice cultures were prepared from 6-d-old Wistar rats as described previously [40] following a protocol approved by the Veterinary Department of the Canton of Zurich. Briefly, hippocampi were dissected from 6-day-old Wistar rats, and
tranverse slices (375 µm thick) were maintained in individual tubes in a roller drum in
tro the slice cultures were transferred to a recording chamber on an upright microscope (Axioscope FS, Zeiss, Oberkochen, Germany).
Intracellular recordings. CA1 pyramidal neurons were recorded from with patch pipettes in the whole-cell, current-clamp mode using an Axopatch 200B amplifier (Axon Instruments, Foster City, CA). Slices were superfused continuously at a rate of 1-2 ml/min with normal ACSF at a bath temperature of 32°C. Recording pipettes (3–6 MΩ), were filled with an intracellular solution containing the following: 135 mM K-gluconate, 4 mM KCl, 10 mM HEPES, 10 mM Na2-phosphocreatine, 4 mM Mg-ATP, 0.3 mM Na-GTP, pH 7.2, 291–293 mOsm. Electrophysiological data were acquired and analyzed with pClamp 9.0 software (Axon Instruments). Signals were analog-filtered at 10 kHz and sampled at 100-300 kHz. Liquid junction potentials (10 mV) were deducted offline. Drugs were applied by bath perfusion. 4-aminopyridine (4-AP) (50-100 µM) was superfused for 2 to 15 min. 4-AP in
subsequently induced epileptiform activity chara
the spontaneous generation of paroxysmal depolarization shifts (PDS).
B. Depth-EEG data from human hippocampus
Human interictal data shown in this study were selected from depth-EEG recordings performed in a patient with mesial TLE using intracerebral electrodes (10 to 15 contacts, length: 2 mm, diameter: 0.8 mm, 1.5 mm apart) placed orthogonally according to Talairach's stereotactic method [41]. The implantation accuracy was per-operatively controlled by telemetric X-ray imaging. A post-operative CT scan without contrast medium was used to check both the absence of bleeding and the precise 3D location of each electrode contact
electrode contact positioned in the hippocampus (anterior
V. RESULTS: MODEL-BASED INTERPRETATION OF EPILEPTIC SPIKES
As a first step, we evaluated the single pyramidal neuron model by comparing the simulated intracellular activity with real intracellular activity recorded from pyramidal cells in an in vitro model (section V.A). As a second step, we built networks from model cells and studied parameter-related conditions that led these networks to generate transient events (in response to stimulation) resembling actual epileptic spikes (section V.B). Simulations were run with software written in C and objective C. The differential equation systems associated with detailed models were solved with the 4th order Runge-Kutta algorithm (fixed step), with
A. Single cell activity: simulated versus real action potentials
Once selected, current equations were adjusted and validated in comparison to real recordings (figure 3). The constraint is firstly, to reproduce classic electrophysiological basic characteristics and secondly, to explore the relevance of the change of parameters that leads to transitions from normal to epileptic activity (fig. 3-c, d).
The stimulation protocol consisted in injecting a current into the somatic compartment. The current parameters (intensity, duration, instant of stimulation) were set according to the simulation. The model allows somatic or dendritic activity to be recorded.
For similar stimulation protocols, it can be observed that the single cell model, although reduced to 2 compartments, can generate fairly realistic signals, as exemplified in figure 3-a: the simulated APs reproduces the main characteristics of real APs recorded from CA1 pyramidal cells. It is noteworthy that it is sufficient that the cell behavior mimics the real behavior qualitatively (AP shape and threshold, spike rate adaptation upon depolarizing current and sag plus rebound upon hyperpolarization), since our intent is to analyze the global
activity of the CA1 network.
Current-clamp recordings were used to examine two classical manifestations of the contributions of Ih on intrinsic excitability: the voltage sag seen during hyperpolarizing current injections and the subsequent rebound excitation [42]. Rebound excitation is prominent in CA1 neurons, thus Ih contributes to intrinsic excitability to a much greater extent in CA1 pyramidal cells than in, for example, CA3 neurons [42]. Therefore, rebound excitability reflects normal behavior of CA1 pyramidal cells. Indeed, when a standard current clamp protocol was used to induce a hyperpolarization from 50 to -100 mV in hippocampal slices, rebound excitation evoked an action potential. When a similar hyperpolarizing protocol is imposed in our computational model, an action potential also appeared during the rebound excitation (fig. 3-b). This spike is not elicited when Ih is maintained at 0. This result indicates that, in the computational model, rebound excitation is linked to Ih deactivation, as is the case in native cells. This parameter is interesting because Ih has been shown to be involved in TLE [43].
Parameter sensitivity analysis was performed. Conductance values were selected from the literature (basic values, and channel density along the membrane) and then tested using parameter sensitivity analysis in the reduced model to gauge the impact of each parameter in comparison to the others. An example is shown in figure 3-c, d, where parameters were adjusted to reproduce intracellular experimental data both under control and in ‘epileptic’ conditions.
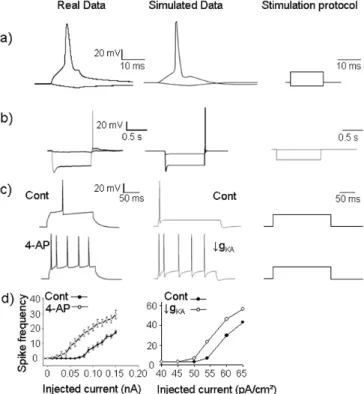
We paid special attention to fast inactivating potassium channels (IKA) because they have been shown to be implicated in TLE [34] and perfusion of the IKA blocker 4AP is used in a classical in vitro model of ictogenesis [44]. A-type potassium current blockade affects back-propagation and increases excitability of cells leading to a switch from normal to bursting activity [45]. As depicted in figure 3-c, d, reducing
IKA conductance led the computational model to switch from normal to bursting activity. For the same stimulation protocol, an increase in the number of spikes occurred in the experimental recordings in presence of 4AP or by reducing gKA in the computational model.
Figure 3: Validation of the CA1 pyramidal neuron model. a) Comparison of a real action potential (AP) recorded in a CA1 pyramidal cell (left) obtained from rat organotypic hippocampal slices and a simulated AP generated by the CA1 pyramidal cell model (right). Both plots represent the time course of the somatic membrane potential. b) Membrane voltage responses generated by Ih
in response to a series of hyperpolarizing current pulses. Traces were obtained using the experimental model (left) and the computational model (right). c) Illustration of the effect of IKA blockade on CA1 pyramidal cell firing
rate.Voltage somatic responses in control and in presence of the IKA blocker
4-aminopyridine (4AP) (left). The computational model was also stimulated and the inactivating potassium conductance value (gKA) was reduced from 55
mS/cm² (control) to 15 mS/cm² to mimic the effect of 4AP). d) Average effect on CA1 pyramidal cell firing rate for different depolarizing pulses, in absence (Cont) or presence of 4AP on real neurons (from organotypic hippocampal slices, n=7) (left) or AP simulated (decrease of gKA).
B. Network activity: simulated versus real epileptic spikes
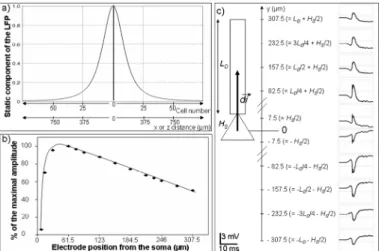
To analyze the network response to stimulation and its contribution to the response measured by the recording electrode, a critical question had to be solved: how many pyramidal neurons and interneurons should be included in the network? To address this question, we plotted the “static” component of the LFP as a function of the distance along the X axis (orthogonal to the somato-dendritic Y axis of pyramidal cells), as shown in figure 4-a. This static gain can be easily obtained from equation 6 and 7 by setting the modulus of the dipole moment dGi equal to 1, for all pyramidal cells. In this case, the reconstructed local field potential depends only on the location of the cells with respect to the recording electrode and on the conductivity of the volume conductor, as the dependence on membrane potential
variations is removed. As expected, the gain is maximal at the electrode location (x = 0) and rapidly decays with distance. As shown in figure 4-a, it was found to drop down to 10% of the maximum at x = -375 µm and x = +375 µm, which corresponds to 50 adjacent cells. We chose this value to estimate the total number of pyramidal cells to include in the simulated network, which consisted of an array including 2500 cells (50 cells along the X axis and 50 cells along the Z axis) with a virtual point electrode positioned at its center. In other words, outside this “volume of sensitivity” around the electrode, we assumed that the contribution of cells to the reconstructed LFP is negligible. Regarding the Y axis, we studied the influence of electrode position on the reconstructed LFP. Results presented in figure 4-b and c show how the amplitude of the network response as well its polarity changes when the electrode is moved along the somato-dendritic direction of pyramidal cells. It is noteworthy that a realistic order of magnitude was obtained for the response (in the order of several hundreds of µV to a few mV) when the electrode was placed at the level of the dendritic compartment at a distance of 232.5 µm from the soma.
Finally, as described in section II.D, we assumed that in the CA1 subfield, pyramidal cells represent 80% and interneurons 20% of the total number of cells, and that OLM and basket interneurons represent 50% each of the total number of interneurons, leading to a total number of 3124 interconnected cells: 2500 pyramidal neurons, 312 basket and 312 OLM interneurons, randomly distributed among the pyramidal cells.
Starting from this configuration, we studied network activity (as reflected in the reconstructed LFP) in response to a stimulation consisting of an afferent volley of quasi-synchronous APs in axons targeting CA1 pyramidal cells randomly chosen in the network. Stimulation parameters (number of stimulated cells, standard deviation of the delay between incoming APs) were varied (not shown). The results
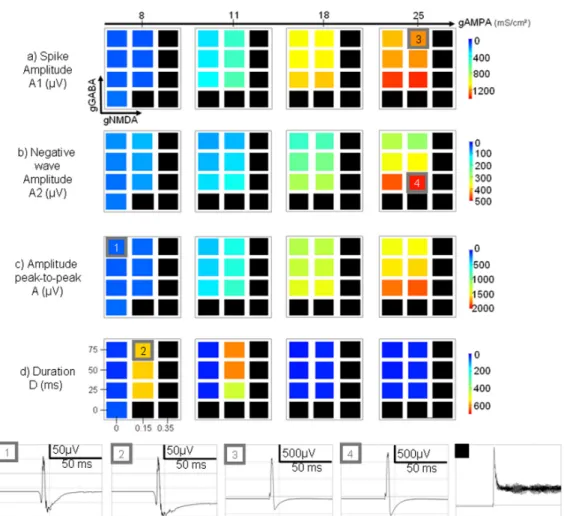
showed that beyond a certain percentage of stimulated pyramidal cells in CA1 (30%) and for increased conductances associated with glutamatergic currents, the simulated LFP could exhibit transient events (fig. 5-b) that closely resemble typical epileptic spikes (fig. 5-a) recorded with depth electrodes in the hippocampus of patients undergoing pre-surgical evaluation for drug-resistant epilepsy. The examples of real interictal spikes (recorded in one patient) displayed in figure 5-a show that the morphological features (amplitude, duration, more or less pronounced negative wave component following the spike component) can strongly vary in time. To explain these morphological features from the model, we conducted a parameter sensitivity analysis focusing specially on conductance values associated with excitatory (AMPA, NMDA) and inhibitory (GABA) synaptic currents. The methodology was straightforward. For each triplet (gAMPA, gNMDA, gGABA) of conductance values over user-defined intervals, we performed a simulation and measured certain features in the shape of the resulting LFP responses evoked by stimulation, as described in figure 5-c (amplitude of the spike (fast early component) and wave (slower late negative wave) components, total amplitude and duration). We then depicted the measured features as a function of the model parameters using color-coded maps, as shown in figure 6. Two neighboring points corresponded to a modification of either NMDA or GABA conductance values. Variances of the AMPA conductance value are indicated by transitions from one map to another.
Interestingly, for some parameter configurations, we noticed that the model becomes unstable and generates an oscillatory activity that could resemble ictal activity. A detailed analysis of this model behavior (beyond the scope of this study) would be necessary. At this stage, the “ictal-like”
Figure 4: Essential features of the simulated local field potential (LFP). a) “Static” component of the LFP recorded by the point electrode as a function of space. Note the attenuation with respect to the distance along the X and Z axes. b) and c) Relationship between the electrode position (along the Y axis) and the amplitude of the reconstructed LFP. LD is the length of the dendritic
compartment; HS is the height of the somatic compartment, and di
G
dipole moment of the neuron.
Figure 5: Comparison between real and simulated data. a) Typical epileptic spikes recorded with depth-EEG electrodes in hippocampus from a patient with TLE. These spikes were sorted according to increasing amplitude. Spikes are typically characterized by a fast early component followed by a slower negative component (arrows in the lower right box in 5-a). This figure shows the variability of interictal events in terms of amplitude and duration. b) Typical epileptic spike simulated from the model. c) Morphological features measured in simulated spikes and analyzed with respect to model parameters. A: peak-to-peak amplitude, A1: Spike component amplitude, A2: Negative wave amplitude D: Duration.
activity just appears as black squares in the feature maps. A general inspection of these maps showed that the measured features are parameter-dependant. It also revealed that the “ictal-like” activity was mainly produced, in the model, for increased AMPA and NMDA and decreased GABA conductance values.
Regarding the spike component (A1) alone (fig. 6-a), the results showed that the amplitude was mainly correlated with the AMPAergic synaptic current, as shown in figure 6 (transition from condition 1 or 2 to condition 3). This amplitude increase also appeared when the NMDA conductance value was increased, but to a lesser extent. The effect of changes in GABA conductance was found to be in the opposite direction.
Regarding the negative wave (A2) that follows the spike (fig. 6-b), the model showed that the amplitude was relatively proportional to the amplitude of the spike component and was primarily influenced by AMPA conductance. Moreover, the results also revealed that this negative wave became more pronounced for decreased GABA conductance, as shown in figure 6 (transition from condition 3 to condition 4).
The above observations regarding features A1 and A2 also explain the results regarding the peak-to-peak value (A) of the
simulated spikes that decrease for increased GABA conductance and that increase for increased AMPA conductance (fig. 6-c).
Regarding the duration (D) of the simulated spikes (transition from condition 1 to condition 2), the model showed an interesting phenomenon. Indeed, spike duration can strongly increase, but within a specific range of AMPA conductance values. As shown in figure 6-d, for no or a slight increase of the AMPA conductance, the duration of the spike increased with both the NMDA and GABA conductances. However, for higher values of AMPA conductance, the duration of simulated spikes was found to decrease and to return to ‘control’ values.
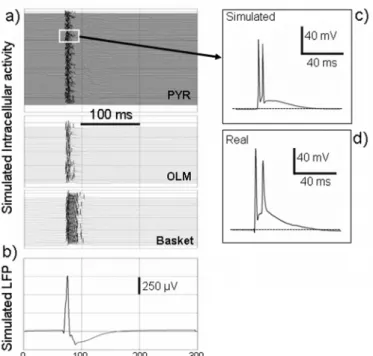
Finally, figure 7 illustrates another aspect of the model: the possibility to compare simultaneously extracellular field activity (fig. 7-b) and intracellular activity (fig. 7-a) of pyramidal cells and interneurons. In this example, it can be observed that during the interictal spike, pyramidal cells depolarize and fire several APs (fig. 7-c). This behavior could also be observed in the experimental data (fig. 7-d). At the same time, the firing of interneurons (especially basket cells) increases dramatically. This capability of displaying extracellular/intracellular activity simultaneously is
Figure 6: Color-coded maps showing the influence of model parameters (conductances associated with excitatory and inhibitory currents) on morphological features of simulated epileptic spikes (a-d). Features are coded from blue for weak values to red according to large feature values. For some parameter configurations, the model could generate oscillatory activity. In these cases, the results appear as black squares. See results for details. Right: Examples of morphologic changes induced by parameter variations. 1 → 2: increase of gNMDA leads to longer duration of the negative wave. 1, 2 → 3: increase of gAMPA influences the spike amplitude. 3 → 4: decrease of gGABA leads to a more pronounced negative wave following the positive component of the spike.
remarkable, in particular because interneurons are difficult to record from in in vivo experimental preparations. Therefore, the model can also be used to bridge “macroscopic” features of LFPs and “microscopic” activities taking place at the cellular level, independent of the cell type represented in the network.
VI. DISCUSSION AND CONCLUSION
Intracellular recordings are reasonably well described in terms of the properties of excitable membranes. In contrast, the interpretation of extracellular signals, in particular those reflecting the activity of neuronal networks, has proven to be a challenging and still unresolved issue. Difficulties mainly stem from the complexity of the recorded networks of neurons. The predominance of nonlinear mechanisms give rise to complex interactions that complicate the relationship between network activity and recorded activity. Computational modeling provides insights into this complexity as biologically-inspired models can act as bridges between sub-cellular/cellular/network parameters and electrophysiological observations [46]. As written by G. Buzsáki in the conclusion of his review paper about theta oscillations in the hippocampus [47], “In addition to
physiological experiments, several topics could benefit from computational models. For example, modeling extracellular current flow using networks of neurons may yield insights into the relative contribution of spiking and nonspiking neurons to local field potentials”.
We believe that the work presented in this paper is in line with this perspective, in the different context of epilepsy. Indeed, this study represents an attempt to identify relationships between “macroscopic” features (amplitude, duration, shape) of interictal events and the basic parameters involved in excitatory and inhibitory synaptic transmission (conductances associated with glutamatergic and GABAergic currents) in neuronal networks.
The main findings of this study are summarized below. First, the model was able to reproduce spikes relatively similar to epileptic spikes, not spontaneously but for a physiologically-relevant stimulation mimicking the input from CA3 to CA1. This result is in line with several experimental studies showing that the spontaneous generation of interictal spikes is abolished when the Schaffer collaterals are cut. This phenomenon is sometimes referred to as the “CA3-driven interictal activity” ([48], review in [49]). Aforementioned studies have also shown that CA3 pyramidal neurons can fire quasi-synchronously during interictal activity and that epileptiform patterns originating in the CA3 subfield can propagate to the CA1 area with delays of 5–15 ms. In the model, this effect is reproduced by the volley of quasi-simultaneous AP’s which reaches a subset of randomly selected pyramidal cells of the CA1 network. We also noticed that the model could generate epileptic spikes for of a sufficiently large subset (i.e. >30% of the total number of cells) of excited CA1 pyramidal cells.
Simulated events showed peak-to-peak amplitudes ranging from several hundreds of µV to 1 mV. These values are compatible with actual amplitude values and confirm that the assumptions we introduced for solving the forward problem (section III) are reasonable.
In this study, we assumed that each pyramidal cell contributing to the recorded LFP behaves as an elemental electrical dipole. We started from the fact that the synaptic activation of a given cell produces either a de- or a hyper-polarization at the soma or the dendrites. The subsequent cascade of modifications at the level of voltage-sensitive channels induces an intracellular current flowing along the longitudinal axis of the cell from the source to the sink formed at the dendrite and at the soma depending on whether the synaptic input is excitatory or inhibitory. This current (which is equal to the current flowing in the extracellular space according to the conservation equation) is computed from the dendritic and somatic membrane potentials at each cell that depend, themselves, on all transmembrane ionic currents we included in both compartments of our pyramidal cell model. In this respect, our study follows studies published elsewhere in which the authors also used the total transmembrane current to calculate the field potential [17, 20, 50, 51]. In addition, the dipole model allowed us to account for the position and orientation of the cells with respect to the electrode position, as both parameters have also an influence on the recorded field activity. Our study is in line with [52], in which authors make use of a 19-compartment pyramidal cell model to build a network for CA3 subfield. The net current dipole Qi in each
Figure 7: simulated intracellular activity versus extracellular field activity in pyramidal cells and interneurons during an epileptic spike. The early sharp positive component (“spike”) of the interictal event is caused by the synchronized activity of pyramidal cells at the very onset of the stimulation. Synchronized APs contribute to the LFP. The early “spike” component is followed by a slower negative wave explained by the sustained activity of interneurons. For this slow component, the synaptic activity of both interneurons and pyramidal cells (mixture of both gabaergic and glutamatergic currents) contribute to the LFP.
cell (produced by ionic and synaptic currents) is computed as the sum of current dipole Qi,k in each compartment k. Therefore, their approach accounts for longitudinal currents and their dipole solution is equivalent to the one we use in our model that includes 2 compartments at a small distance relative to the distance between cell units and electrode position.
Besides, we mentioned that both the dendritic and somatic membrane potentials of principal neurons contribute to the reconstructed LFP. This implies that the sharp component of the simulated epileptic spike reflects, in part, a contribution of APs generated at the soma of CA1 pyramidal cells in response to stimulation. This finding could be verified as the decrease of voltage-dependent sodium currents at the level of CA1 pyramidal cells led to the reduction of the “spike component” amplitude (not shown).
Second, the model highlights the major role of the AMPA conductance in both the generation of the spike and its amplitude. Our model also shows the influence of the NMDA and GABA conductance on spike amplitude. These results corroborate experimental findings showing that the non-NMDA receptor antagonist CNQX (20 µM) as well as non-NMDA antagonists abolished interictal spikes [53]. Regarding spike duration, the model shows that it could strongly increase but within a specific range of AMPA conductance values. Indeed, for a slight increase of AMPA conductance, the wave component was found to be more pronounced (and thus of longer duration) when NMDA and GABA conductances were increased. These results are also in line with experimental data showing that the duration of the late part of the extracellular interictal spike was reduced by the NMDA receptor antagonist APV [54]. In addition, it was shown in [55] that epileptiform activity can be related to the enhancement of AMPA receptor mediated synaptic transmission of CA3-CA1 synapses. This effect is dependent on new insertion of functional AMPA receptors into the postsynaptic sites to strengthen excitatory hippocampal synapses. Moreover, epileptiform activity induced NMDA receptor-dependent long-term potentiation of glutamatergic excitatory synapses. It can be argued that this effect was approximated in a very simple manner by enhancing AMPAergic conductances in our computational model.
Third, interictal spikes have long been considered as a prominent “marker” of epileptogenic networks although the exact relationship between spikes and seizures has been - and is still - a matter of debate [56, 57]. These events have been extensively studied during the past decades, especially from scalp EEG recordings where various approaches were proposed for detection (reviewed in [58]), counting [59] topographical analysis [60], localization of sources (reviewed in [61]), among other objectives.
Regarding depth-EEG signals, the literature is less abundant as intracerebral recording is only indicated for patients who are being considered for surgery. Methods have also been proposed to detect the origin of spikes [62] or to study their propagation, as they often involve several brain structures
[63].
However, to our knowledge, only few studies have accurately analyzed the morphology of human depth-EEG interictal spikes and have attempted to relate these characteristics to possible excitation or inhibition-related processes. Among these studies, the one performed by Alarcon et al. [5] is of particular interest since the authors found that sharper spikes could be generated close to primary epileptogenic regions. This finding is in agreement with our model since “sharp” spikes are generated for large increases of AMPA conductances, i.e. in hyperexcitable networks that could also occur in epileptogenic areas. Moreover, in the hippocampus, we often observed high-amplitude spikes just before seizure onset. Again, an increase in spike amplitude, in our model, is obtained for large increases of AMPA conductance.
Finally, in this study we restricted our analysis to the effects of specific network-related parameters on the shape of the spike. There are many other parameters to be studied with this model.
For instance, several studies demonstrated a potential role for gap junctions in the generation of epileptic activity, particularly in high frequency oscillations (review in [64]. At present, these were omitted in our model since the focus was primarily on interictal spikes. Connectivity patterns could also be considered as free parameters. Indeed, recent studies showed that network excitability is enhanced for particular configurations of connections between cells [65]. The influence of cell-related parameters should also be studied, as several reports reported that the properties of ion channels can be altered in epilepsy. Indeed, upregulation of excitatory glutamatergic receptors in the dentate gyrus has been observed in both human and animal models of hippocampal sclerosis and may contribute to the development of chronic seizures through increased excitatory transmission [66, 67]. Our approach allows these issues to be addressed in future studies as the model represents all of the main ion channels, and the ‘reduced’ pyramidal cells and interneurons maintain computation times for solving the differential equations at a reasonable level.
APPENDIX
The CA1 pyramidal cell model consists of a somatic compartment with membrane potential
V
s, and a dendritic compartment with membrane potential . Membrane potentials are governed by the following current balance equations: dV
( )
( )
( )
( )
( )
( ) ( )
(
)
_ _ sm Leak s Na s KDR s CaL s AHP SK c AHP BK s m s syn s d s
dV
C
I
V I V I
V I
V I
V
dt
g
I
V I V I
V V
I
p
=−
−
−
−
−
−
−
− −
− +
s( )
( )
( )
( )
( )
( )
( )
( ) ( )
(
)
_ _( )
1
d m d d d d d d dLeak Na KDR KA CaT CaR
c d d m d h d syn d s AHP SK AHP BK
dV
C
I
V
I V
I
V
I V
I
V
I
V
dt
g
I
V
I
V
I V
I V
I
V V I
p
=−
−
−
−
−
−
−
−
−
−
− −
− +
−
where p is the proportion of cell area taken up by the soma. Current equations are provided hereafter. Activation and inactivation kinetics are given by equations 3, 4 and 5 (text, section II.B).
1) Voltage-dependent sodium current [19, 26, 68-70]
(
)
2 Na Na NaI
=
g m h V E
−
( ) with ( )(
40 3)
inf1 1
Vm
=
+
e
− + ,h
inf=
1 1
(
+
e
((V+45 3) ))
and with τ =m 0.05ms and τ =h 0.5ms in equation 3.2) Voltage-dependent potassium delayed rectifier current [26, 68, 70]
²(
)
KDR KDR KI
=
g
m V E
−
.m
inf=
1 1
(
+
e
(− +(V 42 2) ))
and 2.2 m ms τ = .3) Fast inactivating potassium current [26]
(
)
KA KA K
I
=
g mh V E
−
withm
inf=
1 1
(
+
α
m( )
V
)
and( )
(
(
( )
)
)
(
)
max 0.1 (deg ) 1 ,0.1 m m V qt C m V τ = β +α( )
(
(
( ) ( ))
, with)
3 10 V V) 1QdegC mV
e
ξα
=
− +( )
(
(
( ) ( ))
,)
0.00039 V V) 1QdegC mV
e
ξβ
=
+( )
(
( ))
.(
40 / 5)
1.8 1 1 V V eξ
= − − + + , qt(
degC)
=5(degC−24 10) , Q(degC)=F/(R(T+degC))where R=8.315joules/degC, F=9.648×10⁴Coul, T=273.16 in
degrees Kelvin and degC the temperature in degrees Celsius.
( )
(
)
inf
1 1
hh
=
+
α
V
and time constant . and( )
max 0.26(
(
50 ,2)
)
h V Vτ
= +(
( )
(
0.003(V 56)Q(deg )C hV
e
α
=
+)
)
( )
hV
hV
β
=
α
.4) Hyperpolarization activated cationic current [26, 71]
(
)
h h hI
=
g m V E
−
withm
inf= −
1
(
1 1
(
+
e
− +(V 90) /8.5)
)
and ( ) ( )(
145 /17.5 (( 16.8 /16.5) ))
1
30
2
V V1
mif V
mV
e
e
otherwise
τ
− + +> −
⎧⎪
= ⎨
+
+
⎪⎩
0
.5) Voltage-dependent calcium currents [26, 72]
In the following, Cain denotes the intracellular concentration of calcium. The three types of calcium currents are Type T:
²
0.001
( ,
)
0.001
CaT CaT in inmM
I
g
m h
ghk V ca
mM ca
=
+
with( ,
)
(
1
(
(
.
V x)
2
)
)
(
)
in inghk V ca
= −
x
−
ca e
f V x
;(
)
0.0853
deg
2
x
=
T
+
C
and( )
1
( )
(
2
)
( )
10
41
zz
if abs z
f z
z e
otherwise
−⎧ −
<
⎪
= ⎨
−
⎪⎩
.( )
0.196
(
19.88
)
(
(V 19.88 /10)1
)
mV
V
e
α
= −
−
− −−
,( )
0.046
(V/ 22.73) mV
e
β
=
−( )
( )
and( )
(
)
(
)
1 0.68
hV
hV
τ
=
α
+
β
hV
.( )
0.00016
(V 57 /19) hV
e
α
=
− + ,( )
1
(
(V 15) /101
)
hβ
3(
CaR CaRI
=
g
m h V
V
=
e
− −+
)
. Type R: . The steady-state equations are CaE
−
( )(
e
− +V 48.5 3)
inf1 1
m
=
+
and ( )(
53)
inf1 1
Vh
=
+
e
+ and time constantsτ
m=
50
ms
,5
hms
τ
=
. Type L:0.001
( ,
)
0.001
CaL CaL in inmM
I
g
m
ghk V ca
mM ca
=
+
;( )
1 5
(
(
( )
( )
)
)
mV
mV
mτ
=
α
+
β
V
,( )
0.055
(
27.01
)
(
(V 27.01 / 3.8)1
)
mV
V
e
α
= −
+
− +−
and( )
( 63.07 /17)0.94
V mV
e
β
=
− + 6) Calcium pumping [26, 73, 74]The kinetics equations are given by:
(
)
10
0.2
0
/
0
CaI
F
if dc
mM
dc
otherwise
−
>
⎧
∑
= ⎨
⎩
ms
and(
0.0001
in)
200
dCa dt dc
=
+
−
ca
7) Calcium-dependent potassium currents [26, 73, 75]
SK-like (small conductance):
3 _ _
(
)
AHP SK AHP SK KI
=
g
m V
−
E
with(
)
inf1
m
=
Cac
+
Cac
and time constant( )
(
)
(
deg 22 /10)
max 1 0.003(1
)3
C,0.5
mCac
τ
=
+
−(
)
2/ 0.025
inCac
=
ca
with .BK-like (big conductance):
_ _
(
)
AHP BK AHP BK KI
=
g
m V E
−
( )
with ( )(
)
(
)
(
1.68)
0.48 1
0.18
VQV
e
α
=
+
− degC mca
in and( )
(
(
(
2 (deg ))
)
)
0.28 1
0.011
VQ C mV
ca
ine
β
=
+
−8) Muscarinic potassium current [22]
²(
)
m m KI
=
g m V E
−
withα
m( )
V
=
0.016
e
(V+52.7 / 23) and( )
( )/18.8β
0.016
V 52.7 mV
e
− +=
.We used the following set of standard parameter values. Reversal potentials were ELeak = -70 mV, ENa = 60 mV, EK = -80 mV, ECa = 140 mV and Eh = -10 mV. General parameters were gLeak = 0.18 mS/cm², with 5% noise on ILeak and gc = 1 mS/cm², Cm = 1 µF/cm² and p=15%. The conductance values in the control configuration were gNa = 70 mS/cm², gKDR = 6 mS/cm², gCaL = 0.5 mS/cm², gAHP_SK = 0.1 mS/cm², gAHP_BK = 2 mS/cm², gm = 3.1mS/cm² for the soma compartment; gNa = 10 mS/cm², gKDR = 2 mS/cm², gCaT = 1 mS/cm², gCaR = 0.75 mS/cm², gAHP_SK = 0.1 mS/cm², gAHP_BK = 0.1 mS/cm², gm = 0.1 mS/cm², gh = 0.4 mS/cm², gKA = 55 mS/cm² for the dendrites compartment.
APPENDIX 2
Inhibitory postsynaptic GABAergic current [29] was computed as . The activation
variable s was governed by
0.1 ( ) / 3.32
GABA GABA GABA
I =g s V E−
(
V
presyn)
(
1
s
)
0.07
s
=
10
− −
ds dt
F
where the transmitterrelease probability F(Vpresyn) was a function of the membrane potential of the presynaptic neuron
(
)
=
1/ 1
(
+
e
−Vpresyn/ 2)
presynF V
.Excitatory postsynaptic AMPA glutamatergic current [29]
was IAMPA=gAMPA0.1 (s V E− AMPA) / 3.32 with
(
)
(
)
1.1
ds dt
=
T
V
presyn1
− −
s
0.19
s
(
)
(
and(
)
2 / 2)
2.84 / 1
Vpresyne
− −=
+
presynT V
.NMDA current was computed as
( )
NMDA NMDA postsyn NMDA
I =g RB V −E 0.062
1/(1
Vpostsyn) /
B
=
+
e
−(
0
)
inf( )
0
infR t t
−
=
R
+
⎡
⎣
R t
−
R
(
. Implementation followed [73]. . As thepresynaptic spike arrives, it is assumed that a brief pulse of neurotransmitter C occurs in the synaptic cleft (the maximal concentration of C is Cmax between t0 and t1). R represents the fraction of open postsynaptic receptor open. During the pulse (from t = t0 to t = t1), C = Cmax, which gives
where
([Mg]/ 3.57)
(t t0 /) Rtaue
− −⎤⎦
)
inf0.072
max/ 0.072
maxR
=
C
(
0.0066
C
+
and)
max1/ 0.072
0.0066
tauR
=
C
+
(
1
)
( )
1
0.0066R t t
−
=
R t e
− −. After the pulse (t > t1), C = 0 and (t t1).
We used the following standard set of parameter values. For pyramidal cells: reversal potentials were EAMPA = 0 mV,
ENMDA = 0 mV, EGABA = -75 mV; the conductance values in the control configuration were gAMPA = 8 mS/cm², gNMDA = 0.15 mS/cm², gGABA = 25 mS/cm². For interneurons, reversal potentials were EAMPA = 0 mV, EGABA = -75 mV; the conductance values in the control configuration were gAMPA = 5 mS/cm², gGABA = 1.38 mS/cm².
REFERENCES
[1] F. Bartolomei, F. Wendling, J. Regis, M. Gavaret, M. Guye, and P. Chauvel, "Pre-ictal synchronicity in limbic networks of mesial temporal lobe epilepsy," Epilepsy Res, vol. 61, pp. 89-104, 2004.
[2] R. S. Fisher, W. R. Webber, R. P. Lesser, S. Arroyo, and S. Uematsu, "High-frequency EEG activity at the start of seizures," J Clin Neurophysiol, vol. 9, pp. 441-8, 1992.
[3] R. D. Traub, "Fast Oscillations and Epilepsy," Epilepsy Curr, vol. 3, pp. 77-79, 2003.
[4] F. Wendling, F. Bartolomei, J. J. Bellanger, J. Bourien, and P. Chauvel, "Epileptic fast intracerebral EEG activity: evidence for spatial decorrelation at seizure onset," Brain, vol. 126, pp. 1449-59, 2003. [5] G. Alarcon, J. J. Garcia Seoane, C. D. Binnie, M. C. Martin Miguel, J.
Juler, C. E. Polkey, R. D. Elwes, and J. M. Ortiz Blasco, "Origin and propagation of interictal discharges in the acute electrocorticogram. Implications for pathophysiology and surgical treatment of temporal lobe epilepsy," Brain, vol. 120 ( Pt 12), pp. 2259-82, 1997.
[6] S. Demont-Guignard, P. Benquet, G. Coiret, U. Gerber, and F. Wendling, "Interpretation of intracerebral-EEG epileptic spikes from detailed modeling of neural networks.," Processing of the 4th International IEEE EMBS Conference on Neural Engineering, in press., 2009.
[7] P. Andersen, R. Morris, D. Amaral, T. Bliss, and J. O'Keefe, The Hippocampus Book. New York, 2007.
[8] P. F. Pinsky and J. Rinzel, "Intrinsic and network rhythmogenesis in a reduced Traub model for CA3 neurons," J Comput Neurosci, vol. 1, pp. 39-60, 1994.
[9] A. L. Hodgkin and A. F. Huxley, "The components of membrane conductance in the giant axon of Loligo," J Physiol, vol. 116, pp. 473-96, 1952.
[10] A. L. Hodgkin, A. F. Huxley, and B. Katz, "Measurement of current-voltage relations in the membrane of the giant axon of Loligo," J Physiol, vol. 116, pp. 424-48, 1952.
[11] R. D. Traub and R. K. Wong, "Cellular mechanism of neuronal synchronization in epilepsy," Science, vol. 216, pp. 745-7, 1982. [12] R. D. Traub, R. K. Wong, R. Miles, and H. Michelson, "A model of a
CA3 hippocampal pyramidal neuron incorporating voltage-clamp data on intrinsic conductances," J Neurophysiol, vol. 66, pp. 635-50, 1991. [13] D. Golomb, C. Yue, and Y. Yaari, "Contribution of persistent Na+
current and M-type K+ current to somatic bursting in CA1 pyramidal cells: combined experimental and modeling study," J Neurophysiol, vol. 96, pp. 1912-26, 2006.
[14] M. Migliore, M. Ferrante, and G. A. Ascoli, "Signal propagation in oblique dendrites of CA1 pyramidal cells," J Neurophysiol, vol. 94, pp. 4145-55, 2005.
[15] E. N. Warman, D. M. Durand, and G. L. Yuen, "Reconstruction of hippocampal CA1 pyramidal cell electrophysiology by computer simulation," J Neurophysiol, vol. 71, pp. 2033-45, 1994.
[16] M. Migliore, "Modeling the attenuation and failure of action potentials in the dendrites of hippocampal neurons," Biophys J, vol. 71, pp. 2394-403, 1996.
[17] A. C. Almeida, V. M. Fernandes de Lima, and A. F. Infantosi, "Mathematical model of the CA1 region of the rat hippocampus," Phys Med Biol, vol. 43, pp. 2631-46, 1998.
[18] A. Kamondi, L. Acsady, X. J. Wang, and G. Buzsaki, "Theta oscillations in somata and dendrites of hippocampal pyramidal cells in vivo: activity-dependent phase-precession of action potentials," Hippocampus, vol. 8, pp. 244-61, 1998.
[19] M. Migliore, D. A. Hoffman, J. C. Magee, and D. Johnston, "Role of an A-type K+ conductance in the back-propagation of action potentials in the dendrites of hippocampal pyramidal neurons," J Comput Neurosci, vol. 7, pp. 5-15, 1999.
[20] P. Varona, J. M. Ibarz, L. Lopez-Aguado, and O. Herreras, "Macroscopic and subcellular factors shaping population spikes," J Neurophysiol, vol. 83, pp. 2192-208, 2000.
[21] E. Menschik and L. Finkel, "Cholinergic neuromodulation of an anatomically reconstructed hippocampal CA3 pyramidal cell.," Neurocomputing, pp. 32-33:197-205, 2000.
[22] P. H. Tiesinga, J. M. Fellous, J. V. Jose, and T. J. Sejnowski, "Computational model of carbachol-induced delta, theta, and gamma oscillations in the hippocampus," Hippocampus, vol. 11, pp. 251-74, 2001.