DECISION ELEMENTS IN THE DESIGN OF A CONSUMER ELECTRONICS ASSEMBLY PLANT
by
Thomas M. Furey B.S. Mathematics
United States Naval Academy (1986) M.S. Industrial Engineering
California State University Northridge (1994) Submitted to the Sloan School of Management and the Department of Mechanical Engineering in Partial Fulfillment of the Requirements for the Degrees of
OF TECHNOLOGY Master of Business Administration
and
Master of Science in Mechanical Engineering in conjunction with the
Leaders for Manufacturing Program at the
Massachusetts Institute of Technology
May 1999 twi) )J,
@ 1999 Massachusetts Institute of Technology. All Rights Reserved.
Signature of Author
---J Sloan School of Management
Department of Mechanical Engineering
Certified by " Stephen C. Graves
Abraham Siegel Professor of Management
Co-irectok Leadgs forl)(anuf (cturing Program Certified by
Stanley B. Gershwin Associate Director, Laboratory 1rManufacturing and Productivity
Senior Research Scientist, Department of Mechanipal Fngineering
Accepted by Acceped byLawrence S. Abein
Director of Master's Program
Sloan School-lQ V't
Accepted by
Ain Sonin ~U1AI
DECISION ELEMENTS IN THE DESIGN OF A CONSUMER ELECTRONICS ASSEMBLY PLANT
by
Thomas M. Furey
Submitted to the Sloan School of Management and the Department of Mechanical Engineering in Partial Fulfillment of the Requirements for the Degrees of
Master of Business Administration and
Master of Science in Mechanical Engineering
Abstract
This thesis is the result of a six-month internship at Celestica, Inc, an electronics contract manufacturer. The internship period covered the entire design and construction process for a new personal computer final assembly plant.
The main purpose of this thesis is to document the process that was followed at Celestica. Factors affecting the major decisions that were made will be discussed, as well as howN they are affected by the product and the manufacturing process, and their effect on the design of the factory.
The design process at Celestica consisted of six steps: Benchmarking and research, design concept development, design guideline development, detailed design process, material and
personnel requirements development, and procedure definition. This design process enabled the use of a cross-functional team to make decisions on factors which affected different functions of the plant, and provide guidance that allowed individual team members to work on design elements that would be compatible with the rest of the design. The key to this design method was the
development of design guidelines, within which team members could work individually.
One of the primary decisions the team made was that the assembly process would be done in parallel. This decision was based on the variation of the process, dependencies between process steps, the length of the process, expected workforce skills and training, required assembly
equipment, demand variability and individual product demand volume.
A kitting system was designed to present material to assembly. This was based on the security requirements and risk of component part obsolescence, and the reduced inventory costs, increased process control, and high degree of product flexibility that the kitting system provided. Finally, the plant layout and personnel requirements were designed to balance the flow of material, not capacity. The assembly process was the desired system constraint. Other steps in the overall process provided capacity and inventory buffers that ensure the assembly process wouldn't be blocked or starved. The throughput of the plant is aligned as closely as possible to the theoretical capacity of the assembly bottleneck.
This design process led to a factory that is flexible enough to adapt to rapidly changing demand and product mix, while keeping costs at a minimum. Further research in the design of capacity and inventory buffers is recommended to enable future plant design efforts to more easily identify optimal design characteristics.
Thesis Supervisors: Stephen C. Graves, Professor of Management Stanley B. Gershwin, Senior Research Scientist
Acknowledgements
I would like thank my advisors, Dr. Stephen Graves and Dr. Stanley Gershwin, for
their support throughout my internship and the process of writing this thesis. I am sincerely grateful for their patience, understanding and guidance in leading me through this effort.
I would also like to thank the entire Celestica US3 Implementation team for their
acceptance of me as a team member, and their understanding and support of my needs. My special thanks goes out to Lanny Meade, my supervisor while on internship, who listened to my ideas, welcomed my input, and provided guidance and encouragement throughout the process. My experiences at Celestica were fantastic; being involved in the US3 project gave me exposure to processes and issues which will be invaluable to my growth as a manufacturing leader, and I learned a great deal from each of the talented Celestica employees with whom I worked.
As I'm sure all of those who have been exposed to it would agree, the Leaders for Manufacturing program at MIT provides an unparalleled educational experience to students interested in pursuing manufacturing as a career. The rich academic curriculum, and
especially the exposure to different manufacturing leaders, plants and experiences combine to produce an intensely rewarding two years. I am grateful for the opportunity to have been a part of this program, and look forward to continued contact and growth through the network of friends and colleagues I have been able to develop at MIT, Sloan and in industry.
Mostly, I would like to thank my wonderful family for the support and love they have given me throughout our time here. My children, Nicholas and Megan, have had to endure many hours without a father during my course of study. My wonderful wife Karen has been a friend, an advisor, and a truly understanding wife and mother, making up for my unavailability with our children, and forgiving my endless disappearances into the
Table of Contents
A BSTRACT ... 3
C hapter 1 Introduction ... 11
1.1 THESIS OBJECTIVES... 11
1.2 ORGANIZATION OF THESIS ... 12
Chapter 2 The Celestica Factory Design Process... 13
2.1 PRODUCTS... 13
2.2 FACTORY D ESIGN PROCESS... 14
2.2.1 Benchm arking and Research... 14
2.2.2 D esign Concepts... 14
2.2.3 D esign Guidelines ... 15
2.2.4 D etailed D esign Process ... 16
2.2.5 Material and Personnel Requirements Development... 16
2.2.6 Procedure D efinition ... 17
C hapter 3 The A ssem bly Process ... 18
3.1 PARALLEL VS. SERIAL A SSEMBLY... 18
3.1.1 Parallel Assem bly ... 18
3.1.2 Serial Assembly ... ... 19
3.1.3 Variability ofAssem bly Process... 20
3.1.3.1 Individual A ssem bler V ariation... 20
3.1.3.2 V ariation betw een A ssem blers ... 23
3.1.3.3 Sub-process V ariation... 24
3.1.3.4 Product V ariation... 25
3.1.3.5 Effects of Variation... 25
3.1.4 Line Dynam ics... 26
3.1.5
Quality
... 273.1.6 Equipm ent... 28
3.1.7 D em and Variability ... 28
3.2 D EDICATED VS. M ULTI-PRODUCT LINES ... 29
3.4 THE CELESTICA D ESIGN ... 30
Chapter 4 Material Positioning...32
4.1 KITTING ... .... ... ... 32
4.2 LINE-SIDE STOCKING ... 32
4.3 SECURITY ... 33
4.4 OBSOLESCENCE / M ATERIAL QUALITY ... 33
4.5 PROCESS CONTROL ... 34
4.6 INVENTORY A CCURACY / TRANSACTION COST ... 34
4.7 INVENTORY ... 35
4.8 INVENTORY D ELIVERY COSTS... 36
4.9 PRODUCT FLEXIBILITY ... 37
4.10 CHOOSING THE RIGHT M ETHOD ... 37
4.11 THE CELESTICA D ESIGN ... 39
Chapter 5 D esigning Capacity ... 41
5.1 THE THEORY OF CONSTRAINTS ... 41
5.2 TO C IN FACTORY D ESIGN... 42
5.2.1 Bottleneck Location... 42
5.2.2 Subordinating Other Operations... 44
5.2.2.1 A Queuing M odel ... 45
5.3 SUGGESTED FURTHER RESEARCH ... 49
5.4 THE CELESTICA D ESIGN ... 50
Chapter 6 Sum m ary ... 51
List of Figures and Tables
Figure 1: PC Final A ssem bly Process... 13
Figure 2: Parallel and Serial Assembly Schematic ... 19
Table 1 : Queuing Analysis of Serial and Parallel Structures... 22
Figure 3: Factors Affecting Assembly Structure ... 30
Figure 4: Raw M aterial Inventory... 35
Figure 5: Comparison of Material Delivery Methods... 39
Table 2: Capacity/Inventory Cost Model (M/M/1 Queue Network) ... 46
Chapter 1 Introduction
1.1 Thesis Objectives
This thesis is the result of a six-month internship at Celestica, Inc, an electronics contract manufacturer. The internship period covered the entire design and construction process for a new personal computer final assembly plant.
As we realized when beginning this effort, very little current literature can be found that discusses the factory design process, while myriad sources provide
information on improving current facilities. This may be because most companies engage in improvement projects almost continually, while new plants are built much less frequently. Another reason may be the uniqueness of factory designs, based on industry,
company, product, and the structure of the supply chain. Regardless of the cause, the lack of available resources on the factory design process led to a significant amount of effort in developing the general framework that was to be followed. This effort should be leveraged in future design efforts.
The main purpose of this thesis is to document the process that was followed at Celestica. Factors affecting the major decisions that were made will be discussed, as well as how they are affected by the product and the manufacturing process, and their effect on the design of the factory.
While designing the new facility, many decisions were made based on some combination of experience, intuition, analysis, and current industry "best practices." In many of these decisions, quantitative analyses were or could have been used to determine the effects of the alternatives considered on cost, quality, and time. This work will discuss some of the analytic techniques that were used, and attempt to develop and document methods of analysis that could have been used to predict these effects more accurately.
Finally, it is hoped that this work will provide a starting point for future factory design efforts at Celestica. While the design process was quick and effective, many hours were spent trying to discuss and understand the effects of various decisions on the
products, and the effects of both controllable and uncontrollable factors on the optimal design. This thesis obviously can't answer all of the questions nor provide guidance in most of the situations that will arise in the design of a factory, but it will document those factors that were addressed in this specific project.
1.2 Organization of Thesis
Chapter 2 will provide a description of the products that were to be built at the Celestica facility, the overall final assembly process, and the steps that occurred during the design process. The design criteria will be discussed, as well as some of the
guidelines that were developed to ensure the individual portions of the design effort could be integrated into an effective whole.
The following chapters will document some of the major decisions that were required in the design process, along with the factors that affected the decision and their effect on the rest of the design. Chapter 3 discusses the tradeoffs between serial and parallel assembly structures. In Chapter 4 the positioning of material within the plant will be addressed, and finally the design of capacity and the use of the Theory of Constraints will be discussed in Chapter 5. Chapter 6 will conclude the thesis.
Chapter 2 The Celestica Factory Design Process
2.1 Products
The design of a factory obviously depends on the product or products to be produced. It is therefore useful to discuss the characteristics of the product prior to
discussing the factory intended to manufacture it.
The factory that we designed at Celestica would house the final assembly of a line of personal computers. The products were of two types, a desktop model computer and a "mini-tower" computer. Both types would contain various configurations of
components; the basic chassis type could house different processors, motherboards, memory, hard drives, CD-ROM drives, floppy disk drives, and software. Units of each type could be shipped with various localization options (keyboards, software and manuals.)
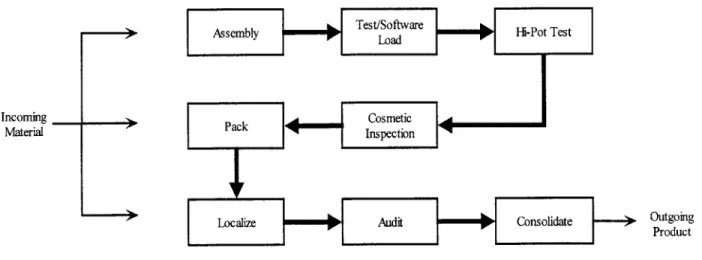
Although there were many configurations, the manufacturing processes for all types and configurations of this line of computers were very similar. The final assembly process for each of these configurations was approximately as shown in Figure 1.
Assembly Test/Software Hi1-Pot Test
Incomg Pack
MaterialPakIseto
Localize Audit Consolidate Outgoing
Product
2.2 Factory Design Process
The factory design process took about six months from the discussion phase through the implementation and initial production runs. The development of the design went through six distinct phases:
e Benchmarking and research * Design concept development * Design guideline development e Detailed design process
e Material and personnel requirements development e Procedure definition
2.2.1 Benchmarking and Research
The design process at Celestica began with research and benchmarking. Current "best practices" in the personal computer industry were reviewed through literature searches and factory visits. The Celestica design team then selected the processes that best fit with our ideas of how computers could most successfully be assembled and tested, and adapted those to our needs.
2.2.2 Design Concepts
Prior to engaging in detailed design discussions, the team agreed upon some overarching principles that would guide the design process. Some of these concepts were based on constraints in time and budgeting inherent in the project, some were based on the team's knowledge and experience in electronics manufacturing, and some were based on modem Operations Management theories.
These initial design concepts covered all areas of the future operation of the factory, including manufacturing, training, metrics, and management. Since we are only concerned here with the design of the physical factory, we will limit our discussion to those which applied to the layout and design of the shop floor areas. They were:
* Focus on time: total cycle time, dwell time, touch time, exception process times, time fences, etc.
* Propinquity between key sub-processes to promote quality, time and cost objectives * Theory of Constraints design of capacity
* Single-piece flow
e JIT-driven flows and queues e Minimal touch time
" Simple solutions - reduced number and complexity of automated systems
2.2.3 Design Guidelines
After generating the overarching design concepts, the team then began to discuss the details of what the factory should look like, and how it should operate. The factory designs that were observed through research and benchmarking were reviewed, and parts of each of these were selected based on the design concepts. It was during this phase that the majority of the design formulation was done; once this was complete, a picture of what the factory would look like emerged, with only the details left to be added.
The main guidelines that were defined during this phase included:
* Kitted material delivered to assembly * Parallel processes for assembly and test
* Sequential process for material positioning, kitting, hi-pot, cosmetic inspection, packing, localization, blind verification/audit, and order consolidation
The majority of this thesis will focus on the specifics of how these guidelines were developed. These guidelines became the defining characteristics of the factory; they provide for the efficient use of resources to minimize the cost of final assembly and test, and they provide flexibility for assembling different products and maintaining differing levels of capacity.
2.2.4 Detailed Design Process
Once the above guidelines were developed, the specific factory layout was defined. Because the guidelines had been developed as a cross-functional team, the individual team members were now able to design their areas of the plant's layout, without risk of incompatibilities between functional areas.
The detailed design process consisted mainly of comparing various vendors' workstations and abilities to customize their products to the specific tasks required in this factory. Many of the ideas for workstation design came from the benchmarking process. Once the workstations and work area equipment were defined, the biggest issue became space utilization. The factory building was under lease, and therefore the total factory area became a predefined constraint. The industrial engineer was tasked with designing a factory layout that would allow for capacity expansion up to forecasted demand levels, while providing for the functionality required for all of the raw material storage, assembly, test, shipping and support functions.
2.2.5 Material and Personnel Requirements Development
Once the layout of the factory was determined, simple formulae based on the expected hands-on cycle time for the different areas of the factory were developed in order to calculate the number of personnel required for different levels of production. This also led to the forecasted material requirements for workstations, conveyors, carts, flow racks and warehousing equipment. These forecasts were based on the expected
mean cycle times for the different operations: data that had been collected during the benchmarking phase. Required warehousing equipment was based on the planned inventory levels to be maintained in the factory, and the forecasted demand levels for the future.
2.2.6 Procedure Definition
The final phase of the factory design process was to install all of the equipment, verify the operation of the planned processes, and to develop procedures that would be used for training and execution. As these procedures were developed, the errors in any assumptions were analyzed, and adjustments to the layout, equipment and personnel requirements were made.
Chapter 3 The Assembly Process
Most of the value that is added to the product in the industry under discussion occurs in the assembly process. While the assembly process generally takes less time than loading software or testing the machine, it is arguably more valuable to the end customer. Customers can and will load software, but choose not to assemble their machines from individual components.
Since the value of the assembly process makes it essentially the raison d' tre of the factory, one of the first decisions to be made in designing the factory layout will be the structure of the assembly process. This decision must include how the assembly process will be broken up in time and in space, and what portions of the process will be completed by what part of the workforce.
In a factory such as a computer final assembly plant, the assembly process development can be broken into two decisions. First, the team must decide whether the assembly process will be parallel or serial. Issues pertinent to this decision include the variability of the product assembly process, quality concerns, and demand volume. Once this decision has been made, the team must determine how different products or
variations will be assembled. Dedicated lines or stations can be setup for each distinct product or product family, or a single line or generic station can be used at which all of the different products will be assembled.
3.1 Parallel vs. Serial Assembly 3.1.1 Parallel Assembly
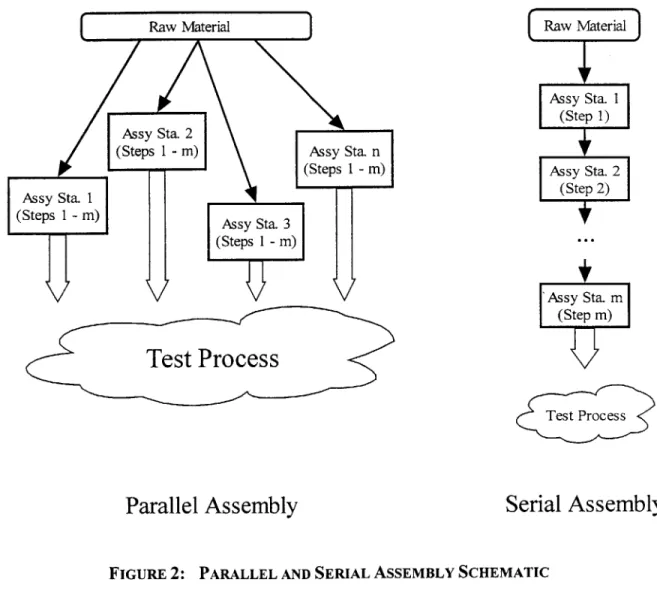
In a parallel assembly structure the entire assembly process is completed at a single station, with stations replicated based on cycle time in order to meet demand quantities. One or a small group of assemblers is responsible for the entire assembly process for units scheduled at their station.
3.1.2 Serial Assembly
A serial assembly process is more commonly known as an assembly line. The
assembly process is broken into individual steps, and completed by different assemblers in a specific sequence. Demand quantities are met by increasing the number of steps in the process, and thereby decreasing the cycle time at each individual step. As throughput requirements are increased, the amount of work on an individual unit performed by each assembler decreases. A schematic of serial and parallel assembly is shown in Figure 2.
Raw Material Raw Material
Assy Sta. 1
(Step 1) Assy Sta. 2
(sSte mp
(Steps 1 -m) n Assy Sta.
(Steps 1 - m) Assy Sta. 2
Assy Sta. 1 (Step 2)
(Steps 1 - m) Assy Sta. 3
(Steps 1 - m) -..
'Assy Sta. m (Step m)
Test ProcessP
Test Process
Parallel Assembly
Serial Assembly
3.1.3 Variability of Assembly Process
Variability within the assembly process may be the primary driver in selecting the assembly structure for a factory. Variations in the process can come from four major sources: individual assembler variation, variation between assemblers, sub-process variation, and product variation. There are other sources of variation that can affect the assembly process, such as variation in component quality, but most of these other sources' effects should be minimal in comparison to the above.
3.1.3.1 Individual Assembler Variation
Individual assembler variation is inherent in the fact that humans are responsible for the assembly process. Assemblers will become tired over time, or bored, or
distracted. There are many obvious reasons for this variation, but it is important to keep in mind that even a well-defined process performed by a well-trained assembler will produce results that vary through time. This variation can be easily observed and measured in an existing process. In designing a new plant, however, there may be little or no data with which to determine the magnitude of this variation. The design team must therefore use the limited data and their knowledge of the product to estimate the variation that will occur in the assembly of the product. One simple approximation that can be used for examining design tradeoffs is to classify the assembly times of
subsequent units of the same product for a single assembler as exponentially distributed. This approximation implies the following:
1. Individual unit assembly times are random, with a mean (1/t) and a standard
deviation (a,) equal to the mean (1/p).
2. Because they are exponentially distributed, the assembly step follows a
Poisson process. The process is said to be memoryless, or purely random.
(t, t+At) does not depend on t, where t represents the amount of time already spent in the assembly process.
3. The arrival stream must also be a Poisson process. The arrival stream can be
the orders arriving in the system, or the output of the prior step if a portion of the entire process is being modeled.
An advantage in this assumption is that a serial process can be modeled as a network of M/M/I queues and a parallel process as an M/M/c queue, where c is the number of assembly stations. A comparison of these queuing systems can help determine the effects of variation on inventory levels and lead time. A disadvantage is that it
assumes that learning does not occur, which must be accounted for at some point during the analysis. Also, assuming the standard deviation of assembly times equal to the mean probably overstates the variability of the process.
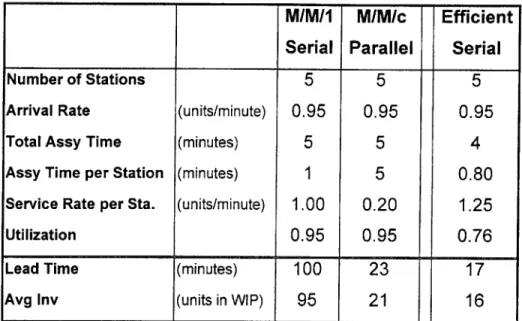
A queuing analysis using Markovian processes shows a distinct advantage for
parallel systems, due to the lack of inventory buildup between steps. This inventory buildup occurs due to the inherent variation in each step. The first two data columns in Table 1 show a comparison between serial and parallel systems using queuing analysis. The systems for comparison assume the same number of workstations, divided equally within the serial line (a "balanced" line with equal service rates) or in parallel. The same arrival rate into the system implies the total throughput will be the same, and the cost of capacity will be approximately the same because the same number of assemblers is required. The serial system generates much longer queues - inventory between stations -yielding a total lead time and total system inventory significantly higher than those in the parallel system. While this simple analysis assumes infinite buffer space between
process steps, it is obvious that introducing finite buffers would yield a higher probability of blocking in the serial system and therefore reduce throughput substantially.
This comparison assumes arrival times that are exponentially distributed. This would be similar to a kitting process, or can be assumed to model the receipt of orders into the system. Raw material inventory to support this system is not included in the comparison; however, it will be the same in both systems. The buffer prior to the initial process step represents a buildup of kits, which is greater in the serial line.
While the initial comparison between serial and parallel processes leads to distinct advantages in inventory and lead time for the parallel system, the last column in Table 1 show how some situations may favor a serial line. If, by subdividing the process,
economies of scale can be realized, then individual assembly step cycle times may be improved. This may result in a shorter lead-time and lower inventory than in a parallel
M/M/1 M/M/c Efficient
Serial Parallel Serial
Number of Stations 5 5 5
Arrival Rate (units/minute) 0.95 0.95 0.95
Total Assy Time (minutes) 5 5 4
Assy Time per Station (minutes) 1 5 0.80
Service Rate per Sta. (units/minute) 1.00 0.20 1.25
Utilization 0.95 0.95 0.76
Lead Time (minutes) 100 23 17
Avg Inv (units in WIP) 95 21 16
TABLE 1 : QUEUING ANALYSIS OF SERIAL AND PARALLEL STRUCTURES
system. While manufacturing and quality consultants have lately argued against F. W. Taylor's scientific management theories, there may be times when the assembly process is very complex, and advantages in cycle time can be gained by subdividing it. This may be due to special skills needed in different parts of the process, special tooling, jigs, or fixtures that require setup and therefore increase cycle time when used at a single station, or because of ergonomic advantages to breaking the assembly at specific points.
Economies may also be realized in capital equipment costs, since duplication of tools and stations might be avoided or reduced.
3.1.3.2 Variation between Assemblers
Individual assemblers will work at different speeds, and accomplish tasks at different rates. While standardized processes and effective training programs can help minimize the amount of inter-assembler variation, it cannot be fully eliminated. An operating plant can collect and analyze data that will help determine the magnitude and effects of this variation. However, in a factory design effort such as the one conducted at Celestica, the inter-assembler variation may be unknown. The factory design should therefore be robust enough to handle an expected amount of this type of variation, and standardized procedures and training programs should be developed in order to minimize its effect. The recruitment and hiring process should also attempt to match skills with required work, in order to ensure a high level of performance with a minimum of variability.
As stated, data on this type of variability may not be available in the design process. Data from comparable factories may give reasonable estimates of this
variability, but may not be available for similar products if these products are new to the company, as was the case at Celestica. However, this information should be easily attained and analyzed after the factory is in operation. In order to take advantage of the actual data when it is collected, the design should allow enough flexibility to change the design parameters that are affected by this type of variability.
In an electronics assembly plant such as Celestica's, there are very few processes that require large amounts of machine operation. The design parameter most affected by the variability between assemblers is the number of assemblers or stations required to meet a desired capacity. The physical design should be flexible enough to handle changes in the relative number of assemblers at different stages in the process.
This flexibility is more easily obtained in a parallel structure. As will be
discussed in Chapter 5, throughput may be more easily maintained if a line is structured from lowest capacity to highest. If a serial line is used, the breakdown of assembly steps will be designed in order to either balance the line or achieve a desired increase in
capacity at stations downstream of the bottleneck. Variation between assemblers may change the optimal line configuration, which can change on a shift-to-shift basis, or when
employees are rotated, added or reduced. In a parallel structure, by contrast, the variance between assemblers will affect the aggregate throughput of the assembly process, which may require additional or fewer parallel stations, but will not require a redesign of the process. It seems then that a parallel structure provides greater flexibility in adapting to variation between assemblers.
However, while a parallel structure is more tolerant of variation between assemblers, a serial structure may result in less variability since the process can not support it. The interaction between assemblers in a serial line may effect a "regression to the mean," which will result in lower total variability, but either a higher or lower
aggregate throughput than a parallel line. The assembler interaction effects, which will be affected by the training of assemblers, and management systems and metrics, should be considered as the design team decides between a parallel and a serial process.
3.1.3.3 Sub-process Variation
Sub-process variation is the difference in processing time for different steps within the assembly process. This variation occurs because of the discrete nature of the steps within the overall assembly process. While the previously discussed sources of variation are random, sub-process variation is caused by the design of the process and thus is controllable. If the overall assembly process takes t minutes to complete and there are n sub-processes, then the ideal time for each sub-process is t/n. However, because processes represent some combination of discrete tasks, it is likely that each
sub-process takes t/n + 6i, where i represents a positive or negative variation from the
average. This difference in processing times can result in blocking some stations and starving others, if there are finite buffers within the line. This will result in increased work-in-process inventory and reduced throughput. A process which contains many relatively simple tasks will be more easily broken in to steps of a similar duration, and will be more adaptable to a serial line. An assembly process which contains complex individual tasks, such as complicated wiring or difficult placement of parts, will most
likely have a lot of sub-process variation and would thus be more suited to a parallel structure.
3.1.3.4 Product Variation
Product variation occurs when more than one product is assembled on the same assembly line. The effect of this variation is similar to sub-process variation, except that it occurs dynamically. Similar to sub-process variation, this variation is a function of the design of the process and is thus controllable rather than random.
For an example of this type of variation, consider a three-step sequence for assembling products A and B. For product A, all 3 steps may have exactly the same average cycle time (i.e. the line is perfectly balanced.) Suppose product B is identical to product A except that one additional memory card is installed in step 2. Due to the addition of the time required to install this card, step 2 for product B will now be longer than step 2 for product A. Whenever there are units of product B at step 2, cycle times will differ between stations 1 and 2 and between stations 2 and 3, causing line imbalance. The variation causing this imbalance occurs only when product B is being assembled; when the line is full of product A, it is still perfectly balanced. Thus the variation
between sub-processes will be partially determined by the product mix being produced on the line at any point in time.
3.1.3.5 Effects of Variation
Any of the above types of variation seem to make a serial line less efficient than a parallel line. It would appear then that four conditions must be satisfied to justify using a serial line:
1. Efficiencies, due to learning or scale effects, must be increased by subdividing
2. Variation between assemblers must be minimized (through training and documentation)
3. Sub-process variation should be nearly eliminated (a balanced line)
4. Product variation must be minimal (a dedicated line)
Prior to discounting completely the serial line, the assumptions in the above analysis should be revisited. Recall that the service rate was assumed to be distributed exponentially. This assumption implies that the service time of a particular unit is
completely independent of history and of external forces. However, both the dynamics of the serial line and the learning process may invalidate this assumption, and provide benefits to a serial operation not found in a parallel structure.
3.1.4 Line Dynamics
The M/M/1 and M/M/c queue analysis above assumes that the service rate at a station is independent of history and of external forces. However, both of these may have a significant effect on the throughput of a given station.
If a service rate is exponentially distributed, then the probability that a unit will be
completed in the next instant after time Ti is the equal to the probability that a unit will be completed in the next instant after time T2. In reality, an assembler who averages
about 10 minutes to complete an operation will probably work faster if he's just taken 12 minutes assembling a specific unit, for fear that he is holding up the line. Thus it would seem that the service rate at a station may depend on history, and not be a true Markovian process as described above. Similarly, an assembler may work faster if he knows that the next station is idle, again invalidating the assumption of an independent process. In a serial line, the effect of this may be that the line speed is maintained by workers
"pushing" and "pulling" material through the line, enabling a higher throughput than in a parallel system in which these forces may not exist. The factory design team will need to estimate the magnitude of these effects when determining the structure of the assembly process.
3.1.5 Quality
The effect of line structure on product quality may favor either structure, depending on the predicted behavior of the assemblers. In a serial assembly line, the processes are broken down into smaller steps than in a parallel structure. After each
operation is complete, the next assembler in the sequence has the opportunity to quickly review the efforts of the previous assembler(s), and may be able to detect defects before the unit reaches the audit or test phases. Thus a serial line may result in a lower defect rate, and may enable defects to be detected earlier in the process, thereby reducing the
cost of rework required by minimizing the amount of disassembly necessary to repair the defect.
By contrast, in a parallel assembly process a defect introduced in the initial stages
of assembly may be overlooked or unknown to the assembler, and it therefore might not be detected until the test process has begun. However, an assembler may be more conscious of quality in that he or she is responsible for an entire unit. Individual pride and accountability may serve to motivate assemblers to pay more attention to detail. In a serial process, individual assemblers may feel less accountable for the quality of the finished product.
The judgement of the design team will again be required to determine which of these effects is expected to be greater. Factors affecting the magnitude of these effects include:
1. Length of the assembly process - in a parallel structure, a longer assembly process may increase the likelihood of defects being introduced.
2. Manufacturability of the product design - an assembly process that precludes the introduction of defects will decrease the impact of these effects.
3. Skills - training and experience may lead to a lower defect introduction rate or a higher/earlier detection rate.
4. Motivation - the motivation and pride of the assemblers may affect the level of defects introduced.
3.1.6 Equipment
The structure of the assembly process may in part be determined by the equipment required. If part of the assembly process requires the use of specialized machinery, a serial line may be the only effective way to organize assembly. This may be due to limitations in floor space based on the size of the equipment, its availability or its cost. In these cases, a hybrid structure may be desirable. For example, if the
product/process favors a parallel structure except for a single step that requires dedicated, expensive machinery, parallel processes on both the input and output side of the machine may be the optimal structure. Obviously, the processing required, capacity of the
machine and inventory required for support will all be factors in this design decision.
3.1.7 Demand Variability
If the demand for a product or group of products is highly variable, and the cost of additional assembly stations is high, the use of a serial line may be the most
advantageous. As demand increases for a product, assemblers could be added to the serial line to increase the throughput, with very little or no additional capital costs. In a process like the computer final assembly at Celestica, the adding workers to the line would require redefining the work instructions, re-balancing the line for the new number of assemblers. They would also require additional hand tools and perhaps some
additional bins for hardware. In a parallel line, by contrast, additional throughput will require additional workstations for the added assemblers. If these workstations are not available or are costly, the parallel structure will be disadvantaged. Work instructions will not need to be updated in a parallel structure. Similarly, decreasing throughput in a serial line may be as simple as removing assemblers from the line (and updating the work instructions.) In a parallel structure the material distribution process may be affected, and
valuable floor space might be filled with unutilized equipment. With variable demand, therefore, the cost of implementing changes to the serial line procedures should be weighed against the capital cost of additional workstations in a parallel line. If workstations are expensive or unavailable, a serial line may be favored.
3.2 Dedicated vs. Multi-product Lines
As discussed above, a dedicated (single product) serial line may minimize the throughput and inventory effects of variability, and be desirable for a specific product based on quality, equipment or other considerations. Obviously, if a serial line is dedicated to a specific product, the demand for that product must be large enough to justify the existence of the line. If the volume of demand for individual units is not
sufficient for maintaining dedicated lines, then a serial line would be required to service a mix of products. As was discussed above in the variability section, differences in the assembly times for different members of a product family will create bottlenecks in the line, reducing the throughput as compared to a parallel system assembling the same products. Therefore, if there are many different products with low demand per product, a parallel process should be reviewed. If a single product or configuration has a significant expected minimum demand level, a serial process may be preferred with a dedicated line servicing that product.
Chapter 4 discusses some of the inventory implications of parallel and serial lines.
If the demand level for a specific process is such that a dedicated line can be maintained,
there will be advantages not only in the assembly process, as detailed above, but in material delivery and inventory as well.
3.3 Summary
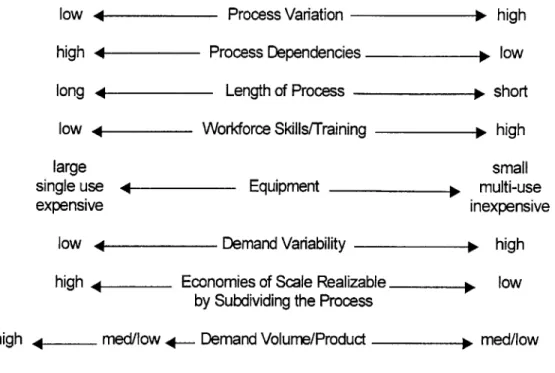
There are obviously many factors that influence the decision of whether to structure the assembly process in serial or in parallel. There is no "one size fits all" answer; individual circumstances will dictate which is more effective for a given product
Parallel Process
low i Process Variation y high
high 4 Process Dependencies y low
long 4 Length of Process y short
low 4 Workforce SkillsfTraining p high
large small
single use 4 Equipment y multi-use
expensive inexpensive
low 4 Demand Variability p high high - Economies of Scale Realizable y low
by Subdividing the Process
high w med/low 4- Demand Volume/Product y med/low
FIGURE 3: FACTORS AFFECTING ASSEMBLY STRUCTURE
or products, in a specific environment for an individual plant. Figure 3 depicts some of the relationships between the factors in the decision, and the recommended structure.
3.4 The Celestica Design
When determining the desired structure for the Celestica computer assembly factor, most of the above factors were taken into account. Although some specific data were not available, analysis of similar plants and knowledge of the planned process
enabled an effective analysis to determine the optimal structure.
* Process variation: The hand assembly process at similar factories was measured, and
the standard deviation of the assembly time was about 20% of the mean. Since
product variety was expected to increase dramatically after the initial production Serial Process
ramp-up, the process variation was expected to increase, favoring a parallel assembly structure.
* Process Dependencies: The dynamics of an assembly line favored a serial process. However, the increase in quality and accountability of a parallel process outweighed these advantages.
" Length of Process: The assembly time of each unit, regardless of configuration, was
expected to be less than 15 minutes. This time is short enough to allow individual assemblers to complete an entire unit without significantly reducing the total cycle time or increasing the probability of defects.
* Workforce Skills/Training: The labor force in the area and the relative attractiveness of the computer assembly plant environment would give Celestica the ability to employ highly skilled assemblers. Also, periodic training and management-by-fact (metrics) would maintain and enhance this high level of skills.
" Equipment: The assembly process required only hand tools, and workstations were
low-cost multi-purpose fixtures adaptable to all products.
" Demand Variability: Based on data in the customer contract, demand variability was
expected to be very high: +/- 20% within a given week. This variability was due to the inherent variability in the personal computer market.
" Demand Volume/Product: Forecasts from their customer indicated that demand for
any individual product would be medium; there was no single product or small group of products which would account for any significant portion of the demand on a regular basis.
Comparing the points above to Figure 3 validates Celestica's decision to
incorporate a parallel assembly structure in the plant. The flexibility in facilities layout and ability to react to changing demand were the key factors in this decision. Preliminary data from the first five months of actual production show that this decision was probably the correct one: throughput is very close to forecast, quality is high, and customer
Chapter 4 Material Positioning
The method by which material would be delivered to the assemblers is closely related to the assembly process decisions. In the electronics assembly industry, there are two primary methods for delivering material to the assembly floor: kitting and line-side stocking. The sections below will discuss each of these, their relative costs and benefits, and situations that favor one method over the other.
4.1 Kitting
In a kitting process, material is stored centrally. When an individual order arrives, enough material for one batch of production is "picked" from the storage area, by the use of a pick list generated from the order's Bill of Materials. This "kit" is combined in a tote or other device to hold the material, and contains only those parts required for one batch of a specific configuration of product.
4.2 Line-side stocking
If line-side stocking is used, parts are stored in relatively large quantities at their point of use. Thus if an assembly station is used for assembling 10 different
configurations of product, the parts required for each of those configurations would need to be stored at that station. The local storage quantity should be large to ensure that the assembler has enough parts of each type on hand to assemble any configuration that may be required.
Issues to be addressed in determining the appropriate method of material delivery include security, obsolescence and poor material quality, process control, inventory accuracy and transaction costs, inventory levels and delivery cost.
4.3 Security
Maintaining all stores of inventory in a central location allows a measure of security in the control of the physical inventory. If there are valuable parts that need to be protected from theft, or very fragile parts that should be protected from breakage or disturbance, there can be significant advantage to maintaining fewer storage areas throughout the plant. If line-side stocking is used, then security measures need to be put into place next to each of the assembly stations where the fragile or expensive parts are to be stored. Kitting, on the other hand, allows for storage in a single, protected
environment, and thus provides for more secure storage of these parts.
4.4 Obsolescence / Material Quality
In an industry like the personal computer industry, obsolescence of parts can cause rework of assemblies, test failures, excess inventories and poor customer relationships. It is imperative that obsolete parts be controlled and removed from production inventories as soon as possible. By maintaining a single source of raw material inventory for production, and issuing parts to the shop floor only when orders are released, the use of obsolete parts can be minimized. Obsolete parts can be removed from the kitting location as soon as Engineering Change Orders are processed. This is much more difficult with dispersed inventory locations, as would be the case if line-side stocking were used.
In a similar manner, reducing the areas where raw material is stored reduces the possibility that poor quality parts are used in final products. If a delivered lot of hard drives were found to be bad, for example, they could all be removed from the kitting and warehouse areas fairly simply. If line-side stocking were used, on the other hand, material control or quality personnel would have to screen parts at a variety of locations around the factory to ensure that poor quality parts weren't used. This could cause delays or production line shut downs until all of the bad parts could be accounted for, and could also cause rework if bad parts were assembled into units destined for the customer.
4.5 Process Control
Kitting provides a measure of process control that is not available with line-side stocking. When manufacturing many different products of similar but different
configurations, it is imperative that some measure of control be used to ensure that only the proper parts for each unit's desired configuration are used. While a thorough test routine provides some measure of control, current testing practices in industry are not robust enough to ensure that all parts are correct for the unit's configuration. Utilization of a kitting process provides two levels of configuration control: the kitter is responsible for putting the correct number of the correct parts into the kit. At the assembler's station, the assembler provides an additional check to ensure that the right parts are in the kit. Also, because the tote should be empty at the end of the assembly process, the kitting and assembly processes together help ensure that all required parts are in the assembly, and only the right parts are included. An equal number of opportunities for selecting
incorrect parts exists in both a kitting and a line-side replenishment system. In a kitting system the kitter is responsible for selecting the parts that make up the kit, while in line-side replenishment the assembler selects the parts as he assembles them. However, in a kitting system, the probability that an error makes it through assembly is reduced because the assembler essentially performs an audit of the parts in the kit. When line-side
stocking is employed, it is possible through operator error to include wrong parts, exclude parts, or install parts not desired for the configuration of the specific unit. There is no check of the parts in the machine until the unit is in test.
4.6 Inventory Accuracy / Transaction Cost
Dispersed inventory locations provide a greater number of transactions required to track inventory movement throughout the plant. Also, cycle counting and/or physical inventory procedures would require periodic counting of the inventory maintained at each assembly station, and any other inventory locations throughout the factory. By contrast,
use of a centralized kitting area reduces the number of inventory locations and the number of transactions required to update an inventory control system, thereby ensuring greater inventory accuracy and reduced transaction costs.
4.7 Inventory demand = dj std dev = a inv = 1.65o-1 *0 0 demand = demand = n n std dev= 0 std dev= ii n inv =l.6 50- inv =l.6 5
0-Note: a is the standard deviation of demand over the replenishment lead-time.
FIGuRE 4: RAw MATERIAL INVENTORY
Reduction of raw material inventory is a major advantage in using a kitting system for material positioning. As can be seen from Figure 4, the safety stock required in a line-side stocking system would be V-. times greater than in a kitting system, where
n is the number of stations at which inventory is stored. This rule-of-thumb is based on
the following assumptions:
1.
2.
Demand is normally distributed
Inventory is kept at a point high enough to ensure a certain service level of supply (in this case, we are using 95%)
Total Inventory
1.65a
3. Demand is equally distributed among each of the n stations
4. The replenishment time is the same in both systems (and equal to 1 in the example of Figure 4)
5. Replenishment frequency is the same for both systems
A significant point to note in this analysis is that n refers to the number of storage
locations for a single part, each servicing demand. If there are dedicated stations or lines for assembling units with unique parts, then n in this case is 1, and there is no difference between kitting centrally and stocking on the line in terms of inventory level.
4.8 Inventory Delivery Costs
Both methods of material delivery discussed have advantages and disadvantages in terms of cost. If a kitting system is used, parts must be delivered from the central warehouse (or vendor) to the kitting area. They are then picked into the individual kits, and the kit must be moved to the assembly station. When line-side stocking is used, the parts are delivered from the warehouse directly to the station(s) requiring them. The parts are then picked when needed by the assembler. No kit construction or movement is required.
When line-side stocking is the means for material delivery, delivery of parts from the warehouse to the assembly station(s) will require n-1 more deliveries than if kitting were used. The cost of these deliveries could be very high if there are many stations assembling each product. The total cost depends on the distance from the warehouse to the assembly stations, and the layout of the plant. For example, if a part can be delivered to all stations at the same time during each replenishment cycle, and if the warehouse is centrally located, then the cost of delivery may not be significantly greater than
delivering to a central kitting location.
The process of picking parts from a storage location to a kit is similar in both situations. Although a distinct kit is not produced with line-side stocking, the amount of
effort required for an assembler to gather individual parts from their bins is approximately the same as the effort required to build a kit.
Delivering the kit to assembly incurs a movement cost in a kitting system that is not incurred in line-side stocking. The location of the stations, time between deliveries and size of the deliveries will all affect these costs.
A kitting system will generally require higher capital costs to set up the kitting
racks, carousels, and/or material handling systems. These costs will generally be higher than the cost associated with the smaller storage bins required for line-side
replenishment.
4.9 Product Flexibility
Because parts are stored centrally, a kitting system provides the ability to respond more quickly to part and product changes. Locations and instructions need only be updated for the kitting area, while in line-side stocking instructions and locations at each storage location require updating. The nature of the product at Celestica necessitates frequent additions and changes to the bill of materials for assembled products, and new product introductions occur quite frequently. In this situation a kitting system provides an advantage in the ability to quickly add or remove components from the shop floor, with limited effect on the individual assembly station and instructions.
4.10 Choosing the Right Method
The method of material delivery will depend on the structure of the assembly process. If assembly is completed in a single serial line, line-side stocking will be most efficient since there will only be one delivery location for each part. Because of the single location, security and obsolescence can be addressed in the same manner as in a kitting system. Inventory levels will be the same, since n=1. The cost of movement will be less than in a kitting system, due to the absence of the kit movement to the line. Based on the information systems available on the line, the inventory accuracy and transaction
costs should not be distinctly different than in a kitting system. Process control can be addressed by ensuring that each successive assembler inspects or reviews the partially completed unit he receives from his upstream neighbor. In general, then, a dedicated or multi-product line will be better served by line-side stocking than with kitting. However, if security, obsolescence, and inventory accuracy can not be handled on the line in a cost-effective manner, kitting may provide a better alternative even though the material
movement costs are higher. Also, if the level of demand requires multiple serial lines, kitting should again be reviewed as a possible material delivery method due to its inherent advantages when n>l (i.e. when parts are stored in multiple locations on the shop floor).
Kitting is generally a more effective means of positioning material in a parallel assembly structure. A parallel structure will generally be chosen when product mix is high and individual product volume is low, or when demand for individual products is very volatile. Because the level of inventory is directly related to the demand for parts at the individual stations, the variability caused by these factors makes the cost of inventory in line-side stocking prohibitive. Further, the ability to provide security more easily, to mitigate the risk of obsolescence, and to reduce transaction costs and inventory
inaccuracy make kitting much more attractive than line-side stocking in a parallel assembly plant.
There are, however, some parts that may be better suited to line-side stocking in a parallel layout. Specifically, those items that have low risk of obsolescence and are low cost may be stored in large quantities on the line with very little effect on total inventory costs. Parts in this category are those generally referred to as "C" parts in a traditional
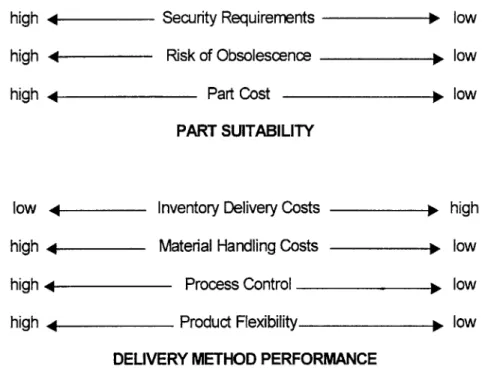
"ABC" analysis - hardware, common labels, etc. Since these items are generally small, stocking these on the line has the added advantage of minimizing the risk of stopping the line because a part was dropped, lost, or damaged. Figure 5 shows a summary of part characteristics that make parts suitable for different delivery schemes, and the relative performance measures of the two delivery methods discussed.
Kitting Line-Side Stocking
high 4 Security Requirements 1 low
high 4 Risk of Obsolescence y low
high 4 Part Cost y low
PART SUITABILITY
low 4 Inventory Delivery Costs y high
high 4 Material Handling Costs y low
high 4 Process Control y low
high 4 Product Flexibility y low
DELIVERY METHOD PERFORMANCE
FIGURE 5: COMPARISON OF MATERIAL DELIVERY METHODS
4.11 The Celestica Design
During the initial stages of the plant design at Celestica, kitting was selected as a method of ensuring good process control, security of the high-value raw material
inventory, and mitigating the risk of component obsolescence.
" Security Requirements: Many of the components used in the final assembly of personal computers are expensive, and availability is critical. Thus for
microprocessors, motherboards, memory, disk and CD-ROM drives, maintaining security was a critical factor in the material positioning decision.
* Risk of Obsolescence: Personal computer technology continues to change rapidly. When choosing a material positioning strategy, it was therefore critical for Celestica to ensure that obsolete parts could be located quickly and removed from production,
and that raw material inventories were minimized to reduce the financial risk of obsolescence.
The reduced cost of inventory in a kitting system outweighed the increased material handling costs. More importantly, however, the degree of process control and flexibility in supporting a changing product line that are afforded by a kitting system were key factors in the decision to implement kitting. "Wrong part" defects in assembly were at only 20% of the expected rate during initial production runs, and the kitting process was effective in maintaining a continuous flow of kits to the assembly stations.
Chapter 5 Designing Capacity
Once we have designed the structure of the manufacturing processes, we must determine the capacity of each of the different processes. The nature of the final
assembly process is such that there is inherent variability in each sub-process. Reducing this inherent variability is an essential objective of many improvement efforts such as the currently popular "Six Sigma" program from Motorola. Even the most successful
programs will not be capable of eliminating variability completely, however, and thus we should design the capacity and buffers in order to overcome this variability and ensure we can meet our throughput goals.
5.1 The Theory of Constraints
The Theory of Constraints (TOC), as developed by Eliyahu Goldratt (Goldratt and Cox 1984, Goldratt and Fox 1986, Fogarty, Blackstone and Hoffman 1991, Gardiner, Blackstone and Gardiner 1994), proposes five focusing steps for analyzing and improving manufacturing:
1. Identify the system's constraint(s)
2. Decide how to exploit the system's constraint(s)
3. Subordinate everything else to the above decision
4. Elevate (if necessary) the constraint
5. If, in the previous steps, a constraint has been eliminated (i.e. it is no longer
the system constraint), go back to step one.. .but do not allow inertia to become the constraint
One major implication of the above process is that the presence of a single constraint is assumed. The existence of a constraint may be argued, and probably can't be proved or disproved. However, in a hand assembly process, the variability inherent in a labor-intensive process nearly guarantees that there will be a bottleneck. Continually
predicting its location and protecting its throughput then become the challenge for the factory management. The factory design team has the ability to choose the location of the bottleneck, or to design a "balanced" factory, allowing variation to determine the location(s) of the bottleneck(s).
5.2 TOC in Factory Design
The five focusing steps above are intended to assist in better management of an existing plant. The use of Theory of Constraints in initial factory design has not been documented well, to my knowledge. When queried on the subjected, the Avraham Goldratt Institute (led by Eli Goldratt and a depository of Theory of Constraints knowledge) was not aware of any developments or publications on using TOC in the factory design process.
In attempting to apply the Theory of Constraints in the factory design process, two major areas should be addressed:
1. Location of the bottleneck
2. Subordinating the other operations to the bottleneck
5.2.1 Bottleneck Location
The first focusing step in the Theory of Constraints is to identify the bottleneck. Since the existence of a bottleneck within the factory is inevitable, the design process should include analysis of the optimal place for the bottleneck. The location of the bottleneck will depend on such things as the nature of the processes, capital equipment requirements, overall process flow, capacity measurement, and flexibility. The following characteristics are desirable in a bottleneck, and can be used to determine where to locate the bottleneck within the factory: