HAL Id: hal-00379347
https://hal.archives-ouvertes.fr/hal-00379347
Submitted on 29 Apr 2009
HAL is a multi-disciplinary open access
archive for the deposit and dissemination of sci-entific research documents, whether they are pub-lished or not. The documents may come from teaching and research institutions in France or abroad, or from public or private research centers.
L’archive ouverte pluridisciplinaire HAL, est destinée au dépôt et à la diffusion de documents scientifiques de niveau recherche, publiés ou non, émanant des établissements d’enseignement et de recherche français ou étrangers, des laboratoires publics ou privés.
Monitoring the interaction between DNA and a
transcription factor (MEF2A) using fluorescence
correlation spectroscopy.
Guillaume Octobre, Claudie Lemercier, Saadi Khochbin, Michel Robert-Nicoud, Catherine Souchier
To cite this version:
Guillaume Octobre, Claudie Lemercier, Saadi Khochbin, Michel Robert-Nicoud, Catherine Souchier. Monitoring the interaction between DNA and a transcription factor (MEF2A) using fluorescence correlation spectroscopy.. Comptes Rendus Biologies, Elsevier Masson, 2005, 328 (12), pp.1033-40. �10.1016/j.crvi.2005.07.007�. �hal-00379347�
Comptes Rendus de Biologie Volume 328, Issue 12, December 2005, Pages 1033-1040
Monitoring the interaction between DNA and a transcription factor (MEF2A)
using fluorescence correlation spectroscopy
Suivi d'une interaction ADN–facteur de transcription (MEF2A) par
spectroscopie à corrélation de fluorescence
Guillaume Octobre, Claudie Lemercier, Saadi Khochbin, Michel Robert-Nicoud and
Catherine Souchier
,*
Inserm U309, institut Albert-Bonniot, domaine de la Merci, 38706 La Tronche cedex, France * Corresponding author.
Presented in the framework of the European workshop on Fluorescence Correlation – Spectroscopy Techniques Applications in Biology, Medicine and Pharmacology, Faculty of Medicine of Paris-Sud, Le Kremlin-Bicêtre, France, 24 & 25 March 2005.
Available online 24 October 2005.
Abstract
Fluorescence correlation spectroscopy (FCS) is an analytical method that allows distinguishing different populations of fluorescent probes in solution and provides data on their concentrations and their diffusion coefficients. FCS was used to characterize the interaction of the transcription factor (MEF2A) with its DNA target sequence. The myocyte enhancer factor 2 (MEF2) belongs to the MADS-box family and activates transcription of numerous muscle genes during myogenesis. Measurements were made using TAMRA-labelled oligonucleotide duplexes derived from a wild type (WT) or a mutated MEF2 target gene. Binding of the protein to the WT DNA resulted in significant changes of the diffusion. Specificity of the interaction was confirmed using the mutated DNA. Bound to free probe ratios were determined at different MEF2A concentrations and the apparent equilibrium dissociation constant KD for the full-length MEF2A was estimated.
Résumé
La spectroscopie à corrélation de fluorescence (FCS) est une méthode qui permet de distinguer en solution plusieurs populations de molécules fluorescentes et d'estimer leurs concentrations et leurs constantes de diffusion. La FCS a été utilisée pour caractériser l'interaction entre un facteur de transcription (MEF2A) et sa séquence cible sur l'ADN. Le facteur de transcription MEF2 Myocyte enhancer factor 2 appartient à la famille des protéines à MADS-box et active la transcription de plusieurs gènes musculaires pendant la myogenèse. Des mesures FCS ont été réalisées sur des oligonucléotides double brin marqués au TAMRA et correspondant à la séquence consensuelle (WT) ou mutée (Mut) du site de liaison ADN/MEF2A. La liaison MEF2A sur son site d'interaction (WT) se traduit par un allongement significatif du temps de diffusion. La spécificité de l'interaction a été confirmée par l'utilisation de la séquence mutée (Mut). La FCS a permis d'évaluer le rapport libre/lié pour plusieurs concentrations de MEF2A et la constante de dissociation apparente KD.
Keywords: DNA-binding; MEF2; MADS box; Fluorescence correlation spectroscopy
1. Introduction
Fluorescence correlation spectroscopy (FCS) is an analytical method that allows distinguishing different populations of fluorescent probes in solution and provides data on their concentrations and their diffusion coefficients [1], [2], [3] and . The main advantages of FCS are: the capability to perform rapid measurements, the small amount of material required and no needs for radioactive labelling. Typically, analyses are performed at a concentration of 4 nM in a 20-µl volume during 30 s. FCS is based on the analysis of fluctuations in fluorescence intensity that results from diffusion of molecules in and out an open small confocal volume (<1 fl). Data are analysed by autocorrelation function and fitted to diffusion models. FCS thus renders possible quantitative study of molecular interactions and binding kinetics. The DNA–protein binding processes can be followed by monitoring the change in translational diffusion time of fluorescent double-stranded oligonucleotides upon specific binding to the proteins.
In the present study, FCS was used to characterize the MEF2A–DNA binding process. MEF2 (‘Myocyte Enhancer Factor 2′) was originally identified as a muscle-specific DNA-binding factor that recognizes a conserved A/T-rich DNA sequence in the muscle creatine kinase (MCK) enhancer [5]. MEF2 has also been shown to have significant roles in neurons and other cell types [6] and [7]. MEF2 belongs to the MADS-box transcription factor family [8], [9], [10] and [11]. The MADS domain comprises 57 amino acids located at the extreme N-terminus of MEF2. This motif serves as a minimal DNA-binding domain and the additional adjacent 29 amino acid extension, referred to as the MEF2 domain, plays an important role in DNA-binding high affinity [12]. In contrast to the MADS motif, the MEF2 domain is specific to MEF2 proteins, which are encoded by four different genes in mammals,
Mef2A, Mef2B, Mef2C and Mef2D. MEF2 binds as a dimer to the core sequence (C/T)TA(A/T)4TA(A/G) found in numerous promoter of muscle specific genes [10] and [13]. Structural studies have shown that MEF2A makes contact both in the major and in the minor grooves of the DNA. DNA interaction is mediated exclusively by residues located in the MADS-box domain, whereas dimerization involved both the MADS-box and the MEF2 domains [14] and [15].
The goal of our study was to characterize the MEF2A–DNA equilibrium binding constant using FCS. A 23-mer DNA, containing a MEF2A consensus binding site, was labelled with TAMRA (6-carboxytetramethylrhodamine) fluorochrome and the binding process was monitored by FCS.
2. Materials and methods
2.1. Purification of MEF2A proteinHuman MEF2A cDNA was amplified by PCR from pMT2-MEF2A plasmid [3] using the following oligonucleotides, 5′ to 3′: sense CATGCCATGGCCACCATGGGGCGGAAGAAAATAC (NcoI site
underlined) and antisense CCGCTCGAGGGTCACCCACGCGTCCATC (XhoI site underlined). A Kozak sequence is present between the NcoI site and the initiation methionine codons in the sense
primer. The PCR product was cut with NcoI and XhoI and ligated in pET28a vector (Novagen) in frame with the C-terminal 6-Histidine tag. His-MEF2A was produced in E. coli BL21 upon isopropyl-1-thio-ß-d-galactopyranoside (IPTG) induction. Bacteria were lysed in 50 mM Tris pH 8 solution containing 300 mM NaCl, 0.5% NP40 and 1 mM PMSF and sonicated. Soluble proteins were then incubated with NiTA agarose beads (Qiagen) in the presence of 15 mM imidazole. After extensive washes, bound proteins were eluted with 250 mM imidazole and dialyzed against 20 mM Tris pH 7.5 solution containing 10% glycerol and 1 mM DTT, at 4 °C. The purified proteins were analysed by SDS-PAGE and Coomassie blue staining or by Western blot using an Histidine (PentaHis, Qiagen) or an anti-MEF2 antibody (C21, SantaCruz). Immunoreactive proteins were detected by chemiluminescence (ECL, Amersham Biosciences). For the estimation of MEF2 diffusion time, the protein was labelled using the ‘fluorolink Cy5 monofunctional dye 5-pack’ (Amersham-Pharmacia).
2.2. Oligodeoxyribonucleotides
The wild-type (WT) and the mutant (Mut) DNA used in the assays were derived from the mouse muscle creatine kinase (MCK) promoter: WT Oligo: 5′ TAMRA-CTCGCTCTAAAAATAACCCTGTC 3′
and its complementary strand without label; Mut. Oligo: 5′ TAMRA-CTCGCTCTAAggcTAACCCTGTC
3′ and its complementary strand. Nucleotides in bold represent the MEF2 binding site [3], mutated
nucleotides are in lower case. These HPLC-purified 23-mer DNAdeoxyribonucleotides were
purchased from Sigma-Genosys. Annealing was performed by heating to 80 °C a solution of 1:1 ratio of the complementary strands, followed by slow cooling to room temperature. The efficiency of the annealing procedure was verified by electrophoresis of the oligonucleotide duplexes on acrylamide gel. The TAMRA-labelled DNAs were purified through a Sephadex G-50 column (Amersham) for removing the free fluorochrome.
2.3. FCS analysis
FCS study was performed on the Confocor 2 system (Carl Zeiss, Jena, Germany) using a 40 X water immersion C-Apochromat objective lens (N.A. = 1.2). The measurements were carried out at room temperature in eight-well Lab-Tek I chambered coverglass (Nalge Nunc International). The 543-nm He–Ne laser beam was focussed into 20-µl solutions at 180 µm over the cover glass. The
fluorescence emission was collected through a pinhole and a 560-nm-long pass filter. Photon counts were detected by an Avalanche PhotoDiode (APD) at 20 MHz for 30 s. For each sample, FCS measurements were repeated 10 times. The data evaluation was performed using the Zeiss FCS Fit software. Most of the intensity autocorrelation curves were fitted using a free diffusion model with three components: the fluorochrome alone, the labelled DNA and the fluorescent DNA–protein complex. Preliminary studies enabled us to fix the diffusion time values of the first two components and the percentage of the first component (fluorochrome). Moreover, a calibration step with 4 nM Rhodamine 6G (R6G) made it possible to evaluate the size of the confocal volume (≈0.4 fl).
2.4. Interaction assays
Interaction assays were performed at room temperature in the following binding buffer (25 mM Hepes pH 7.9, 50 mM KCl, 0.5 mM EDTA pH 8, 5 mM MgCl2, 5 mM DTT, 10% glycerol, 0.002% NP40). 5 to
400 nM of MEF2A proteins (typically: 100 nM) were mixed with 5 nM DNA and 0.5 µg poly (dI)(dC) in 20 µl of binding buffer.
2.5. Theoretical calculation
Diffusion constants were compared to theoretical values calculated assuming globular or rod-like macromolecules. The diffusion constants of the globular molecules were calculated using:
(1)
with T the absolute temperature, k the Boltzman constant, r the molecular hydrodynamic radius and η
the viscosity of the medium. The radius r was calculated from the molecular mass m of the molecule:
, with NA the Avogadro number and ρ the mean density of the molecule.
The theoretical diffusion coefficient D of the oligonucleotide was calculated using [16]:
D=µchainT (2)
where µchain=k(ln(L/d)+ν)/(3πηL) for a cylinder with L the length of the DNA, d its diameter. For the
end-effect correction factor, ν, the theory proposed for the diffusion of rod-like macromolecule was used
ν=0.312+0.565/(L/d)−0.1/(L/d)2
taking into account the length (L, 78.2 Å for a 23 mer) and the diameter of the rod (d=23.8 Å).
2.6. Determination of interaction parameters by FCS
Given that MEF2 proteins are assembled as homo- and heterodimers and that dimerisation is a prerequisite for DNA-binding [9] and , and given the short size of the oligonucleotide, we have considered the binding of one protein dimer to a single binding site. The DNA-binding reaction may be represented by:
(3)
DNA* and Complex* are both fluorescent ( * ), and their concentrations may be evaluated using FCS.
Therefore, the binding constant K can be evaluated according to the following equation:
(4)
Moreover, the complex fraction, as expressed by Eq. (5), can be rearranged as Eq. (6). Therefore, this form was used for the estimation of the dissociation constant (KD), from non-linear curve fitting (Y;
f([free dimer]).
(5)
(6)
Excel (Microsoft, USA) and Origin (OriginLab, USA) software were used for data evaluation.
3. Results and discussion
3.1. Purification of MEF2A from E. coli
MEF2A protein was produced from E. coli upon IPTG induction. Bacteria lysates were then purified on nickel affinity column by the mean of a 6-histidine tag. The His tag was positioned at the carboxy terminus of the protein in order to minimize the possible interference with the N-terminal DNA-binding and dimerization domains (Fig. 1A). Coomassie blue staining of purified MEF2A showed the presence of the expected 62-kDa full length protein (Fig. 1B). Two minor bands were co-purified with His-MEF2A, one migrating around 50 kDa and the other close to 80 kDa. Like full length His-MEF2A, the 50-kDa protein was recognized by an anti-histidine and an anti-MEF2 antibody directed against the C-terminus of the protein (Fig. 1C). Therefore, the 50-kDa protein is likely to represent a truncated MEF2 protein. The identity of the 80-kDa protein is unknown. The DNA-binding ability of the purified MEF2A was verified by electrophoretic mobility shift assays using the MEF2 binding site derived from the muscle creatine kinase promoter that was used in subsequent FCS analyses (see sequence in
materials and methods). These assays indicated that His-MEF2A was capable of binding to the MEF2 binding site, whereas His-MEF2A binding was not observed with a mutated DNA probe (data not shown). Thus, purified His-MEF2A appeared to be functional for DNA-binding and the protein was used in FCS experiments to characterize the interaction between MEF2 and its cognate DNA sequence.
3.2. FCS Analysis
3.2.1. Diffusion parameters of free molecules
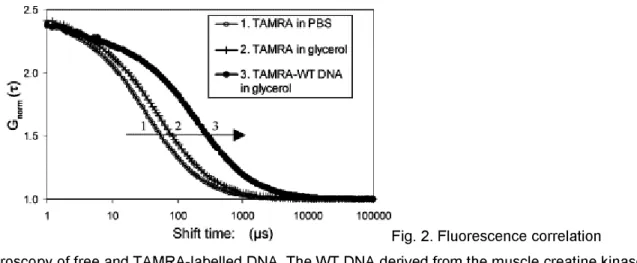
The diffusion coefficients of the different fluorescent molecules used in the assays were first estimated individually. Measurements were performed with about 4 nM sample solutions in PBS containing or not 10% glycerol. Autocorrelation curves are shown in Fig. 2 and the diffusion coefficients are listed in Table 1. As expected, mean diffusion times through the confocal volume increased both with molecular weight (Fig. 2, compare 2 to 3) and medium viscosity (compare 1 to 2) and were correlated with a decrease in diffusion coefficients (Table 1). The addition of glycerol led to a 1.2 fold increase of the diffusion times due to the change in viscosity. The medium viscosity was evaluated to 1.3 by comparing the diffusion measurements of TAMRA and Cy5 with theoretical data assuming a globular model (Eq. (1)). In our subsequent interaction assays, Rhodamine 6G, TAMRA and TAMRA–DNA were analysed at the beginning of each experiment. Rhodamine 6G analysis was used to estimate the confocal volume. On average, at 543 nm, the confocal volume was close to 0.4 fl with an axial axis of 0.23 µm, and a longitudinal axis of 2.7 µm. At the longest 633-nm wavelength used for Cy5 excitation, the axial axis was larger, about 0.3 µm. Corrections for the differences in volume were used to standardize the results. This explains why Cy5-MEF2A (λexc=633 nm) and TAMRA–DNA (λexc=453 nm)
have different diffusion times but equal diffusion coefficients (Table 1). Moreover, slightly different diffusion coefficients of Cy5-MEF2A and the DNA reflect the differences both in molecular weight and in shape: globular vs. rod-like (Eqs. (1) and (2)). In summary, our results illustrate that, as expected, diffusion coefficients strongly depend on viscosity, molecular mass and overall shape of the molecules. In our assays, preliminary analysis of TAMRA and TAMRA–DNA allowed us to set their diffusion times at fixed values for the analysis of interaction. A stepwise procedure improved the quality of the fits with additional components. The analysis of labelled MEF2A was performed in order to get an estimation of the protein diffusion (= 411 µs); however, in the interaction experiment, the label was on the DNA and not on MEF2A protein. The measured value is between the expected values for MEF2A dimer (451 µs) or monomer (357 µs), according to a globular model and under our experimental conditions at 633-nm excitation. However, due to the shape approximation involved in simple hydrodynamic models, FCS does not make it possible to discriminate, in our opinion, between monomer and dimer protein, only on the diffusion data. Our labelling process does not allow us to include additional data, such as concentration or count per molecule.
3.2.2. Interaction analysis between MEF2A and TAMRA-labelled DNA
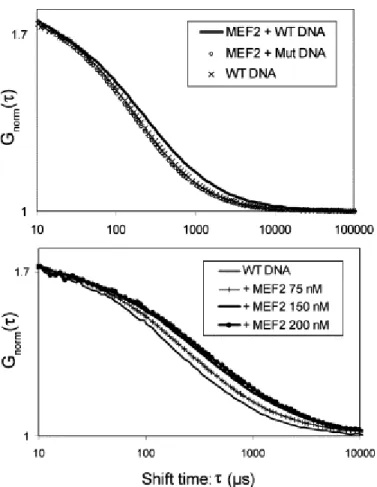
Interaction assays were first performed using MEF2A at a concentration of 100 nM and the wild type DNA (WT DNA) or the modified sequence (Mut. DNA). The normalised autocorrelation curves obtained with the WT DNA differ significantly from those obtained with the Mut. DNA or the DNA alone (Fig. 3A). The differences between the curves were more pronounced using higher concentrations of MEF2A (Fig. 3B). In this assay, the curves were shifted to the right, indicating the presence of, at least, an additional slowly diffusing component. The Mut. and WT autocorrelation curves were similarly fitted using a two- or three-component free diffusion model. The diffusion times of the first two components (TAMRA alone and TAMRA–DNA) were fixed from the experiments using these components alone, performed at the beginning of each experiment (see Table 1, for example). A third component was only found in the WT DNA case. The diffusion time of this component was significantly higher than that of the free DNA (>400 µs) and corresponds to the DNA–MEF2A complex. In the case of the Mut. DNA, the fit was not improved using the three component model, or the third diffusion value was close to that of the free DNA or the associated percentage was not significant. In summary, a significant diffusion change resulting from the binding of MEF2A to DNA was only observed with a consensus MEF2 binding site, whereas a mutated DNA sequence did not allow the interaction with MEF2A.
3.3. Binding constants
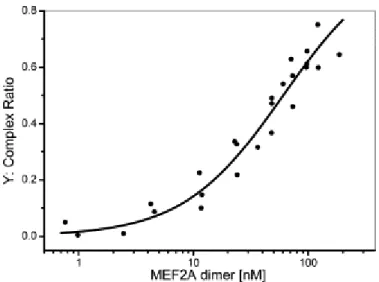
Interaction assays of MEF2A and DNA were performed using various MEF2A concentrations (5 to 400 nM). The results were adjusted using a three-component model: the fluorochrome, the fluorescent DNA and the MEF2A–fluorescent DNA complex. The complex ratios were estimated in each experiment and expressed relatively to the total concentration of MEF2A–TAMRA–DNA and TAMRA– DNA, excluding the free TAMRA fluorochrome (Eq. (5) in § Material and methods). The titration curve (Y=f[free protein]) was then non-linearly adjusted using the Levenberg–Marquardt algorithm (Origin software) (Fig. 4) and the apparent equilibrium binding constant (KD) of MEF2A dimers was estimated
to 60±4 nM (Eq. (6), χ2=0.003). The best fit was found using the simple model (Eq. (6)), and
cooperative binding was not observed, in agreement with crystallography data [14] and [15]. A binding constant equal to 110 nM was reported for MEF2C [18] and [19], but a significantly higher affinity (KD=0.5 nM) was published for MEF2A [20]. This difference might be explained by the fact that, in this
study, only the N-terminal region (amino acids 2–86) containing essentially the MADS-box and the MEF2 domain and another DNA length (60 mers) were used. Moreover, in our study, poly (dI)(dC) was added in the interaction buffer to prevent non-specific binding. Precise estimation of theoretical diffusion values for DNA/protein complex is difficult; however the diffusion time of the complex (>400 µs, typically 550 µs) is significantly higher than that of the free DNA and corresponds to the DNA– MEF2A complex with MEF2A most likely in the dimeric form. However, the presence of few DNA– multimer complex, corresponding to the second band showed by electrophoretic mobility shift assay by Berger et al. [20], or the contribution of the minor protein bands (Fig. 1) cannot be totally rejected.
To gain further information, cross correlation [21], [22] and [23] studies could be performed. Their main advantage would be to provide concentration and diffusion data both on the protein, the oligonucleotide and their interaction. However, exact standardization and the use of fluorochromes with shorter excitation wavelengths, such as FAM, for diminishing spectral crosstalk with Cy5, would be needed.
4. Conclusion
In conclusion, our study confirmed that FCS makes it possible to perform binding assays and to estimate the equilibrium binding constant (KD) [24], [25], [26], [27], [28] and [29]. The main advantages
of this technique are: few materials are required, no radioactive labelling is needed and the
experiments are performed in solution. However, measurements are possible using one fluorescent component, only if there is a significant difference in mass between free and bound components. Moreover, FCS made it possible to acquire time series (every 1–2 s) and thus should render possible the estimation of kinetic data (kass,kdiss) when the interaction and the dissociation process are slow
enough. However, modifications of the input system, such as automatic injection and mixing, would be necessary for monitoring the earliest time points.
In the case of MEF2A–DNA interaction, our results and those obtained for MEF2C [18] and [19] would suggest that MEF2 homodimers might bind to their DNA targets with a lower affinity than other MADS-box factor [30], [31] and [32]. Differences in the ability to bend DNA were also observed within the MADS-box family. In contrast to Agamous, SRF and MCM1, which induce a 70 ° bend in the target DNAs [30], [31] and [33], MEF2 proteins distort the DNA to smaller extent (15 to 19 °) [9], [14] and [15]. Moreover, crystallographic and NMR studies of MEF2A bound to DNA reveal that the MEF2 domain adopts a conformation considerably different from the corresponding region in SRF and MCM1 [15]. Altogether, affinity determination, kinetic parameters and structural analysis show that the MEF2 proteins represent a group of transcription factors with specific DNA-binding activities within the MADS box family.
Acknowledgement
The authors thank Prof. S. Konieczny (Purdue University, Indiana, USA) for the gift of the pMT2-MEF2A plasmid, J.J. Lawrence and M. Jamin (Grenoble, France) for helpful discussions and B. Batteux for technical help. This study was supported by INSERM and by the French Research Ministry.
References
[1] E.L. Elson, Fluorescence correlation spectroscopy measures molecular transport in cells, Traffic2
(2001), pp. 789–796.
[2] S.T. Hess, S. Huang, A.A. Heikal and W.W. Webb, Biological and chemical applications of fluorescence correlation spectroscopy: a review, Biochemistry41 (2002), pp. 697–705.
[3] E. Haustein and P. Schwille, Ultrasensitive investigations of biological systems by fluorescence correlation spectroscopy, Methods29 (2003), pp. 153–166.
[4] M. Gosch and R. Rigler, Fluorescence correlation spectroscopy of molecular motions and kinetics,
Adv. Drug. Deliv. Rev.57 (2005), pp. 169–190.
[5] L.A. Gossett, D.J. Kelvin, E.A. Sternberg and E.N. Olson, A new myocyte-specific enhancer-binding factor that recognizes a conserved element associated with multiple muscle-specific genes,
Mol. Cell. Biol.9 (1989), pp. 5022–5033.
[6] A. Han, J. He, Y. Wu, J.O. Liu and L. Chen, Mechanism of recruitment of class II histone deacetylases by myocyte enhancer factor-2, J. Mol. Biol.345 (2005), pp. 91–102.
[7] T.A. McKinsey, C.L. Zhang and E.N. Olson, MEF2: a calcium-dependent regulator of cell division, differentiation and death, Trends Biochem. Sci.27 (2002), pp. 40–47.
[8] F. Messenguy and E. Dubois, Role of MADS box proteins and their cofactors in combinatorial control of gene expression and cell development, Gene316 (2003), pp. 1–21.
[9] A.G. West, P. Shore and A.D. Sharrocks, DNA binding by MADS-box transcription factors: a molecular mechanism for differential DNA binding, Mol. Cell. Biol.17 (1997), pp. 2876–2887. [10] Y.T. Yu, R.E. Breitbart, L.B. Smoot, Y. Lee, V. Mahdavi and B. Nadal-Ginard, Human myocyte-specific enhancer factor 2 comprises a group of tissue-restricted MADS box transcription factors,
Genes Dev.6 (1992), pp. 1783–1798.
[11] P. Shore and A.D. Sharrocks, The MADS-box family of transcription factors, Eur. J. Biochem.229
(1995), pp. 1–13.
[12] J.D. Molkentin, B.L. Black, J.F. Martin and E.N. Olson, Mutational analysis of the DNA binding, dimerization, and transcriptional activation domains of MEF2C, Mol. Cell. Biol.16 (1996), pp. 2627– 2636.
[13] V. Andres, M. Cervera and V. Mahdavi, Determination of the consensus binding site for MEF2 expressed in muscle and brain reveals tissue-specific sequence constraints, J. Biol. Chem.270
(1995), pp. 23246–23249.
[14] K. Huang, J.M. Louis, L. Donaldson, F.L. Lim, A.D. Sharrocks and G.M. Clore, Solution structure of the MEF2A–DNA complex: structural basis for the modulation of DNA binding and specificity by MADS-box transcription factors, EMBO J.19 (2000), pp. 2615–2628.
[15] E. Santelli and T.J. Richmond, Crystal structure of MEF2A core bound to DNA at 1.5-Å resolution,
J. Mol. Biol.297 (2000), pp. 437–449.
[17] M. Tirado, C. Martinez and J. Garcia de la Torre, Comparison of theories for the translational and rotational diffusion coefficients of rod-like macromolecules. Application to short DNA fragments, J. Chem. Phys.81 (1984), pp. 2047–2052.
[18] D. Meierhans and R.K. Allemann, The N-terminal methionine is a major determinant of the DNA binding specificity of MEF-2C, J. Biol. Chem.273 (1998), pp. 26052–26060
[19] D. Meierhans, M. Sieber and R.K. Allemann, High affinity binding of MEF-2C correlates with DNA binding, Nucleic Acids Res.25 (1997), pp. 4537–4544.
[20] I. Berger, C. Bieniossek, C. Schaffitzel, M. Hassler, E. Santelli and T.J. Richmond, Direct interaction of Ca2+/calmodulin inhibits histone deacetylase 5 repressor core binding to myocyte
enhancer factor 2, J. Biol. Chem.278 (2003), pp. 17625–17635.
[21] N. Baudendistel, G. Muller, W. Waldeck, P. Angel and J. Langowski, Two-hybrid fluorescence cross-correlation spectroscopy detects protein–protein interactions in vivo, Chem. Phys. Chem.6
(2005), pp. 984–990.
[22] S.A. Kim, K.G. Heinze, K. Bacia, M.N. Waxham and P. Schwille, Two-photon cross-correlation analysis of intracellular reactions with variable stoichiometry, Biophys. J.88 (2005), pp. 4319–4336. [23] K. Rippe, Simultaneous binding of two DNA duplexes to the NtrC-enhancer complex studied by two-color fluorescence cross-correlation spectroscopy, Biochemistry39 (2000), pp. 2131–2139. [24] H. Xu, J. Frank, U. Trier, S. Hammer, W. Schroder, J. Behlke, M. Schafer-Korting, J.F. Holzwarth and W. Saenger, Interaction of fluorescence labeled single-stranded DNA with hexameric DNA– helicase RepA: a photon and fluorescence correlation spectroscopy study, Biochemistry40 (2001), pp. 7211–7218.
[25] F.W. Sevenich, J. Langowski, V. Weiss and K. Rippe, DNA binding and oligomerization of NtrC studied by fluorescence anisotropy and fluorescence correlation spectroscopy, Nucleic Acids Res.26
(1998), pp. 1373–1381.
[26] J. Vercammen, G. Maerstens, M. Gerard, E. De Clercq, Z. Debyser and Y. Engelbroghs, DNA-induced polymerization of HIV-1 integrase analyzed with fluorescence correlation spectroscopy, J. Biol. Chem.277 (2002), pp. 3845–3852.
[27] T. Kobayashi, N. Okamoto, T. Sawasaki and Y. Endo, Detection of protein–DNA interactions in crude cellular extracts by fluorescence correlation spectroscopy, Anal. Biochem.332 (2004), pp. 58– 66.
[28] J. Wolcke, M. Reimann, M. Klumpp, T. Gohler, E. Kim and W. Deppert, Analysis of p53 ‘latency’ and ‘activation’ by fluorescence correlation spectroscopy. Evidence for different modes of high affinity DNA binding, J. Biol. Chem.278 (2003), pp. 32587–32595
[29] T. Yakovleva, A. Pramanik, T. Kawasaki, K. Tan-No, I. Gileva, H. Lindegren, U. Langel, T.J. Ekstrom, R. Rigler, L. Terenius and G. Bakalkin, p53 Latency. C-terminal domain prevents binding of p53 core to target but not to nonspecific DNA sequences, J. Biol. Chem.276 (2001), pp. 15650– 15658.
[30] J.L. Riechmann, M. Wang and E.M. Meyerowitz, DNA-binding properties of Arabidopsis MADS domain homeotic proteins APETALA1, APETALA3, PISTILLATA and AGAMOUS, Nucleic Acids Res.
[31] L. Pellegrini, S. Tan and T. Richmond, Structure of serum response factor core bound to DNA,
Nature376 (1995), pp. 490–497.
[32] T.B. Acton, H. Zhong and A.K. Vershon, DNA-binding specificity of Mcm1: operator mutations that alter DNA-binding and transcriptional activities by a MADS box protein, Mol. Cell. Biol.17 (1997), pp. 1881–1889.
[33] S. Tan and T.J. Richmond, Crystal structure of the yeast MATa2/MCM1/DNA ternary complex,
Fig. 1. (A) Functional map of the MEF2A protein. The MADS box and MEF2 domains (86 amino acids), necessary for efficient DNA-binding and dimerisation, are present at the N-terminus of MEF2, whereas the major transcription activation domain is located between amino acid 274 and 373. The epitopes recognized by the antibodies used in this study are indicated. (B) Production and purification of His-MEF2A in Escherichia coli. SDS-PAGE gels with Coomassie blue staining show the induction of MEF2A in crude extract of bacteria treated (+) or untreated (−) with IPTG, and the purified protein used in FCS experiments. (C) Western blot analysis of crude extracts from induced (+)/uninduced (−) bacteria and of the purified protein with anti-His (left) and anti-MEF2 antibodies (right).
Fig. 2. Fluorescence correlation spectroscopy of free and TAMRA-labelled DNA. The WT DNA derived from the muscle creatine kinase promoter contains a MEF2 binding site. The normalised autocorrelation curves are shown for: (1) TAMRA in PBS, (2) TAMRA in 10% glycerol, (3) TAMRA–DNA. The inflexion points correspond to the mean diffusion times. The diffusion time increased with viscosity (1 to 2) and with molecular weight (2 to 3).
Fig. 3. Interaction between MEF2A and a TAMRA-labelled target DNA monitored by FCS. Experiments were performed with a fixed concentration of DNA (5 nM). (A) The normalised
autocorrelation curve was shifted to the right by mixing MEF2A (100 nM) with the WT–DNA, reflecting the presence of a slower component. By contrast, no shift was observed with the DNA having MEF2-binding mutation site, its autocorrelation curve being essentially similar to that of the WT DNA alone. (B) With increasing amount of added MEF2A protein (0, 75, 150 and 200 nM), the proportion of the slowest component increased and the autocorrelation curves were shifted to the right.
Fig. 4. Titration curve of MEF2A dimers for WT DNA (5 nM). MEF2A dimer concentration ranged from 0 to 200 nM. The protein-bound DNA fractions (Y) are plotted as a function of the protein dimer concentration in the binding medium. Each point represents the average of 10 measurements of 30 s. The solid line represents the fitted curve determined according to Eq. (3) in § Material and methods
Table 1.
Diffusion coefficients of the individual components
Molecular mass
Diffusion time (µs)
Diffusion coefficient (cm
2s
−1)
(g/mol)
in PBS
in 10% glycerol
Measured in 10% glycerol
Theoretical (1.3 viscosity)
Rhodamine 6G 479 38.6 ± 2.6 50.3 ± 2.7 2.9 ± 0.3×10⁻⁶ 2.9 × 10⁻⁶ TAMRA 430 35.0 ± 2.6 50.1 ± 3.2 2.8 ± 0.3×10⁻⁶ 2.8 × 10⁻⁶ Cy5 792 62.5 ± 1.9 80.1 ± 1.4 2.8 ± 0.2×10⁻⁶ 2.6 × 10⁻⁶ Cy5-MEF2A 54 800 ° – 411 ± 63 5.5 ± 0.3×10⁻⁷ 6.3 × 10⁻⁷○ 5.0 × 10⁻⁷○○ TAMRA–DNA 14 614 188 ± 29 220 ± 23 6.3 ± 0.5×10⁻⁷ 7.0 × 10⁻⁷ (23 mer)