HAL Id: tel-02949546
https://tel.archives-ouvertes.fr/tel-02949546
Submitted on 25 Sep 2020HAL is a multi-disciplinary open access archive for the deposit and dissemination of sci-entific research documents, whether they are pub-lished or not. The documents may come from teaching and research institutions in France or abroad, or from public or private research centers.
L’archive ouverte pluridisciplinaire HAL, est destinée au dépôt et à la diffusion de documents scientifiques de niveau recherche, publiés ou non, émanant des établissements d’enseignement et de recherche français ou étrangers, des laboratoires publics ou privés.
Machine Learning on Population Imaging for Mental
Health
Kamalaker Dadi
To cite this version:
Kamalaker Dadi. Machine Learning on Population Imaging for Mental Health. Medical Imaging. Université Paris-Saclay, 2020. English. �NNT : 2020UPASG001�. �tel-02949546�
Thè
se de
doctorat
NNT : 2020UP ASG001Machine learning on population
imaging for mental health
Thèse de doctorat de l’université Paris-Saclay
École doctorale n◦ 580, Sciences et technologies de
l’information et de la communication (STIC)
Spécialité de doctorat: Mathématiques et Informatique Unité de recherche: Université Paris-Saclay, Inria, Inria Saclay-Île-de-France, 91120, Palaiseau, France Référent: : Faculté des Sciences d’Orsay
Thèse présentée et soutenue à Palaiseau, le 14 septembre 2020, par
Kamalaker Reddy DADI
Composition du jury:
Michel Thiebaut de Schotten Président
Directeur de recherche, Groupe d’Imagerie Neurofonction-nelle (GIN), Université de Bordeaux, France
Sylvia Villeneuve Rapportrice & Examinatrice
Maître assistant, HDR, Department of Psychiatry, McGill University, Canada
Pierre Bellec Rapporteur & Examinateur
Maître de conférences, HDR, Centre de recherche de l’institut Universitaire de gériatrie de Montréal, Université de Montréal, Canada
Camille Maumet Examinatrice
Chargée de recherche, Empenn INRIA, Université Rennes I, France
Vincent Frouin Examinateur
Directeur de recherche, CEA Neurospin, Université Paris-Saclay, France
Gaël Varoquaux Directeur de thèse
Directeur de recherche, Parietal Inria, Université Paris-Saclay, France
Bertrand Thirion Codirecteur de thèse
Directeur de recherche, Parietal Inria, Université Paris-Saclay, France
Denis Engemann Invité
Chargé de recherche, Parietal Inria, Université Paris-Saclay, France
Josselin Houenou Invité
Directeur de recherche, Psychiatry Team, UNIACT Lab, Uni-versité Paris-Saclay, France
M A C H I N E L E A R N I N G O N P O P U L A T I O N I M A G I N G F O R M E N T A L H E A L T H
kamalaker dadi
Dissertation submitted in partial fulfillment of the requirements for the degree of Doctor of Philosophy.
Université Paris-Saclay
Sciences et Technologies de l’Information et de la Communication
October 2017 – September 2020
P H . D . C O M M I T T E E
director:
Dr. Gaël Varoquaux, Parietal Inria, Université Paris-Saclay, France codirector:
Dr. Bertrand Thirion, Parietal Inria, Université Paris-Saclay, France supervisors:
Dr. Denis Engemann, Parietal Inria, Université Paris-Saclay, France Dr. Josselin Houenou, CEA, Neurospin, Université Paris-Saclay, France
reviewers:
Dr. Sylvia Villeneuve, McGill University, Canada Dr. Pierre Bellec, Université de Montréal, Canada examiners:
Dr. Camille Maumet, INRIA, Université Rennes I, France
Dr. Vincent Frouin, CEA Neurospin, Université Paris-Saclay, France jury president:
Dr. Michel Thiebaut de Schotten, Université de Bordeaux, France
This thesis was prepared in Parietal team, at Inria Saclay and Neu-rospin, CEA, from October 2017 to September 2020. It was funded by the Institut national de recherche en informatique et en automatique.
c
Kamalaker Dadi, September 2020
A B S T R A C T
Mental disorders display a vast heterogeneity across individuals. A fundamental challenge to studying their manifestations or risk factors is that the diagnosis of mental pathological conditions are seldom available in large public health cohorts. Here, we seek to develop brain signatures, biomarkers, of mental disorders. For this, we use ma-chine learning to predict mental-health outcomes through population imaging i. e. with brain imaging (Magnetic Resonance Imaging (MRI)). Given behavioral or clinical assessments, population imaging can relate unique features of the brain variations to these non-brain self-reported measures based on questionnaires. These non-brain measure-ments carry a unique description of each individual’s psychological differences which can be linked to psychopathology using statistical methods. This PhD thesis investigates the potential of learning such imaging-based outcomes to analyze mental health. Using machine-learning methods, we conduct an evaluation, both a comprehensive and robust, of population measures to guide high-quality predictions of health outcomes.
This thesis is organized into three main parts: first, we present an in-depth study of connectome biomarkers, second, we propose a meaningful data reduction which facilitates large-scale population imaging studies, and finally we introduce proxy measures for mental health.
We first set up a thorough benchmark for imaging-connectomes to predict clinical phenotypes. With the rise in the high-quality brain images acquired without tasks, there is an increasing demand in eval-uation of existing models for predictions. We performed systematic comparisons relating these images to clinical assessments across many cohorts to evaluate the robustness of population imaging methods for mental health. Our benchmarks emphasize the need for solid founda-tions in building brain networks across individuals. They outline clear methodological choices.
Then, we contribute a new generation of brain functional atlases to facilitate high-quality predictions for mental health. Brain functional atlases are indeed the main bottleneck for prediction. These atlases are built by analyzing large-scale functional brain volumes using scalable statistical algorithm, to have better grounding for outcome prediction. After comparing them with state-of-the-art methods, we show their usefulness to mitigate large-scale data handling problems.
The last main contribution is to investigate the potential surrogate measures for health outcomes. We consider large-scale model compar-isons using brain measurements with behavioral assessments in an
imaging epidemiological cohort, the United Kingdom (UK) Biobank. On this complex dataset, the challenge lies in finding the appropriate covariates and relating them to well-chosen outcomes. This is chal-lenging, as there are very few available pathological outcomes. After careful model selection and evaluation, we identify proxy measures that display distinct links to socio-demographics and may correlate with non-pathological conditions like the condition of sleep, alcohol consumption and physical fitness activity. These can be indirectly useful for the epidemiological study of mental health.
R É S U M É
Les troubles mentaux présentent une grande hétérogénéité entre les in-dividus. Une difficulté fondamentale pour étudier leurs manifestations ou leurs facteurs de risque est que le diagnostic des conditions men-tales pathologiques est rarement disponible dans les grandes cohortes de santé publique. Ici, nous cherchons à développer des biomarqueurs, signatures cérébrales de troubles mentaux. Pour cela, nous utilisons l’apprentissage automatique pour prédire les résultats de santé men-tale grâce à l’imagerie de population, en se basant sur l’imagerie cérébrale (imagerie par résonance magnétique (IRM)). Compte tenu des évaluations comportementales ou cliniques, l’imagerie de popula-tion peut relier les caractéristiques uniques des variapopula-tions cérébrales à ces mesures autodéclarées non cérébrales basées sur des question-naires. Ces mesures non cérébrales fournissent une description unique des différences psychologiques de chaque individu qui peuvent être liées à la psychopathologie à l’aide de méthodes statistiques. Cette thèse de doctorat examine le potentiel d’apprentissage de tels résultats basés sur l’imagerie pour analyser la santé mentale. En utilisant des méthodes d’apprentissage automatique, nous effectuons une évalua-tion, à la fois complète et robuste, des mesures de population pour guider des prévisions de haute qualité des résultats pour la santé.
Cette thèse est organisée en trois parties principales : premièrement, nous présentons une étude approfondie des biomarqueurs du connec-tome, deuxièmement, nous proposons une réduction significative des données qui facilite les études d’imagerie de population à grande échelle, et enfin nous introduisons des mesures indirectes pour la santé mentale.
Nous avons d’abord mis en place une étude approfondie des connec-tomes d’imagerie afin de prédire les phénotypes cliniques. Avec l’aug-mentation des images cérébrales de haute qualité acquises en l’absence de tâche explicite, il y a une demande croissante d’évaluation des modèles prédictifs existants. Nous avons effectué des comparaisons systématiques reliant ces images aux évaluations cliniques dans de
nombreuses cohortes pour évaluer la robustesse des méthodes d’ima-gerie des populations pour la santé mentale. Nos résultats soulignent la nécessité de fondations solides dans la construction de réseaux cérébraux entre les individus. Ils décrivent des choix méthodologiques clairs.
Ensuite, nous contribuons à une nouvelle génération d’atlas fonc-tionnels du cerveau pour faciliter des prédictions de haute qualité pour la santé mentale. Les atlas fonctionnels du cerveau sont en effet le principal goulot d’étranglement pour la qualité de la prédiction. Ces atlas sont construits en analysant des volumes cérébraux fonc-tionnels à grande échelle à l’aide d’un algorithme statistique évolutif, afin d’avoir une meilleure base pour la prédiction des résultats. Après les avoir comparés avec des méthodes de pointe, nous montrons leur utilité pour atténuer les problèmes de traitement des données à grande échelle.
La dernière contribution principale est d’étudier les mesures de substitution potentielles pour les résultats pour la santé. Nous consi-dérons des comparaisons de modèles à grande échelle utilisant des mesures du cerveau avec des évaluations comportementales dans une cohorte épidémiologique d’imagerie, le UK Biobank. Dans cet ensemble de données complexe, le défi consiste à trouver les cova-riables appropriées et à les relier à des cibles bien choisies. Cela est difficile, car il y a très peu de cibles pathologiques fiables. Après une sélection et une évaluation minutieuses du modèle, nous identifions des mesures indirectes qui sont en corrélation avec des conditions non pathologiques comme l’état de sommeil, la consommation d’alcool et l’activité physique. Ceux-ci peuvent être indirectement utiles pour l’étude épidémiologique de la santé mentale.
A C K N O W L E D G M E N T S
I am very grateful to my supervisors Gaël Varoquaux, Bertrand Thirion, Denis Engemann and Josselin Houenou for always being available at any time and for their valuable guidance. I warmly thank Sylvia Villeneuve, Pierre Bellec for reviewing this thesis as well as Camille Maumet, Vincent Frouin, Michel Thiebaut de Schotten for accepting to be part of my defense jury.
I thank all the members of the Parietal team for being great friends and amazing colleagues. I thank Régine Bricquet, Corinne Petitot, Stéphanie Druetta and Anne Vilant for their efficiency at handling administrative issues. Most of all, I thank my family, my parents and my wife for their patience and immense support. Finally, I thank Inria for funding my thesis.
C O N T E N T S
1 introduction 1
1.1 Overview of the thesis 1
1.2 A primer on MRI for Population Imaging 4 1.3 Conclusion 7
2 pipelines to best predict phenotypes from functional
connectomes 8
2.1 Population phenotypes studied 9 2.2 Estimating functional connectomes 10 2.3 Many choices of prediction pipeline 12
2.4 Guidelines for optimal modeling choices of prediction pipeline 16
2.5 Discussion 18 2.6 Conclusion 21
3 brain atlases to extract functional signals 22 3.1 Dimensionality reduction 22
3.2 Image-derived phenotypes for population
imag-ing 23
3.3 A scalable model and a very large fMRI dataset 24 3.4 Soft functional modes in practice 26
3.5 Region names: relation to anatomical structures 31 3.6 Validations for population imaging 31
3.7 Discussion 35 3.8 Conclusion 39
4 predicting proxy measures for mental health 40 4.1 Problem Statement 40
4.2 Proxy measures 41
4.3 Objectives of conceptualizing mental disorders 42 4.4 Brain features and Socio-demographics for predicting
modeling 43
4.5 Predictive model comparisons 46
4.6 Brain imaging complements socio-demographics for proxy measures 49
4.7 Classification groups are better discriminated with socio-demographics 50
4.8 Age is best predicted from MRI compared to other proxy measures 52 4.9 Conclusion 53 5 conclusion 55 6 synthèse en français 57 references references 61 vii
contents viii appendices
a review of predictive methods 84
a.1 Practices for imaging-based diagnosis 84
b tangent-space 85
b.1 Computing the tangent-space group average 85 b.2 Transforming covariance matrices 86
c imaging-based predictive models 88 c.1 Reproduced on high-quality datasets 88 d difumo extraction 90
d.1 Implementation details: model parameters 90 d.2 Input fMRI data 90
e image-derived proxy measures 96
e.1 Data acquisition details on UKBB samples 96 e.2 Data processing details on UKBB samples 97 e.3 More experiments 99
A C R O N Y M S
ADHD Attention Deficit Hyperactivity Disorder
ASD Autism Spectrum Disorder
AD Alzheimer’s disease
ADNI the Alzheimer’s Disease Neuroimaging Initiative
ADNI-DOD the Alzheimer’s Disease Neuroimaging Initiative
Department of Defense
AUC Area Under Curve
ANOVA Analysis of Variance
AAL Automated Anatomical Labeling
ACPI Addiction Connectome Preprocessed Initiative
ABIDE Autism Brain Imaging Data Exchange database
BOLD Blood Oxygenation Level Dependent
BET Brain Extraction Tool
BASC Bootstrap Analysis of Stable Clusters
COBRE Center for Biomedical Research Excellence
CanICA Canonical Independent Component Analysis
CamCAN The Cambridge Centre for Ageing and Neuroscience
CSF Cerebro-Spinal Fluid
dMRI Diffusion Magnetic Resonance Imaging
dMRI Diffusion Magnetic Resonance Imaging
DictLearn Dictionary Learning - `1
DOD Department of Defense
DiFuMo Dictionaries of Functional Modes
EPI Echo Planar Imaging
FDR False Discovery Rate
fMRI functional Magnetic Resonance Imaging
acronyms x
FoV Field of View
FA Fractional Anisotropy
GNB Gaussian Naïve Bayes
GLM General Linear Model
GM Gray Matter
HCP Human Connectome Project
i.i.d. independent identically distributed
IBC Individual Brain Charting
IDPs Image-derived Phenotypes
ICA Independent Component Analysis
ICVF Intra-Cellular Volume Fraction
ISOVF Isotropic Volume Fraction
ICBM International Consortium for Brain Mapping
KNN K-Nearest Neighbor
MTA Multimodal Treatment Study MCI Mild Cognitive Impairment
MO Tensor Mode
MEG Magnetoencephalography
MD Mean Diffusivity
MPRAGE Magnetization-Prepared Rapid Acquisition with Gradient
Echo
MNI Montreal Neurological Institute
MRI Magnetic Resonance Imaging
MIST Multiresolution Intrinsic Segmentation Template
MODL Massive Online Dictionary Learning
OD Orientation Dispersion index
PTSD Post Traumatic Stress Disorder TR Repetition Time
acronyms xi
ROC Receiver Operating Characteristic
RSVP Rapid-Serial-Visual-Presentation
ROIs Regions of Interest
RSVP Rapid-Serial-Visual-Presentation
SOMF Stochastic Online Matrix Factorization
sMRI Structural Magnetic Resonance Imaging
SVC Support Vector Classifier
TR repetition time
UK United Kingdom
UKBB UK Biobank
1
I N T R O D U C T I O N
1.1
overview of the thesis
Brain imaging holds the promise to provide an objective picture of brain states and structure, reflecting individual characteristics and dis-eases (Bearden and Thompson,2017; Biswal et al.,2010; Miller et al., 2016). There has thus been an important interest in finding the brain
imaging correlates of neurological and psychiatric diseases, in order to provide reliable markers of these diseases (Woo et al.,2017). On the
other hand, machine learning is expected to provide powerful infer-ence mechanisms to discover and leverage such markers. Hinfer-ence, until recently, machine-learning approaches to population imaging studies analysis have focused mostly on predicting individual clinical status from brain images acquired on individuals who are pre-stratified as healthy controls and patients (Arbabshirani et al.,2017). For instance,
a typical situation consists in discriminating normal versus major de-pression - a binary classification problem. These ongoing efforts have led to limited progress in psychiatry research, as manifested by the low accuracy of brain imaging-based predictions of clinical status (Ka-pur, Phillips, and Insel,2012). The patho-physiological mechanisms of
mental disorders are indeed complex to understand due to their vast heterogeneity in pathological conditions (Insel and Cuthbert,2015),
and therefore too unreliable for clinical translation.
Alternative strategies for understanding mental disorders have put some emphasis on characterizing the underlying biological changes ob-served through population imaging (Insel et al.,2010). This builds on
the observation that complex information embedded in brain imaging requires adequate intermediate representations to overcome noise and be relevant for individual characterization (Smith and Nichols,2018).
Large public health cohorts have emerged to allow the extraction of brain-imaging based signatures with statistical power (Collins,2012).
Yet, this analysis framework is limited by the lack of direct measures relevant to mental health. This challenge calls for studying the impact of risk factors —whether derived from imaging or behavioral data— on generic potential health outcomes. For instance, considering that e. g. personality traits like neuroticism are genetically linked to depres-sion, neuroticism may be a reliable proxy for mental health assessed through depression related questionnaires (Lahey,2009). We cast this
challenge as understanding brain-behavior relationships which can be achieved by linking the large-scale brain measurements to
1.1 overview of the thesis 2 ioral assessments such as responses to questionnaires on populations (Smith et al.,2015).
Statistical modeling is key in linking these unique population de-scriptions to psychopathology. The objective of using multivariate statistical methods in population imaging is thus two-fold: i) to extract sensible imaging patterns from multiple dimensions useful for per-sonal trait prediction; ii) to make predictions about health outcomes at single-subject level.
The following work is organized around three major research direc-tions, which have led to different series of contributions.
1.1.1 Methods for predicting outcomes
Chapter 2 focuses on outlining robust methods for imaging-based predictions. With the rise in population imaging and the many possi-ble modeling pipelines, there is a clear need to benchmark predictive models for clinical phenotypes, in order to select the most accurate and robust methods. This part relies on Resting-state functional Magnetic Resonance Imaging (rfMRI) data and many analytic steps, organized in pipelines, required to process rfMRI data. rfMRI is a widely used technique to study functional connectomes, i.e. quantitative functional connectivity models estimated from brain Regions of Interest (ROIs) sampled over the whole brain. A core goal is indeed to predict clinical phenotypes from functional connectomes. Achieving this requires to make several choices regarding modeling steps : brain parcellations schemes, connectomes extraction algorithms and machine learning methods for prediction. After exhaustive comparisons of state-of-the-art methods across diverse brain-imaging cohorts, this pstate-of-the-art provides guidelines and default choices for connectomes-based predictive mod-eling.
Published work
Kamalaker Dadi, Mehdi Rahim, Alexandre Abraham, Darya Chyzhyk, Michael Milham, Bertrand Thirion, and Gaël Varoquaux (2019). “Benchmarking functional connectome-based predictive models for resting-state fMRI.” In: NeuroImage 192, pp. 115 –134.
1.1.2 Scalable methods for high-quality predictions
Imaging-derived brain parcellations have received great interest and made enormous progress with the availability of large-scale brain im-age collections. In this Chapter3, we took the advantage of these large brain data collections to contribute new data-driven fine-grain brain parcellations using Stochastic Online Matrix Factorization (Mensch
1.1 overview of the thesis 3 et al.,2018), a scalable Dictionary Learning algorithm. We also discuss
the usefulness of these atlases from an analytical task standpoint and sketch some guidelines to choose brain parcellations for fMRI analysis, after comparing our atlases to the existing state-of-the-art pre-defined and driven functional parcellations. Task- and Rest-fMRI data-analysis, as well as data compression experiments are presented. To complete this contribution, we provide names to these parcels based on neuroanatomical landmarks.
Published work
Kamalaker Dadi, Gaël Varoquaux, Antonia Machlouzarides-Shalit, Krzysztof J. Gorgolewski, Demian Wassermann, Bertrand Thirion, and Arthur Mensch (2020b). “Fine-grain atlases of functional modes for fMRI analysis.” In: NeuroIm-age, p. 117126. issn: 1053-8119.
1.1.3 Predicting proxy measures for mental health
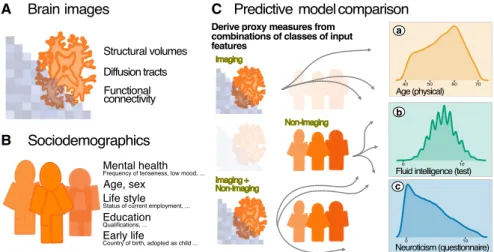
Finally, Chapter 4 investigates the use of potential proxy measures from an imaging epidemiological cohort aimed at studying mental health. It provides a conceptualization of the use of indirect mea-sures called proxies (self-reported meamea-sures to questionnaires) for mental health. This idea is tested through analysis of the UK Biobank cohort from a predictive modeling perspective. We combined both (self-reported) socio-demographic data and brain imaging data of each individual with a Random Forest model to perform the predictive modeling of behavioral outcomes. The outputs of such models com-bining population imaging and socio-demographic data are evaluated to assess whether there is an advantage in pooling imaging with socio-demographic variables. Finally, the best model comparisons are selected and predicted scores on each individual are gathered to corre-late with health outcome variables such as sleep, alcohol consumption and physical fitness to derive endpoints for mental health. This chap-ter concludes with a brief outline to the elements of an ongoing work that are not part of this manuscript.
Submitted to journal
Kamalaker Dadi, Gaël Varoquaux, Josselin Houenou, Danilo Bzdok, Bertrand Thirion, and Denis Engemann (2020a). “Beyond brain age: Empirically-derived proxy mea-sures of mental health.” In: bioRxiv. doi:10.1101/2020.08. 25.266536.
1.2 a primer on mri for population imaging 4
1.2
a primer on mri for population imaging
1.2.1 Brain connectivity and its relevance to neuroscience
Brain imaging techniques such as functional Magnetic Resonance Imaging (fMRI) or Magnetoencephalography (MEG) are a fundamental
tool for systems and cognitive neuroscience (Friston,2009). These brain
mapping methods can be used to understand the principles of brain organization such as brain connectivity, or the spatial organization of the brain networks underlying certain mental functions (Friston,
1994). Brain connectivity encompasses many dimensions: synapses,
ax-onal fiber pathways (anatomical connectivity), statistical relationships in the activity between remote regions (functional connectivity) or model-based interactions (effective connectivity). These relationships are defined among distinct units, where each unit or region is in prin-ciple composed of homogeneous neurons (Sporns et al.,2004). Brain
connectivity is a central topic of interest to elucidate the interregional connections of the nervous system.
estimates of brain connectivity Though connectivity can be seen as the core concept in systems neuroscience, brain mapping approaches can be categorized according to the signal that they mea-sure, and according to their goal (Bullmore and Sporns, 2009). A
core distinction lies in how they capture the patterns of connectiv-ity and whether these patterns could be used to understand brain function. Anatomical connectivity represents networks of neurons linked together through axonal pathways and synapses, forming dis-tinct structured-like representations of the brain (Sporns, Tononi, and Edelman, 2000). Anatomical connectivity can be investigated using
diffusion-weighted imaging techniques such as Diffusion Magnetic Resonance Imaging (dMRI). Such neuroanatomical structures ground our understanding of brain connectivity. Importantly, they do not in-form us on how these structures communicate between each other nor regarding how their interaction is modulated by experimental manip-ulations. By contrast, functional connectivity and effective connectivity are ways to quantify neuronal activations for instance measured at macroscopic level usingfMRI– a technique which indirectly measures the evoked or ongoing neural activity depending upon the regional metabolic demands Blood Oxygenation Level Dependent (BOLD) sig-nal changes in time – reveal regiosig-nal connectivity (static and dynamic interactions) (Rubinov and Sporns,2010).
Under no strict biological assumptions for e. g. micro-structural properties, functional connectivity estimates functional associations between remote brain locations based on their neurophysiological states or neural activity (Friston,1994). In contrast to effective
1.2 a primer on mri for population imaging 5 of one region over another one; instead it provides estimates of tem-poral associations without assessing directed effects (Friston,2011). In
terms of statistical modeling, given certain measurements of neural activity, functional connectivity analyses find patterns of connectivity that can be used as phenotypes to predict or classify individuals into specific groups e. g. clinical diagnosis (Fox and Greicius,2010). These
phenotypes are most often taken as the linear correlation coefficients among pairs of regions. In a nutshell, functional connectivity is dom-inantly used for classification problems i. e. attempts to establish a mapping from imaging data to a diagnostic label (consequences to cause) whereas effective connectivity analysis compares models of cause to consequences among brain states (Friston,2011). The study
of brain functional architecture with connectivity methods now spans from simple correlations to complex models (Smith,2012).
1.2.2 Brain function and structure for population analysis
functional connectivity Task-fMRI is used to map changes in
BOLD signal in brain areas that are involved in doing certain behav-ioral tasks. Functional connectivity may be investigated in regions defined by task-fMRI. In these scenarios, the analyses will be more confined towards task-evoked regions constrained to sparse functional architecture (Cole et al.,2014). However, it may be interesting to study
the functional coupling across multiple experimental conditions or across multiple trials (Rissman, Gazzaley, and D’Esposito,2004).
Beyond task-driven activity, most brain activity can be captured with
fMRIeven when subjects are not engaged in any of the tasks or simply stay at “rest” (Fox and Raichle,2007). This ongoing activity is observed
as resting-stateBOLDsignal fluctuations (of frequency < 0.1 Hz), and generally considered as some background activity observable even when the metabolic demands are at baseline level. These temporal fluctuations form coherent networks that are interesting to examine functional connectivity on large-scale populations (Greicius et al.,
2008). This ongoing brain activity should not be viewed as a random
noise, as it can influence task-evoked activity at the onset of the stimulus (Fox et al., 2006) and is strongly associated with the
task-evoked activity (Biswal et al.,1995), actually representing temporal
synchronization into networks (Luca et al.,2006; Raichle et al.,2001).
Resting-state functional connectivity thus demonstrates the presence of intrinsic human brain functional architecture even in the absence of behavioral tasks (Fox et al.,2005). Several applications have been
developed: i) relating functional connectivity to clinical status (Gre-icius et al., 2004), ii) to behavior (Miller et al., 2016), iii) predicting
psychological traits (Dubois et al.,2018a) and iv) deriving data-driven
1.2 a primer on mri for population imaging 6
brain structural analysis There exist other popular methods for population imaging. One is morphometric analysis of the struc-tural neuroimaging, concerned with the quantification of size, volume of brain structures and tissue types and their variations under neu-ropathologies or behavior (Lerch et al.,2017). For example, volume
changes in gray matter areas over lifetime are associated with: brain ageing (Ritchie et al., 2015), brain evolution (Evans, 2006), general
intelligence (’g’) (Cox et al.,2019) and brain disease (Thompson et al., 2007). Such volumes are calculated within pre-definedROIs(Desikan
et al., 2006) or voxel-wise (Ashburner and Friston, 2000). Another
popular method in structural neuroimaging i. e.dMRI, is concerned with the quantification of axonal pathways. Diffusion MRI enables to identify white matter tracts along principal diffusive direction of water molecules, as well as the connections between different gray matter areas (Behrens et al.,2003; Conturo et al.,1999). The study of
these local anatomical connections through white matter are relevant to the understanding of neuropathologies and functional organization (Saygin et al., 2016).
1.2.3 Challenges in population imaging
There are however important issues with resting-state based func-tional connectivity or morphometric analysis, namely the presence of many potential confounds (Smith and Nichols,2018). Unlike
task-based functional connectivity, resting-state does not represent a well-characterized haemodynamic response function. Neural signal is not separated from noise sources, whether physiology- or acquisition-related (Alexander-Bloch et al.,2016; Liu,2016; Power et al.,2017).
Moreover, subjects e. g. psychiatric patients may feel uncomfort-able while undergoing scanning and often move while sampling
BOLD time series. This motion-related time series may create spu-rious functional connectivity (Power et al.,2012) or false positives in
group studies (Reuter et al.,2015) if not addressed properly. These
population-specific effects are a typical confound when linking func-tional connectivity or morphological changes to clinical conditions (Pardoe, Hiess, and Kuzniecky,2016). Another well known issue is
subjects falling asleep during acquisition, which strongly corrupts the recorded signal (Laumann et al.,2016).
What can we do about it? Several denoising methods and pipelines have already been proposed for cleaning such noisyBOLDtimeseries signals (Behzadi et al.,2007; Caballero-Gaudes and Reynolds, 2017;
Ciric et al.,2017; Griffanti et al.,2014a). Following those
recommenda-tions, we made choices of confounds such as 10 CompCor (Behzadi et al.,2007) and 6 motion signals to regress them from pre-processed
BOLDtime series. CompCor confounds are extracted on whole-brain voxels and motion signals are extracted using common data
pre-1.3 conclusion 7 processing procedure on rawfMRI data as part of data analysis. In addition to confounds regression, signals are also normalized, de-trended and bandpass-filtered between 0.01 and 0.1Hz. These cleaning steps are commonly used while studying phenotypes from functional connectivity or during the raw data preprocessing. These non-noisy data are then used for prediction, which is studied in detail in Chap-ters2to4.
mri data preprocessing steps to mitigate confounds We use a standard protocol that includes: motion correction, fMRI
co-registration to T1-weightedMRI, normalization to the Montreal Neu-rological Institute (MNI) template using SPM121
, Gaussian spatial smoothing (FWHM = 5mm). The SPM based preprocessing pipeline is implemented through pypreprocess2
- Python scripts relying on Nipype interface (Gorgolewski et al., 2011). All subjects were
visu-ally inspected and excluded from the analysis if they have severe scanner artifacts or head movements with amplitude larger than 2mm. Confounds regression is done at signal extraction level in the functional-connectomes pipeline Section 2.3.1.3 implemented with Nilearn (Abraham et al.,2014a).
1.3
conclusion
In summary, we have sketched the context behind the contributions presented in this manuscript, and target a good use of brain imaging for population studies. We also gave a very brief introduction toMRI
for population imaging neuroscience that covers: brain structure and function for predicting population phenotypes and the importance of data preprocessing and introduction of standard preprocessing pipeline. In our thesis, we extensively worked on fMRI datasets. A note on the datasets that we used in preparation of this manuscript is openly-available downloaded under standard terms and conditions. We were not involved in any data acquisition.
1 www.fil.ion.ucl.ac.uk/spm/
2
P I P E L I N E S T O B E S T P R E D I C T
P H E N O T Y P E S F R O M
F U N C T I O N A L C O N N E C T O M E S
Functional images acquired during rest is a promising universal marker of brain function (Biswal et al.,2010). It can easily be acquired
on many different individuals, as it does not require any task per-formance, and is applicable to studying diseased populations. Many population-imaging studies userfMRIto relate brain imaging to neu-ropathologies or other behavior and population phenotypes (Dubois and Adolphs,2016; Miller and Alfaro-Almagro,2016).
A functional connectome or shortly connectome – a model character-izing the network structure of the brain (Sporns, Tononi, and Kotter,
2005)– can be extracted from functional interactions inrfMRIdata
(Varo-quaux and Craddock,2013). The weights of the corresponding brain
functional connectome are used to characterize individual subjects behavior and mental health (Dubois et al.,2018a; Milazzo et al.,2014;
Smith et al.,2015).
Machine-learning pipelines are key to turning functional connec-tomes into biomarkers that predict the phenotype of interest (Woo et al.,
2017). OnrfMRI, such a pipeline typically comprises of 3 crucial steps
as depicted in Fig.2.2, linking functional connectomes to the target phenotype (Craddock, Tungaraza, and Milham,2015; Varoquaux and
Craddock,2013).
problem statement There exist many variations of this proto-typical pipeline, even for classification from edge-weights of brain functional connectomes, as revealed by reviews of the field (Arbab-shirani et al.,2017; Brown and Hamarneh,2016; Wolfers et al.,2015).
These various choices have a sizable impact on the accuracy of popula-tion studies, and are seldom discussed (Carp,2012). The cost of such
analytical variation is twofold. First, it puts the burden on the practi-tioner to explore many options and make choices without systematic guidance. Second, methods variations create researchers degrees of freedom (Simmons, Nelson, and Simonsohn,2011) that can
compro-mise the measure of the prediction accuracy of biomarkers (Varoquaux,
2017). Guidelines on optimal modeling choices are thus of great value
for imaging-based biomarker research.
In this chapter we introduce a prediction pipeline that estimates con-nectivity weights to relate them to phenotypes and thereafter review practices and methods used for prediction of psychiatric diseases from functional connectomes. Then, we present and benchmark different
2.1 population phenotypes studied 9 methodological choices involved in the classification pipelines. Finally, we report experimental results and the best performing methods, as revealed by our experiments.
2.1
population phenotypes studied
Population phenotypes are individual assessments, characterized through clinical diagnostic systems or questionnaires. We can study prediction from functional connectomes of various phenotypes – clini-cal and non-cliniclini-cal outcomes that includes: neuro-degenerative and neuro-psychiatric disorders, drug abuse impact, fluid intelligence. Studies can then focus either on discriminating between two or more groups i. e. binary values or predicting on a continuous integers, for instance brain-aging (Liem et al.,2017a). Thanks to the open science
(Poldrack and Gorgolewski, 2014), several openly-accessible rfMRI
datasets exists to study diseased populations (Biswal et al.,2010). This
could be useful to apply our connectome-classification pipeline to benchmark various predictive modeling choices. Some of the diverse phenotypes which could be interesting to study on populations who are pre-stratified into binary groups are listed below.
1. Center for Biomedical Research Excellence (COBRE)1, comprising
rfMRIdata to study schizophrenia and bipolar disorder (Calhoun
et al., 2012). We focus on predicting schizophrenia diagnosis
versus normal control.
2. the Alzheimer’s Disease Neuroimaging Initiative (ADNI)2 database studies neuro-degenerative diseases (Mueller et al.,
2005). We focus on usingrfMRIto discriminate individuals with
Mild Cognitive Impairment (MCI) from individuals diagnosed with Alzheimer’s disease (AD) (Trzepacz et al.,2014).
3. the Alzheimer’s Disease Neuroimaging Initiative Department of Defense (ADNI-DOD), funded by the US Department of Defense (DOD) to study brain aging in Vietnam War Veterans, includes
rfMRI data of individuals with Post Traumatic Stress Disorder
(PTSD) or brain traumatic injuries. We focus on discriminating
PTSDcondition from normal controls.
4. Addiction Connectome Preprocessed Initiative (ACPI)3, a longitu-dinal study to investigate the effect of cannabis use among adults with a childhood diagnosis of Attention Deficit Hyperactivity Disorder (ADHD). In particular, we use readily-preprocessed
rfMRI data from Multimodal Treatment Study (MTA) of ADHD.
1 http://schizconnect.org/
2 www.adni-info.org
2.2 estimating functional connectomes 10 We attempt to discriminate whether individuals have consumed marijuana or not.
5. Autism Brain Imaging Data Exchange database (ABIDE), inves-tigates the neural basis of autism (Di Martino et al.,2014). We
use the data from Preprocessed Connectome Project (Craddock et al.,2013) to discriminate individuals with Autism Spectrum
Disorder (ASD) from normal controls.
We also perform extra benchmarks including the Human Connectome Project (HCP) rfMRI datasets to discriminate individuals with high vs low intelligence score. These additional light-weight benchmarks are to investigate the consistency of analytical choices while probing high-quality datasets.
2.2
estimating functional connectomes
A functional connectome is estimated from a set of brainROIs, nodes Fig.2.1that altogether form brain parcellations, by measuring their pairwise interactions termed as functional connectivity, edges Fig.B.1. This section describes standard methods to estimate such nodes and edges from therfMRIdata.
2.2.1 Definition of brain regions of interest (ROIs)
For functional connectomes, the hypothesis is that the definition of
ROIs should capture well the relevant functional units (Smith et al.,
2011). ROIsselection is an important difficult choice, as the optimal
may vary for different conditions or pathologies. Studies define nodes to estimate functional connectomes with a variety of approaches:
• balls4
of radius varying from 5mm to 10mm centered at coor-dinates from the literature (Dosenbach et al.,2010; Power et al., 2011);
• Pre-defined reference anatomical atlases such as Automated Anatomical Labeling (AAL) (Tzourio-Mazoyer et al.,2002),
sulci-based atlases (Desikan et al., 2006; Perrot et al., 2009), or
connectivity-based cortical landmarks (Zhu et al.,2013);
• data-driven approaches based on k-means or Ward clustering (Thirion et al.,2014), as well as Independent Component
Analy-sis (ICA) approaches (Beckmann and Smith,2004a; Calhoun et al., 2001) or dictionary learning (Mensch, Varoquaux, and Thirion, 2016).
4 We used the term ball rather a sphere. From a mathematical standpoint, A “ball” is
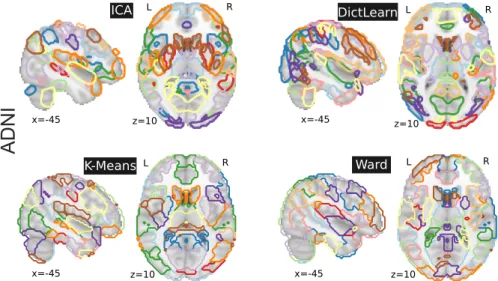
2.2 estimating functional connectomes 11 L L R R L L R ICA DictLearn x=-45 K-Means Ward R x=-45 z=10 z=10 x=-45 z=10 x=-45 z=10
Figure 2.1: Brain regions extracted with ICA, DictLearn, KMeans, and
Ward For ICA and dictionary learning, the dimensionality is of 80 and 60resting-state networks – which are then broken up into more regions – yielding 150 regions, and 120 for KMeans and Ward clustering. Colors are arbitrary. Regions are data-driven on ADNI dataset (Mueller et al.,2005).
The number of nodes which range from dozens to several hundreds and the formation of nodes either as local regions or distributed networks are tied to the choice of definition ofROIs. For pre-defined atlases, these are certainly fixed.
We contribute further to this problem of selecting good analytical choices in brain parcellations at Chapter3.
2.2.2 Representation of brain functional connectomes
Studies define functional interactions from second-order statistics – based on signal covariance– using Pearson’s correlation or partial correlations estimated mostly either with the maximum-likelihood formula for the covariance or the Ledoit-Wolf shrinkage covariance estimator (Brier et al.,2015; Ledoit and Wolf,2004a; Varoquaux and
Craddock,2013). Partial correlation between nodes is useful to rule
out indirect effects in the correlation structure, but calls for shrunk estimates (Smith et al.,2011; Varoquaux et al.,2010b). Mathematical
arguments have also led to representations tailored to the manifold-structure of covariance matrices (Colclough et al., 2017; Dodero et
al., 2015; Ng et al., 2014; Varoquaux et al., 2010c). We benchmark
the simplest of these, a tangent representation of the manifold which underlies the more complex developments (see AppendixBfor a quick introduction to this formalism). Fig.B.1shows the representation of functional connectomes estimated on ADNI dataset (Mueller et al.,
2.3 many choices of prediction pipeline 12
RS-fMRI
Diagnosis Connectivity
Parameterization Supervised Learning Defining Brain
ROIs
1 2 3
Figure 2.2: Functional connectome prediction pipeline with three main
steps: 1) definition of brain regionsROIsfromrfMRIimages or using already defined reference atlases, 2) quantifying functional interactions from time series signals extracted from theseROIs and 3) comparisons of functional interactions across subjects using supervised learning.
Some studies employ complex-graph network modeling approaches –e. g. network modularity or centrality (Rubinov and Sporns,2011)–
(Arbabshirani et al.,2017; Brown and Hamarneh,2016; Wolfers et al., 2015).
2.3
many choices of prediction pipeline
Fig.2.2shows the standard prediction pipeline considered for func-tional connectomes-based predictions. It typically comprises 3 crucial steps: definition of brainROIsfromrfMRIdata, estimation of connec-tomes from time series signals extracted upon on these ROIs, and comparison of connectomes across subjects using machine learning. In AppendixA.1, we list some studies that have usedrfMRIto study diverse psychiatric diseases as well as the choices selected at the each step.
The current practice is very diverse, without standard modeling choices. To open the way toward informed decisions, we explore popular variants of the classic machine-learning pipeline to predict on connectomes. We measure the impact of choices at each step on prediction for diverse targets across multiple datasets as on Table2.1 and Section2.1. We detail below the specific modeling choices included in our benchmarks.
Dataset Prediction task Groups
COBRE Schizophrenia vs Control 65/77
ADNI AD vs MCI 40/96
ADNIDOD PTSD vs Control 89/78
ACPI Marijuana use vs Control 62/64
ABIDE Autism vs Control 402/464
Table 2.1:Datasets and prediction tasks, as well as the number of subjects
in each group. COBRE - 142 subjects, ADNI - 136 subjects, ADNIDOD - 167 subjects, ACPI - 126 subjects, ABIDE - 866 subjects.
2.3 many choices of prediction pipeline 13
2.3.1 A selection of methods for definition of brain ROIs
2.3.1.1 Pre-defined atlases
Pre-defined atlases defined based on brain anatomy: AAL (Tzourio-Mazoyer et al.,2002), a structural atlas defined from the anatomy of a
reference subject, Harvard Oxford (Desikan et al.,2006), a probabilistic
atlas of anatomical structures, contains of cortical & sub-corticalROIs. Another category is defining ROIsfromrfMRIdata which we call as functional atlases. Such atlases include Bootstrap Analysis of Stable Clusters (BASC)(Bellec et al.,2010), a multi-scale functional atlas built
with clustering on rfMRI; Power, a coordinate-based atlas consisting of coordinates which can be positioned by the balls of 5mm radius (Power et al.,2011).
For a pre-computed functional atlas with dictionary learning, we can use an atlas5
computed by Mensch et al.,2016 with a very
scal-able sparse dictionary-learning algorithm on the HCP900 dataset (Van Essen et al.,2012). This algorithm, Stochastic Online Matrix
Factoriza-tion (SOMF), solves the `1 dictionary-learning problem with an
algo-rithm fast on very large datasets that converges to the same solution as standard on-line solvers (Mensch et al.,2018).
2.3.1.2 Data-driven methods
Moving away existing pre-defined atlases, brainROIscan also be de-fined using popular data-driven methods from intrinsic brain activity of therfMRIa. k. a. data-driven (Abraham et al.,2013; Beckmann and
Smith,2004a; Calhoun et al., 2001; Kahnt et al., 2012; Thirion et al., 2014; Yeo et al., 2011). We choose to define ROIs using two
cluster-ing methods: K-Means (Hastie, Tibshirani, and Friedman,2009), and
hierarchical agglomerative clustering using Ward’s algorithm (Ward,
1963) with spatial connectivity constraints (Michel et al.,2012); and
two linear decomposition methods: Canonical Independent Compo-nent Analysis (CanICA) (Varoquaux et al.,2010a), Dictionary Learning
- `1 (DictLearn) (Mensch, Varoquaux, and Thirion,2016).
2.3.1.3 Time-series signals extraction
After defining brainROIs, we extract a representative time-series for each ROI in each subject. For atlases composed of non-overlapping
ROIsas can be seen in Fig.2.1(bottom row), we simply compute the weighted average of thefMRItime series signals over all voxels within that specific region. For fuzzy overlappingROIs, such as the atlases driven byCanICAandDictLearnas shown in Fig.2.1(top row), we use ordinary least squares regression to unmix the signal in each voxel as
5 Pre-computed sparse dictionaries with the Massive Online Dictionary Learning
(MODL) approach of Mensch et al.,2016are available fromhttps://team.inria.fr/
2.3 many choices of prediction pipeline 14 the additive decomposition of signals over several overlappingROIs. Let Y ∈Rn×p be the subject-specific signals, written as p voxels by n timepoints, and V ∈Rk×p the atlas of k maps supported on p voxels. We estimate U ∈Rn×k, the set of time series for each ROI, using:
ˆ
U =arg min
U kY − UVk 2
At the signal-extraction level, we regress out confounds or non-neural information (Varoquaux and Craddock,2013). As confounding
time-series we use: 10 CompCor (Behzadi et al.,2007) on the whole
brain and 6 motion related. We remove motion-related signal only for COBRE, ADNI and ADNIDOD as they are provided as raw data. We have not done any additional preprocessing steps on already prepro-cessed public datasets like ABIDE6
, ACPI7
. The signal of each region is also then normalized, detrended and bandpass-filtered between 0.01 and 0.1Hz. All these steps are done with Nilearn v0.3.
2.3.2 Connectivity parametrization
To estimate functional interactions efficiently from time series signals extracted from theseROIs, we use the Ledoit-Wolf regularized shrink-age estimator (Brier et al., 2015; Ledoit and Wolf, 2004a; Varoquaux
and Craddock, 2013), which gives a closed form expression for the
shrinkage parameter. This estimator yields well-conditioned estima-tors despite the variation in length of time series acrossrfMRIdatasets. With this covariance structure, we study three different parametriza-tions of functional interacparametriza-tions: full correlation, partial correlation (Smith et al.,2011; Varoquaux and Craddock,2013) and the tangent
space of covariance matrices. The latter is less frequently used but has solid mathematical foundations and a variety of groups have reported good decoding performances with this framework (Barachant et al.,
2013; Dodero et al., 2015; Ng et al., 2014; Qiu et al., 2015; Rahim,
Thirion, and Varoquaux,2017; Varoquaux et al.,2010c; Wong et al., 2018). Note that computing partial correlation or tangent space require
inverting covariance matrices, hence these must be well conditioned. Non regularized covariance estimation is thus not useable for these parametrizations.
For each parametrization, we vectorize the functional connectome, using the lower triangular part of the connectomes matrix for classifi-cation.
6 http://preprocessed-connectomes-project.org/abide/ 7 http://fcon_1000.projects.nitrc.org/indi/ACPI/html/
2.3 many choices of prediction pipeline 15
2.3.3 Supervised learning: Classifiers
The final step of our pipeline predicts a binary phenotypic status from connectivity features extracted from previous step. We consider sev-eral linear and non-linear classifiers for prediction i. e. both sparse and non-sparse methods. For non-linear methods, we consider K-Nearest Neighbor (KNN) (Cover and Hart, 1967) with K=1 and Euclidean
distance metric, Gaussian Naïve Bayes (GNB) and Random Forests Classifier (Breiman,2001a). For linear classifiers we consider sparse `1
regularization for Support Vector Classifier (SVC), and Logistic Regres-sion (Hastie, Tibshirani, and Friedman,2009). For non-sparse linear
classifiers – i. e. `2 regularization – we consider Ridge classification, SVC, Logistic regression. For SVC, we also considered 10% feature screening with univariate Analysis of Variance (ANOVA). With regards to the regularization parameter (e. g. soft margin parameter inSVC), we use the default C = 1 or α = 1, which has been found to be a good default (Varoquaux et al.,2017).
2.3.4 Cross validation and error measure
We perform cross-validation (CV) by randomly shuffling and splitting each dataset over 100 folds, forming two sets of subjects: 75% for training the classifier and learning brain atlases with data-driven models and the remaining 25% for testing on unseen data (Varoquaux et al.,2017). We create stratified folds, preserving the ratio of samples
between groups. For each split, we measure the Area Under Curve (AUC) from the Receiver Operating Characteristic (ROC) curve: 1 is a perfect prediction and .5 is chance. The final prediction scores in AUC (> 120k scores, see Section2.3.5) are used to measure the impact of various choices in our prediction pipeline outlined below in results section.
2.3.5 Computations and implementation
Our experimental study consists of more than 240 types of pipelines (8 atlases × 3 connectivity measures × 10 classifiers). These pipelines were run on each of 5 datasets for 100 CV folds. As a result, there are more than 50 000 pipeline fits, from the raw data to the supervised step, a heavy computational load. Technically, we rely on efficient implementations open-source scientific computing packages using Python 2.7: Nilearn v0.3 (Abraham et al.,2014b) to define brain atlases,
extract representative timeseries, and build connectivity measures. All machine-learning methods used for prediction i.e., classifiers and cross-validation are implemented with scikit-learn v0.18.1 (Pedregosa, Varoquaux, and Gramfort,2011). For visualization, we rely on Nilearn
2.4 guidelines for optimal modeling choices of prediction pipeline 16 for brain-related figures while matplotlib is used (Hunter,2007) for
generating other figures.
2.4
guidelines for optimal modeling choices
of prediction pipeline
We now outline which modeling choices have an important impact on predicting over diverse phenotypes from allrfMRIdatasets as men-tioned on Table2.1. We use high-qualityHCP dataset to investigate whether analytical choices which showed an impact on clinical ques-tions will carry forward its consistency on a non-clinical behavioral task prediction. Below, we study comparisons based on clinical ques-tions and that behavioral task included comparisons on 6 datasets with pre-computed atlases are summarized at AppendixC.1.
impact of methodological choices We study the prediction score of each pipeline relative to the mean across pipelines on each fold. This relative measure discards the variance in scores due to folds or datasets. From these relative prediction scores, we study the impact of the choice of each step in the prediction pipeline: choice of classifiers, connectivity parametrizations, and definition of brainROIs. This is a multifactorial set of choices and there are two points of view on the impact of a choice for a given step. First, the impact of the choice for one step may be considered when the other steps are optimal, or close to optimal. Second, the impact of one step may be considered for all other choices for the other steps –marginally on the choice of other steps. In the following figures, we study the first situation, focusing on “good choices”: given a choice for one step, we report data for top third highest performing scores (quantiles 0.666) for the choices in the other steps.
2.4.1 Choice of classifier
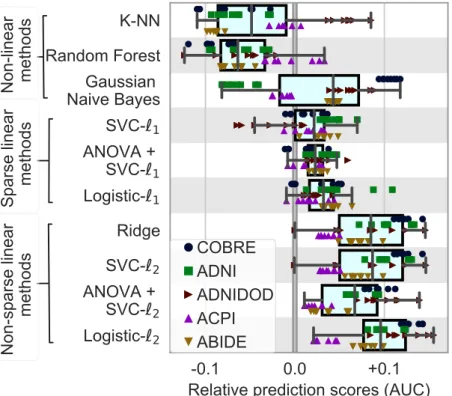
Figure 2.3summarizes the performances of classifiers on prediction scores for allrfMRIdatasets. The results display a certain amount of variance across folds and datasets (i.e., prediction targets). However, they show that non-sparse (`2-regularized) linear classifiers perform
better, with a slight lead for logistic-`2. Using non-linear classifiers
does not appear useful; neither does sparsity. The results inFigure 2.3 are conditional on a good choice for the other steps of the pipeline.
2.4 guidelines for optimal modeling choices of prediction pipeline 17
Figure 2.3:Impact of classifier choices on prediction accuracy, for allrfMRI
datasets and all folds. For each classifier choice, only the top third highest per-forming scores are represented when varying the modeling choices for other steps in the pipeline: brain-region definition and connectivity parametriza-tion. Overall, `2-regularized linear classifiers perform better, with a slight
lead for `2logistic regression. The box plot gives the distribution across folds
(n=100) and datasets (denoted by markers) of prediction score for a given choice (classifier) relative to the mean across all choices (regions-definition and connectivity parametrizations, classifiers). The box displays the median and quartiles, while the whiskers give the 5thand 95thpercentiles.
2.4.2 Choice of connectivity parameterization
Figure 2.4summarizes the impact of covariance matrix parametriza-tion on the relative predicparametriza-tion scores for allrfMRI datasets. Tangent-space parametrization tends to outperform full correlations or partial correlations. Indeed, it performs better on average, but also has less variance across datasets (prediction targets) or folds.
2.4.3 Choice of regions definition method
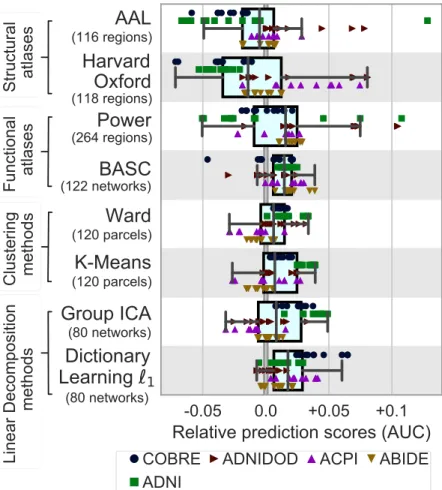
Figure 2.5 summarizes the relative prediction performance of all choices of region-definition methods. While the systematic effects are small compared to the variance over the folds and the datasets, the general trend is that regions defined from functional data lead to better prediction than regions defined from anatomy. Using `1
2.5 discussion 18
Figure 2.4: Impact of connectivity parameterization on prediction
accu-racy, for allrfMRIdatasets and folds. For each parametrization choice, only the top third highest performing scores are represented when varying the modeling choices for other steps in the pipeline: brain-region definition and classifier. Prediction using tangent space based connectivity parameterization displays higher accuracy with relatively lower variance than using full or partial correlation. The box displays the median and quartiles, while the whiskers give the 5thand 95thpercentiles.
the best method, closely followed by ICA, which is also based on a linear decomposition model. Interestingly,BASC, an atlas pre-defined on unrelated rfMRI datasets using data-driven clustering technique, performs almost as well as the best regions-extraction method applied to the rfMRI data of interest. Unlike other pre-defined atlases, like Harvard Oxford or AAL, that lack some crucial functional regions. TheBASCatlas (Bellec et al.,2010) is readily available online, and is
thus easy to apply to data. Figure 2.5 shows the impact of region-definition approach conditional on good choices in the other steps of the pipeline. Overall, comparisons highlight that defining regions from functional data gives the best-performing pipelines, and that linear-decomposition methods are to be preferred.
2.5
discussion
An increasing amount of studies use predictive models on functional connectomes, for instance in population-imaging settings to relate brain activity to psychological traits or to build biomarkers of patholo-gies. While the basic steps of a pipeline are fairly universal –definition of brain regions, construction of an interaction matrix, and supervised learning– studies in the literature show many methodological variants (AppendixA.1). Recommendations on methods that perform well can increase practitioner’s productivity and limit vibration effects that
2.5 discussion 19
Figure 2.5:Impact of region-definition method on prediction accuracy, for
allrfMRIdatasets and folds. For each region-definition choice, only the top
third highest performing scores are represented when varying the modeling choices for other steps in the pipeline: classifier and connectivity parametriza-tion. Learning atlases fromrfMRIdata tends the prediction for all tasks. By contrast anatomical atlases perform poorly over diverse tasks. The box dis-plays the median and quartiles, while the whiskers give the 5thand 95th percentiles.
risk undermining the reliability of biomarkers (Varoquaux,2017). A
challenge to such recommendations is the heterogeneity of prediction settings, for instance across different acquisition centers or clinical questions.
summary of models for predicting outcomes Here, we in-vestigate methodological choices across 6 databases covering different clinical questions and behavioral task. We systematically compare commonly used functional connectome-based prediction methods. We find that some trends emerge, despite a large variance due to vari-ability across subjects –visible across the folds– and across cohorts and clinical questions. Non-sparse linear models, such as logistic re-gression, appear as a good default choice of classifier. The lack of success of sparse approaches suggests that the discriminant signal is
2.5 discussion 20
Step Recommendation
1: region extraction Functional regions,
eg Dictionary learning or ICA 2: connectivity matrix Tangent-space embedding 3: supervised learning Non-sparse linear model,
eg logistic regression or SVM
Table 2.2:Recommendations for imaging-based based prediction pipeline.
distributed across the functional connectome for the tasks we study. The tangent-space parametrization of functional connectomes brings improvements to prediction accuracy. With regards to nodes of the functional connectomes, defining them fromrfMRI data gives slight benefits in prediction. Linear decomposition methods, such as dictio-nary learning orICA, are good approaches to define these nodes from
the rfMRI data at hand. Unlike clustering methods based on “hard”
assignment, they provide a soft assignment to regions, enabling to capture a form of uncertainty in the definition of regions.
Alternatively, the MODL8
(Mensch et al.,2016) or BASC (Bellec et
al., 2010) atlases based predictions as shown on Fig. C.1, provide
good readily-available nodes that simplify the process and alleviate computational cost. The good analytic performance of pre-computed atlases is promising and calls for further study. Establishing standard atlases brings significant computational benefits, as the definition of regions and the extraction of signal is the most computation-intensive part of the pipeline –in particular when performed inside a nested cross-validation loop.
To enable comparison across different cohorts, we focused on 2-class 2-classification problems. However, the results in terms of regions definition and connectivity parametrization should extend to other supervised learning settings, such as regression –e.g. for age prediction (Liem et al.,2017a)– multi-output approaches as with Canonical
Cor-relation Analysis popular in large-scale population imaging settings (Miller and Alfaro-Almagro,2016; Smith et al.,2015) for dimensional
approaches to psychology.
2.6 conclusion 21
2.6
conclusion
rfMRI-based predictive models bring the promise of robust and reliable
biomarkers: given new brain imaging data, they should give accurate predictions of clinics or behavior (Woo et al.,2017).
Our study reveals trends that can provide good defaults to practi-tioners, summarized onTable 2.2: regions defined from functional data, for instance withICAor dictionary learning as in the pre-computed
MODLatlas, representing connectivity with the tangent embedding of covariance matrices, and using a non-sparse linear model, such as a logistic regression. In particular, good defaults can limit the combinato-rial explosion of analytic pipelines, which decreases the computational cost of running a study and makes its conclusion more robust statis-tically. Yet, as it is well known in machine learning (Wolpert,1996),
there cannot be a one-size-fits-all solution to data analysis: optimal choices will differ on datasets with very different properties from the datasets studied here.
3
B R A I N A T L A S E S T O E X T R A C T
F U N C T I O N A L S I G N A L S
Chapter2, has shown the benefits of functionally-defined brain parcel-lations withICA(Varoquaux et al.,2010a), dictionary learning
(Men-sch, Varoquaux, and Thirion,2016) or clustering (Bellec et al.,2010).
Whether they are obtained from the data at hand or pre-defined from other functionalrfMRI datasets, these atlases overall showed higher predictive accuracy. They extract better statistical links from brain data to target outcomes as they capture the functional structure of the brain. This finding motivates deriving high-resolution functional atlases for better predictions and making them readily available to plug into the prediction pipeline. This not only alleviates the computa-tion burden but also satisfies the cross-validated supervised learning criterion i. e. learningROIsonly on training data.
In this chapter, we focus on the derivation of high-resolution func-tional brain parcellations for population imaging. We define this need in the context of dimensionality reduction as a consequence of growth in the population imaging. We discuss the limitations of existing al-gorithms in terms of their scalability to large-scale brain volumes and thereafter deploy efficient and scalable statistical algorithm for high-resolution functional brain parcellations. We extend the vali-dation of these new finely-grained brain ROIs to many varieties of analytical tasks beyond rfMRIdata. After comprehensive evaluation against existing state-of-the-art pre-defined brain parcellations, we conclude by showing the validation results and the need of suchROIs
for high-quality predictions.
3.1
dimensionality reduction
Population imaging has been collecting terabytes of high-resolution functional brain images, uncovering the neural basis of individual differences (Elliott and Peakman,2008). While these great volumes of
data enable fitting richer statistical models, they also entail massive data storage (Gorgolewski et al.,2017; Poldrack, Barch, and Mitchell, 2013) and challenging high-dimensional data analysis. A popular
approach to facilitate data handling is to work with Image-derived Phenotypes (IDPs), i. e. low-dimensional signals that summarize the information in the brain images (high-dimensional) while keeping meaningful representations of the brain (Miller and Alfaro-Almagro,
2016). Then, these reduced representations are the starting point for
asking research questions.
3.2 image-derived phenotypes for population imaging 23 Brain parcellations are suitable and widely used for data reduction in functional imaging (Craddock et al.,2012; Thirion et al.,2006). For
applications likeIDPs, the choice of brain parcellations conditions the signal captured in the data analysis. To define regions well suited to brain-imaging endeavors, there is great progress in building atlases from the neuroimaging data itself (Eickhoff, Yeo, and Genon,2018).
There are two prominent data-driven approaches to define well-suited structures. These can strive to select homogenous neural populations, typically via clustering approaches (Bellec et al.,2010; Craddock et al., 2012; Goutte et al., 1999; Schaefer et al., 2017; Thirion et al., 2014).
They can also be defined via continuous modes that map intrinsic brain functional networks (Damoiseaux et al., 2006; Harrison et al., 2015;
Varoquaux et al.,2011). As showed on Fig.2.5on Chapter2and consis-tent with Abraham et al.,2017, the functional modes have been shown
to capture well functional connectivity, with linear decomposition techniques such asICAor sparse dictionary learning.
problem statement High-resolution atlases can give a fine-grained division of the brain and capture more functionally-specific regions and rich descriptions of brain activity (Schaefer et al.,2017).
Yet, there is to date no highly-resolved set of “soft” functional modes available, presumably because increasing the dimensionality raises significant computational and statistical challenges (Mensch et al.,
2016; Pervaiz et al.,2019). “Soft” regions take continuous non-negative
values, in contrast with hard parcellation atlases.
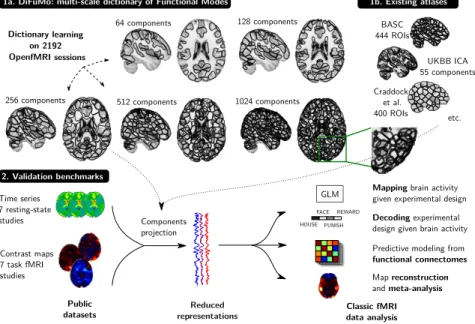
In this chapter, we address this need with high-order Dictionaries of Functional Modes (DiFuMo) extracted at a large scale both in terms of data size (3 million volumes of total data size 2.4TB) and resolution (up to 1024 modes). For this, we leverage the wealth of openly-available functional images (Poldrack, Barch, and Mitchell,2013) and efficient
dictionary-learning algorithms to fit on large data. This is unlikeICA
which is hard to use for a high number of modes (Pervaiz et al.,2019).
3.2
image-derived phenotypes for
popula-tion imaging
While analysis of brain images has been pioneered at the voxel level (Friston et al.,1995), IDPsare increasingly used in the context of
popu-lation imaging. Trading voxel-level signals forIDPshas several moti-vations. First and foremost, it greatly facilitates the analysis on large cohorts: the data are smaller, easier to share, requiring less disk stor-age, computer memory, and computing power to analyze. It can also come with statistical benefits. For instance, in standard analysis of task responses, e.g. in mass-univariate brain mapping, the statisti-cal power of hypothesis test at the voxel level is limited by multiple
3.3 a scalable model and a very large fmri dataset 24 comparisons (Friston et al.,1995), while working at the level ofIDPs
mitigates this problem (Thirion et al.,2006). For predictive modeling,
e.g. in multi-variate decoding (Mourão-Miranda et al.,2005), the
high-dimensionality of the signals is a challenge to learning models that generalize well—a phenomenon known as the curse of dimensionality in machine learning (Hastie, Tibshirani, and Friedman,2009). Finally,
for functional connectomes, working at voxel-level is computationally and statistically intractable as it entails modeling billions of connec-tions. The standard approach is therefore to average signals on regions or networks (Varoquaux and Craddock,2013).
3.3
a scalable model and a very large fmri
dataset
The most popular model in neuroimaging is ICA (Hyvärinen and Oja,2000), which optimizes spatial independence between extracted
maps. It has been extensively used to define resting-state networks (Beckmann et al., 2005; Calhoun et al.,2001; Kiviniemi et al., 2003)
and implicitly outlines soft parcellations of the brain at high order (Kiviniemi et al.,2009; Varoquaux et al.,2010a). ICA-defined networks
are used to extract the officialIDPsof UK Biobank (UKBB), the largest brain-imaging cohort to date; these have been shown to relate to behavior (Miller and Alfaro-Almagro,2016).
We rely on another decomposition model, dictionary learning (Ol-shausen and Field,1997), that enforces sparsity and non-negativity
instead of independence on the spatial maps. While less popular than
ICAin neuroimaging, sparsity brings the benefit of segmenting well functional regions on a zeroed-out background (Lee, Tak, and Ye,2010;
Varoquaux et al., 2011). For our purposes, an important aspect of
sparse models is that they have computationally-scalable formulations even with high model order and on large datasets (Mensch et al.,2016, 2018).
3.3.1 Stochastic Online Matrix Factorization SOMF
We consider BOLD time-series from fMRI volumes, resampled and registered to theMNI template. After temporal concatenation, those form a large matrix X ∈Rp×n, where p is the number of voxels of the images (around 2 · 105), and n is the number of brain images, of the order of 106 in the following. To extractDiFuMos, each brain volume is modeled as the linear combination of k spatial functional networks, assembled in a dictionary matrix D ∈Rp×k. We thus assume that X approximately factorizes as DA, where the matrix A ∈Rk×nholds in every column the loadings αinecessary to reconstruct the brain image