HAL Id: pastel-00006166
https://pastel.archives-ouvertes.fr/pastel-00006166
Submitted on 29 Jun 2010HAL is a multi-disciplinary open access
archive for the deposit and dissemination of sci-entific research documents, whether they are
pub-L’archive ouverte pluridisciplinaire HAL, est destinée au dépôt et à la diffusion de documents scientifiques de niveau recherche, publiés ou non,
Invention and international diffusion of climate change
mitigation technologies: an empirical approach
Antoine Dechezleprêtre
To cite this version:
Antoine Dechezleprêtre. Invention and international diffusion of climate change mitigation technolo-gies: an empirical approach. Humanities and Social Sciences. École Nationale Supérieure des Mines de Paris, 2009. English. �pastel-00006166�
Invention and International Diffusion of Climate Change
Mitigation Technologies: An Empirical Approach
par
Antoine Dechezleprêtre
Thèse
pour obtenir le grade de
Docteur de l’Ecole Nationale Supérieure des Mines de Paris
Spécialité Economie et Finance
Contents
Introduction ...9
1 Policy context and research question ...10
2 Methodological approach ...12
3 Structure of the document...16
Part 1: Empirical analyses based on patent data ... 21
Research paper 1: Invention and Transfer of Climate Change Mitigation
Technologies on a Global Scale: A Study Drawing on Patent Data ... 23
1 Introduction...23
2 Patents as indicators of innovation and technology transfer ...27
3 Data description ...31
4 Descriptive statistics on innovation...36
5 International technology transfer...51
6 Conclusion ...59
Appendix ...62
Research paper 2: What Drives the International Transfer of Climate
Change Mitigation Technologies? Empirical Evidence from Patent
Data... 77
1 Introduction...77
2 Patents as indicators of technology transfer...81
3 Data description ...85
4 Theoretical framework...86
5 Empirical issues ...90
6 Results ...99
7 Conclusions... 102
Research paper 3: Does foreign regulation influence domestic inventors?
The case of renewable energy innovation ...109
1 Introduction... 109
3 Data... 120
4 Descriptive statistics... 122
5 Estimation and results... 128
6 Conclusion ... 135
Part 2: Technology transfer in the Clean Development
Mechanism ... 137
Research paper 4: The Clean Development Mechanism and the
international diffusion of technologies: an empirical study ...139
1. Introduction... 139
2. Data issues ... 143
3. Descriptive statistics regarding technology transfers... 147
4. The determinants of technology transfers: an econometric analysis ... 156
5. Explaining the type of transfer... 167
6. Conclusion ... 169
Research paper 5: Technology transfer by CDM projects: a comparison
of Brazil, China, India and Mexico...173
1. Introduction... 173
2. Descriptive statistics by country ... 174
3. Econometric analysis of cross-country differences ... 181
4. Conclusion ... 188
Conclusion... 191
1 Main results and policy implications ... 192
2 Directions for future research ... 196
Acknowledgements
It would be difficult to overstate how much I have learned from Matthieu Glachant, my supervisor since I started at CERNA. I especially appreciate his constant availability for discussion and his ability to make quick decisions in the face of the most depressing estimation results. I am also very much indebted to Yann Ménière, my unofficial supervisor, for his helpful suggestions and advice throughout my PhD.
I wish to thank Nick Johnstone for giving me the opportunity to work on the Patstat database. He and Ivan Hascic have provided me with helpful comments during my stay at OECD.
I am grateful to Jan Eilhard and Benjamin Bureau for helping me out of critical econometric issues. Comments I received during CERNA doctoral workshops have enhanced this work. Thanks also to François Lévêque for providing helpful feedback at various stages.
In addition, I benefitted from the comments and helpful remarks of Jenn Baka and Elena Verdolini. Finally, I thank Dominique Ami who has introduced me to environmental economics.
Preface
This dissertation deals with innovation activities in climate change mitigation technologies and their international diffusion. In order to contribute to the literature on this subject, we construct and analyze two unique data sets. We present five empirical papers based on these data sets for this dissertation:
• Research paper 1: Invention and Transfer of Climate Change Mitigation
Technologies on a Global Scale: A Study Drawing on Patent Data, 2009.
Commissioned by the Review of Environmental Economics and Policy (joint with Matthieu Glachant, Nick Johnstone, Ivan Hascic and Yann Ménière) • Research paper 2: What Drives the International Transfer of Climate Change
Mitigation Technologies? Empirical Evidence from Patent Data, 2009.
Submitted to the Journal of Environmental Economics and Management (joint with Matthieu Glachant and Yann Ménière).
• Research paper 3: Does foreign regulation influence domestic inventors? The
case of renewable energy innovation, 2009. CERNA Working Paper
• Research paper 4: The Clean Development Mechanism and the international
diffusion of technologies: an empirical study, 2008. Energy Policy 36, 1273–
1283 (joint with Matthieu Glachant and Yann Ménière).
• Research paper 5: Technology transfer by CDM projects: a comparison of
These papers deal with the same research topic and share a common methodological approach. However, each paper puts forward distinct research questions and can be read on its own.
We start this dissertation with a short preliminary chapter that outlines the research topic and the general methodology. The structure of the document is presented in more detail in the third section of this introduction. The five following chapters are based on the research papers presented above.
1 Policy context and research question
According to the IEA Energy Technology Perspectives 2008, global greenhouse gas (GHG) emissions under a business as usual scenario are expected to increase by 130% between 2008 and 2050, from 27 Gt CO2-eq to 62 Gt CO2-eq. A rise of such magnitude could raise global average temperatures by 6°C in 2100 relative to pre-industrial levels, far above the commonly accepted level of “tolerable” warming of 2°C. The Intergovernmental Panel on Climate Change (IPCC) recommends that carbon emissions be reduced by 50% to 85% by 2050 from current levels in order to limit the rise in temperatures between 2°C and 2.4°C.
Reaching this objective requires a massive deployment of low carbon technologies, including renewable energies, nuclear power, energy efficiency technologies and carbon capture and sequestration (CCS). According to the IEA’s scenario, achieving a 50% cut in CO2 emissions in 2050 with respect to current level would require the annual deployment of—among other—32 nuclear power plants, 14,000 wind turbines, 215 million m2 solar panels and 35 coal-fired power plants with carbon capture. By comparison, only 2 nuclear power plants were constructed in 2006 (while 8 plants were dismantled) and there is currently no commercial plant with CCS operating at all. Under this scenario, additional investment amounts for $1,100 billion every year, while around $100 billion only were invested in clean energy projects in 2007 (World Economic Forum, 2009). The development and deployment of climate-related technologies are therefore a
In addition, achieving global emission reductions will not be possible if large emitters from the developing world are not involved in the process. Indeed, more than 75% of the growth in CO2 emissions until 2050 is expected to come from developing countries, with India and China alone accounting for 50%. Yet, most low-carbon technologies have so far been developed and used in the North. OECD countries represent 82% of global R&D expenditures in 2000, with the US and Japan alone accounting for 50% (National Science Board, 2006). An examination of patents filed in 13 climate-related technologies shows that Japan, Germany and the USA represent two thirds of worldwide innovation (Dechezleprêtre et al., 2009). For this reason, technology transfer to developing countries is at the heart of current discussions about the post-Kyoto agreement.
Against this background, the first objective of this dissertation is to provide an accurate and up-to-date description of innovation in low carbon technologies and of their international diffusion at a global scale. The debates surrounding future climate policy usually presuppose the need to accelerate technology transfer. Yet, little is known about the actual extent of diffusion as well as about the geography of innovation. We seek to shed light on these issues. In a context of growing tension between Northern and Southern countries on future GHG abatement commitments, providing the climate community with objective data is of great importance.
The second objective of this dissertation is to analyze the factors that promote or hinder the international diffusion of climate-friendly technologies. Our descriptive work shows that some countries benefit more from technology transfers than others. Do these countries have higher technology absorptive
capacities? Do they suffer from weak patent protection? We provide answers to these questions. This allows us to determine how national and international policy measures can enhance technology diffusion, especially towards developing countries. In particular, we discuss the implications of these findings for the next international climate agreement.
The third research direction—tackled in the third paper presented in this dissertation—investigates the links between international technology diffusion and innovation. There is empirical evidence in the literature that inventors respond to stricter regulation by increasing their innovation effort. However, previous studies only link innovation with domestic regulation. Given the degree of technology diffusion between countries, an interesting question is whether they also respond to stricter foreign regulation. If the answer is in the affirmative, overlooking this important aspect of the data might have led previous empirical studies to overestimate the effect of regulation on domestic innovative activities.
2 Methodological approach
In this dissertation, we adopt an empirical approach to address these questions. We construct to unique data sets, which we analyze in turn. The first includes about 300,000 patents protecting climate-related technologies. The second consists in about 650 GHG abatement projects set up under the Clean Development Mechanism.
along with the OECD. PATSTAT is unique in that it covers more than 80 patent offices and contains over 70 million patent documents. It is updated bi-annually. PATSTAT data have not been exploited much until now for they became available only recently and require processing of the raw data before analysis can be carried out.
Patent documents are categorized using the international patent classification (IPC) system. We have identified the IPC classes pertaining to 13 climate mitigation technologies, allowing us to extract patents in these fields from the database. These technologies include seven renewable energy technologies (wind, solar, geothermal, ocean energy, biomass, waste-to-energy, and hydropower), methane destruction, climate-friendly cement, energy conservation in buildings, motor vehicle fuel injection, energy-efficient lighting and carbon capture & storage (CCS). These technologies were selected based on their mitigation potential. Together they represent nearly 50% of all GHG abatement opportunities beyond business as usual until 2030—excluding forestry—identified by McKinsey & Co (see Enkvist et al., 2007).
We have extracted all patents filed worldwide in these 13 climate change mitigation technologies since 1978. Because patents are granted by national patent offices, inventors must file a patent in each country in which they seek protection. Using an international patent database allows us to identify all countries in which a single innovation is patented1. Therefore our data set
1 Least developed countries are not included in the database, but their patenting activity is very
provides an extensive picture of innovation activities in these technologies and of the market-driven technology flows between countries.
We use this data set to provide descriptive statistics about the geographic distribution of climate mitigation inventions on a global scale. We complement this data with country level data and use panel data analysis to analyze the determinants of cross-border diffusion of climate-friendly technologies. We use similar econometric techniques to look for evidence of cross-border induced innovation.
Patent data have a number of limitations. First, not all inventions are patented. In particular, certain forms of knowledge, such as know-how or learning-by-doing, are not patentable. Secondly, patenting is more likely in countries that have strong technological capabilities and that strictly enforce intellectual property rights. For these reasons, patent data might overlook some important aspects of international technology diffusion, especially North-South transfer. The analysis of CDM projects overcomes some of these limitations.
The second data set consists of 644 GHG abatement projects set up under the Kyoto protocol’s Clean Development Mechanism (CDM) up until May 2007. The CDM allows industrialized countries which have ratified the Kyoto Protocol to develop and implement projects that reduce GHG emissions in non-Annex I countries in exchange for emission reduction credits.2 For anyone who is interested in technology transfer in the context of climate change mitigation, the Clean Development Mechanism is a naturally attractive research area. First, the
CDM is explicitly expected to promote North-South technology transfer (UNFCCC 2001). Indeed, if the technology used in a project is not available in the host country but must be imported, the project leads, de facto, to a technology transfer. Secondly, the CDM involves a large number of projects (for which most of the data is easily available) aiming at reducing GHG emissions, using a large array of technologies in various sectors and countries. For this reason, the CDM lends itself very well to empirical analysis.
Information about the CDM projects can be found in Project Design Documents (PDD), available online. They are mandatory standardized documents of about 50 pages submitted to the Executive Board by the project developers for registration. The Guidelines for completing the PDD indicate that the document “should include a description of how environmentally safe and sound technology, and know-how to be used, is transferred to the host Party(ies).” However, this is not a compulsory requirement, and no section is specifically devoted to technology transfer. Therefore, we have read carefully all the PDDs in order to get relevant information about technology transfer.
We use this unique data set to examine whether the CDM encourages technology transfer. We complement project-level data with country-level data and use discrete choice models to analyze the factors promoting technology transfer in CDM projects.
3 Structure of the document
The dissertation has two parts and five chapters. We use the patent data set in the first part (chapters 1, 2 and 3) and the CDM projects data set in the second part (chapters 4 and 5).
The first three papers are based on our data set including all patents filed worldwide between 1978 and 2006 in 13 climate change mitigation technologies.
Research paper 1
This paper gives a quantitative description of the geographic distribution of inventions and of their international diffusion on a global scale. The data suggest that the Kyoto Protocol has induced more innovation in low carbon technologies. However, there is no visible effect of the protocol on international technology transfer. We show that innovation is highly concentrated in three countries— Japan, Germany and the USA—which account for two thirds of total innovations. The innovation performance of emerging economies is very significant as China, South Korea and Russia globally represent about 15% of total inventions. However, they export much less than industrialized countries. International technology transfers mostly occur between developed countries (75% of exported inventions). Exports from developed countries to emerging economies are still limited (18%) but are growing rapidly.
Research paper 2
In this paper, we develop a structural model of technology diffusion and use patent data from 66 countries for the period 1990-2003 in order to characterize the factors that promote or hinder the international diffusion of climate-friendly technologies. To the best of our knowledge, this work is the first econometric study using patent data to analyze specifically the diffusion of climate change mitigation technologies at a global level. Regression results show that the domestic knowledge stock of the recipient countries is a determinant factor. In contrast, the general level of education is less important. We also show that restrictions to international trade—e.g., high tariff rates—and lax intellectual property regimes negatively influence the international diffusion of patented knowledge. Surprisingly, we find that barriers to foreign direct investment can promote technology transfer. We discuss different possible interpretations.
Research paper 3
This paper focuses on the consequences of technology diffusion on innovation. We examine the influence of domestic and foreign regulation on innovation activity in four renewable energy technologies, using patent data from 72 countries from 1990 to 2005. We use data on the growth of installed power capacities to measure the level of pro-renewable regulations in a country. There is empirical evidence that inventors respond to domestic environmental regulation by increasing their innovation effort. We confirm this finding and find strong evidence that innovation also responds to foreign regulation. This work reports evidence of cross-border induced innovation and shows that previous literature on
induced innovation might have overstated the influence of domestic regulation on innovation. This result also has important implications for global climate policies.
Research paper 4
In this paper, we use our data set including all CDM projects registered up to May 2007 to provide an assessment of the technology transfers that take place through the CDM. We show that North-South transfers of climate-friendly technologies take place in 43% of CDM projects. Technology transfers mainly concern the end-of-pipe destruction of non-CO2 greenhouse gas (such as HFCs, CH4 and N2O) and wind turbines. Most projects include the transfer of knowledge and operating skills, allowing project implementers to appropriate the technology. We use econometric analysis in order to characterize the drivers of technology transfer. We show that transfer likeliness increases with the size of the projects. The transfer probability is 50% higher if the project is implemented in a subsidiary of a company located in an Annex 1 country while credit buyers also have a positive impact. The analysis also yields interesting results on how technological capabilities of the host country influence technology diffusion in the CDM.
Research paper 5
In the last paper, we use the same data and similar econometric models to explain inter-country differences. We focus on Brazil, China, India, and Mexico. Together, these countries gather about 75% of the CDM projects. 68% of Mexican projects include an international transfer of technology. The rates are, respectively, 12%, 40% and 59% for India, Brazil and China. Our results show
of foreign partners and good technological capabilities. In contrast, the lower rate of international transfer in India may be due to a better capability to diffuse domestic technologies.
We conclude this dissertation by summarizing the results of the five papers and discussing some implications of these findings for policy makers.
Part 1
Research paper 1
Invention and Transfer of Climate Change Mitigation
Technologies on a Global Scale: A Study Drawing on
Patent Data
31 Introduction
Accelerating the development of new low-carbon technologies and promoting their global application is a key challenge in stabilizing atmospheric GHG emissions. Consequently, technology is at the core of current discussions surrounding the post-Kyoto agreement. The 2007 Bali Road Map cites technology development and diffusion as strategic objectives, thereby inciting a debate on appropriate policies.
This debate is difficult in various respects. Environment-friendly technologies have been developed mostly in industrialized countries, but are urgently required to mitigate GHG emissions in fast-growing emerging economies. Ensuring their
3 This chapter is based on the following article: Dechezleprêtre, A., Glachant, M., Hascic, I.,
Johnstone, N., Ménière, Y. (2009). Invention and Transfer of Climate Change Mitigation Technologies on a Global Scale: A Study Drawing on Patent Data, commissioned by the Review of
global diffusion thus implies considerable policy and economic challenges because developing countries are reluctant to bear the financial costs of catching up alone, while firms in industrialized countries refuse to give away strategic intellectual assets. The problem is compounded by the lack of information. In the absence of a clear, widespread understanding of what constitutes a ‘climate change mitigation technology’, and also of how such technologies are diffused in the world, reaching consensus is a daunting task.
Against this background, the purpose of this paper is to shed light on the geographic distribution of climate mitigation inventions on a global scale. Using a worldwide patent database, we identify 13 different classes of technologies with significant global GHG emission abatement potentials, and analyze inventive activities and their international transfer between 1978 and 2003. More precisely, we consider seven renewable energy technologies (wind, solar, geothermal, ocean energy, biomass, waste-to-energy, and hydropower), methane destruction, climate-friendly cement, energy conservation in buildings, motor vehicle fuel injection, energy-efficient lighting and carbon capture & storage (CCS). Although we cover a wide range of climate-friendly technologies, note that a number of other important technologies have not been included such as clean coal technologies or electric vehicles due to data constraints. The technologies included in our data set represent nearly 50% of all GHG abatement opportunities beyond business as usual until 2030—excluding forestry—identified by Enkvist et al. (2007).
offer a good indication of the results of innovative activity and allow for interesting cross-country comparisons. Moreover, the database contains information from a large number of patent offices, and thus enables us to draw insights about international technology transfer.
The literature on the development and transfer of non-environmental technologies is extensive. They usually rely on patent data from OECD countries, especially from the USA. Eaton and Kortum (1996, 1999) use patent data from five leading economies to estimate the effect of international technology flows on domestic productivity. They find that research performed in the US and Japan together account for two thirds of the growth in Germany, France and the UK. Co (2002) studies the evolution of innovative activity across US States in 42 industrial sectors between 1963 and 1997. She finds that patent-lagging regions catch up with patent leaders and that knowledge diffusion between States is a significant determinant of patent growth. Note that whereas few studies use patents to measure direct technology diffusion, many papers use patent citations as an indicator for international technology spillovers (see for example Peri, 2005).
A different line of research investigates how patenting influences innovation and diffusion in an international context. In particular, it seeks to analyze the impacts of the TRIPS agreement which has reinforced intellectual property rights. Among other results, this literature highlights the fact that effective patent protection is a means to promote technology transfer towards developing countries that already have a certain level of technological capability (Maskus, 2000; Smith, 2001; Maskus et al., 2004; Mancusi, 2008; Parello, 2008). Barton
(2007) discusses from a legal perspective whether strong intellectual property rights in emerging economies would hinder or promote the transfer of renewable energy technology. He finds that patent issues could be a barrier for the transfer of solar PV technologies, but not for wind power and biofuels, because production is less concentrated in these two sectors.
As compared to the literature dealing with non-environmental technologies, the number of studies focusing on environmental technologies is much more limited. A few papers focus on the role of environmental regulation in the development and diffusion of climate-related technologies (see for example Popp, 2006; Popp et al., 2007). Johnstone et al. (2008) analyze the effects of policy and market factors on innovation with respect to renewable energy technologies in IEA countries. In a recent paper, Verdolini and Gazeotti (2009) analyze international knowledge flows and foreign R&D spillovers in energy-efficient technologies.
To the best of our knowledge, this work is the first study using patent data to quantitatively describe the geographical and temporal trend of innovation and diffusion of climate-mitigation technologies at global level. A paper by Lanjouw and Mody (1996) is the most closely related to our work. These authors analyze patents protecting environmentally responsive technologies in Japan, Europe, the USA and fourteen developing countries. They identify the leaders in environmental patenting and find that significant transfers occur to developing countries. However, they do not focus on climate change mitigation technologies. Moreover, the data in this paper are more recent and cover more countries.
In this paper we advance well beyond this work. We use the EPO/OECD World Patent Statistical Database (PATSTAT) which includes patents from 81 national and international patent offices. This allows us—contrary to most studies focusing on a single patent office—to conduct a global analysis of innovative activity, including patents filed in developing countries. Moreover, it is the first time that indicators are constructed so that absolute cross-country comparisons can be made. We present the methodology that we implemented to limit biases stemming from the differences in propensity to patent across countries.
The paper is organized as follows. Section 2 introduces the key concepts and discusses the use of patents as indicators of innovation and technology transfer. The dataset is presented in Section 3 along with data issues. In Section 4 we describe innovative activity in the world between 1978 and 2003, across different countries and technologies. Section 5 analyzes the international transfer of technologies. A final section summarizes the main results.
2 Patents as indicators of innovation and technology transfer
There are a number of possibilities for the measurement of innovation (see OECD Main Science and Technology Indicators 2008). Most commonly, R&D expenditures or the number of scientific personnel in different sectors are used. Although such indicators reflect an important element of the innovation system, there are a number of disadvantages associated with their use. For example, data on private R&D expenditures are incomplete. Furthermore, the data are only
available at an aggregate level. Importantly, they are measures of inputs to the innovation process, whereas an “output” measure of innovation is broadly preferable.
By contrast, patent data focus on outputs of the inventive process (Griliches 1990). They provide a wealth of information on the nature of the invention and the applicant. Most importantly, they can be disaggregated to specific technological areas. Finally, they indicate not only the countries where inventions are made, but also where these new technologies are used. These features make our study of climate mitigation technologies possible. Of course they present drawbacks which are discussed below.
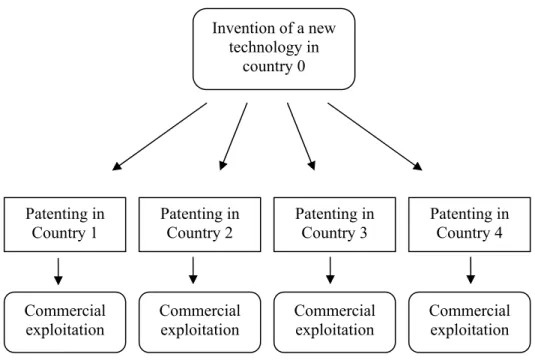
In order to provide an accurate explanation of the indicators presented, it is necessary to briefly recall how the patent system works. Figure 1 depicts a simplified innovative process. In the first stage, an inventor from country 0 discovers a new technology. He then decides to patent the new technology in certain countries. A patent in country i grants him the exclusive right to commercially exploit the innovation in that country. Accordingly, the inventor patents his invention in a country i if he plans to use it there. The set of patents related to the same invention is called a patent family. The vast majority of families include only one country (often that of the inventor, particularly for large countries).
In this paper we use the number of families as an indicator of the number of inventions and the number of patents invented in country 0 and filed in country i as an indicator of the number of innovations transferred from country 0 to country i.
These indicators are only imperfect proxies. The first limitation is that patents are only one of the means of protecting innovations, along with lead time, industrial secrecy or purposefully complex specifications (Cohen et al., 2000; Frietsch and Schmoch, 2006). In particular, inventors may prefer secrecy to prevent public disclosure of the invention imposed by patent law, or to save the significant fees attached to patent filing. However, there are very few examples of economically significant inventions which have not been patented (Dernis and Guellec, 2001). Invention of a new technology in country 0 Patenting in Country 1 Patenting in Country 2 Patenting in Country 3 Patenting in Country 4 Commercial exploitation Commercial exploitation Commercial exploitation Commercial exploitation
Importantly, the propensity to patent differs between sectors, depending on the nature of the technology (Cohen et al., 2000). It also depends on the risk of imitation in the country. Accordingly, patenting is more likely to concern countries with technological capabilities and a strict enforcement of intellectual property rights. In this study we have developed a method which partly controls for this problem.
A further limitation is that a patent grants only the exclusive right to use the technology in a given country. It does not mean that the patent owner will actually do so. This could significantly bias our results if applying for protection does not cost anything, so that inventors might patent widely and indiscriminately. But this is not the case in practice. Patenting is costly—in terms of both the costs of preparation of the application, and the administrative costs and fees associated with the approval procedure (see Helfgott, 1993, and Berger, 2005, for EPO applications). Moreover, if enforcement is weak, the publication of the patent in the local language can increase vulnerability to imitation (see Eaton and Kortum, 1995 and 1999). Therefore, inventors are unlikely to apply for patent protection in a country unless they are relatively certain of the potential market for the technology covered.
However, the fact remains that the value of individual patents is heterogeneous. Moreover, its distribution is skewed: as many patents have very little value, the number of patents does not perfectly reflect the value of innovations. Methods have been developed to mitigate this problem (see Lanjouw et al. 1998), for instance, the use of weights based on the number of times a given
patent is cited in subsequent ones. Unfortunately our data do not allow us to implement these methods.
3 Data description
Over the past several years, the European Patent Office (EPO) along with the OECD’s Directorate for Science, Technology and Industry have developed a worldwide patent database—the EPO/OECD World Patent Statistical Database (PATSTAT). PATSTAT is unique in that it covers more than 80 patent offices and contains over 70 million patent documents. It is updated bi-annually. Patent documents are categorized using the international patent classification (IPC) and national classification systems. In addition to the basic bibliometric and legal data, the database also includes patent descriptions (abstracts) and harmonized citation data. PATSTAT data have not been exploited much until now for they became available only recently. Our study is the first to use PATSTAT data pertaining to climate change mitigation.
We have extracted all the patents filed from 1978 to 2003 in 13 climate-mitigation fields4: 6 renewable energy technologies (wind, solar, geothermal, ocean energy, biomass and hydropower), waste use and recovery, methane destruction, climate-friendly cement, energy conservation in buildings, motor vehicle fuel injection, energy-efficient lighting and carbon capture & storage (CCS). The
4 Two types of patent are excluded from our search: utility models and design applications. Utility
models are of shorter duration than regular patents and do not require the same inventive step. Registered designs protect only the appearance of products, for example the look of a computer monitor.
precise description of the fields covered by the study can be found in Table 1. This represents 273,900 patent applications filed in 76 countries. On average, climate-related patents included in our data set represent 1% of the total annual number of patents filed worldwide.
Patent applications related to climate change are identified using the International Patent Classification (IPC) codes, developed at the World Intellectual Property Organization (WIPO)5. The IPC classes corresponding to the climate mitigation technologies are identified in two alternative ways. First, we search the descriptions of the classes online to find those which are appropriate6. Second, using the online international patent database maintained by the European Patent Office7, we search patent titles and abstracts for relevant keywords. The IPC classes corresponding to the patents that come up are included, provided their description confirms their relevancy.
5 Some previous studies have related patent classes to industrial sectors using concordances (e.g.
Jaffe and Palmer 1997). The weaknesses of such an approach are twofold. First, if the industry of origin of a patent differs from the industry of use, then it is not clear to which industrial sector a patent should be attributed in the analysis. This is important when studying specifically “environmental” technology because in this case the demand (users of technology) and supply (inventors of technology) of environmental innovation may involve different entities. Often, “environmental” innovations originate in industries which are not specifically environmental in their focus. On the other hand, some “environmental” industries invent technologies which are widely applicable in non-environmental sectors (e.g. processes for separation of waste; separation of vapors and gases). More fundamentally, the use of sectoral classifications (and commodity classifications) will result in a bias toward the inclusion of patent applications from sectors that produce environmental goods and services. By contrast, the application-based nature of the patent classification systems allows for a richer characterization of relevant technologies. (See OECD 2008 for a full discussion of the relative merits of the approach adopted for this report.)
When building the data sets, two possible types of error may arise: irrelevant patents may be included or relevant ones left out. The first error happens if an IPC class includes patents that bear no relation to climate mitigation. In order to avoid this problem, we carefully examine a sample of patent titles for every IPC class considered for inclusion, and exclude those classes that do not consist only of patents related to climate change mitigation. This is why key technologies in terms of carbon reduction potential are outside the scope of this study. Important missing technologies include electric vehicles, energy efficient technologies in industry, or clean coal technologies.
The second error—relevant inventions are left out—is less problematic. We can reasonably assume that all innovation in a given field behaves in a similar way and hence our datasets can be seen at worst as good proxies of innovative activity in the field considered. However, overall innovative activity may be underestimated and totals may be less reliable than trends.
The definitions of the IPC codes used to build the datasets can be found in Annex 1. The number of applications by technology field can be found in Annex 2.
We also deal with the issue of patent breadth. It is well known among experts in intellectual property rights that the number of patents that is granted for a given innovation varies significantly across countries. A usual illustration is Japan where patent breadth is said to be particularly low. We address this problem by examining international patent families. Recall that each family corresponds to a particular innovation. The study of international families yields information on the number of patents in the countries where the innovation is patented. We use
this information to calculate country weights. As an illustration, we found that, on average, seven Japanese patents result in approximately five European patents when filed at the EPO. This means that one EPO patent is equivalent, on average, to 1.4 Japanese patents. We set the weight of applications at the EPO to unity, meaning that the statistics presented below yield the number of ‘EPO-equivalent’ inventions. The EPO-equivalent country weights for various patent offices are available in Annex 3.
Other specific problems concern patents in the US, where until 2000 published data concerned only granted patents, while other offices provide data on
applications. Patent counts in Europe also involve specific difficulties because of
the procedural specificities of the European Patent System. Finally, the inventor’s country of residence is not available for some patent applications. Annex 4 presents details on how we treat these problems.
Table 1. Description of the technology fields covered Technology
field Description of aspects covered
Biomass Solid fuels based on materials of non-mineral origin (i.e. animal or plant); engines operating on such fuels (e.g. wood).
Buildings
Elements or materials used for heat insulation; double-glazed windows; energy recovery systems in air conditioning or ventilation.
CCS Extraction, transportation, storage and sequestration of CO2.
Cement
Natural pozzuolana cements; cements containing slag; iron ore cements; cements from oil shales, residues or waste; calcium sulfate cements.
Geothermal Use of geothermal heat; devices for producing mechanical power from geothermal energy.
Hydro
Hydro power stations; hydraulic turbines; submerged units incorporating electric generators; devices for controlling hydraulic turbines.
Lighting Compact Fluorescent Lamps; Electroluminescent light sources (LED)
Methane
Equipment for anaerobic treatment of sludge; biological treatment of waste water or sewage; anaerobic digestion processes; apparatus aiming at collecting fermentation gases.
Ocean Tide or wave power plants; mechanisms using ocean thermal energy conversion; water wheels.
Solar
Solar photovoltaic (conversion of light radiation into electrical energy), incl. solar panels; concentrating solar power (solar heat collectors having lenses or reflectors as concentrating elements); solar heat (use of solar heat for heating & cooling).
Waste
Solid fuels based on waste; recovery of heat from waste incineration; production of energy from waste or waste gasses; recovery of waste heat from exhaust gases.
4 Descriptive statistics on innovation
In this section we discuss the level of innovation outputs across technologies and countries, and the time trend over the period 1978-2003.
4.1 General figures
The average number of inventions is about 7,300 per year in the last 6 years of our dataset (1998-2003). The innovation trend since 1978 is depicted in Figure 2. As a benchmark, we also represent the evolution of the annual number of inventions in all sectors. The graph clearly shows that while the trend for climate-friendly technologies was little different than that for technologies overall until the end of the nineties, the growth rate after this point is much higher than the rate for technologies overall. This suggests a significant influence of climate change policies since the signing of the Kyoto protocol in 1997.
The fact that the protocol seems to have affected innovation so rapidly, although it was ratified as recently as 2002 by the European Union and its Member States, is not that surprising. First, it is well documented that innovators react swiftly to policy changes and the adoption of the protocol clearly sent a strong signal to the private sector. Secondly, many countries took early action, passing laws and adopting regulations as if Kyoto was already ratified, well before it actually was. For example, climate policies had already been implemented in the European Union in the early 1990s.
Figure 2: Innovation trend in climate technologies* compared to all sectors 0 10 0 20 0 30 0 # o f i n v e nt io ns ( 1 9 7 8 = 1 0 0 ) 1978 1983 1988 1993 1998 2003 Year
Climate change technologies All sectors
Kyoto Protocol 0 10 0 20 0 30 0 # o f i n v e nt io ns ( 1 9 7 8 = 1 0 0 ) 1978 1983 1988 1993 1998 2003 Year
Climate change technologies All sectors
Kyoto Protocol
Kyoto Protocol
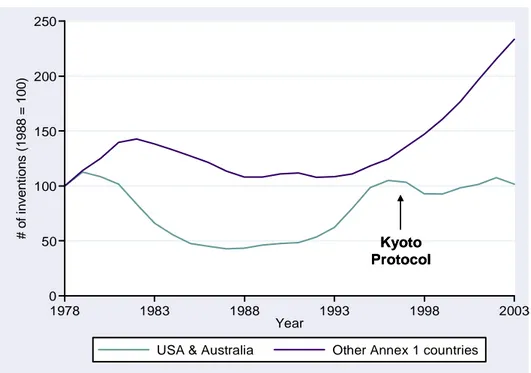
Figure 3: Innovation trend in Annex 1 countries
0 50 100 150 200 250 # of i n v e nt io ns ( 1 9 8 8 = 10 0 ) 1978 1983 1988 1993 1998 2003 Year
USA & Australia Other Annex 1 countries
Kyoto Protocol 0 50 100 150 200 250 # of i n v e nt io ns ( 1 9 8 8 = 10 0 ) 1978 1983 1988 1993 1998 2003 Year
USA & Australia Other Annex 1 countries
Kyoto Protocol
Kyoto Protocol
This influence of the protocol is also suggested by Figure 3 which compares innovation performance of Annex 1 countries, which have ratified the Kyoto protocol, with the USA and Australia, which have not (until very recently as regards Australia). On this graph, each patent is counted according to the inventor's country of residence. The good performance of Annex 1 Kyoto signatories could reflect a general growth of innovation in all technologies (including non-environmental ones) driven by other factors. However, Figure 4 invalidates this hypothesis: the graph presents the share of climate-related patents in the total number of inventions patented by inventors from the USA and Australia on the one hand and from other Annex 1 countries on the other hand and it shows the same difference between the two sets of countries. The Kyoto protocol seemingly increased innovation activities in the countries that ratified it.
Figure 4: Share of climate-related inventions in Annex 1 countries
0 0.5% 1% 1.5% 2% S h ar e o f c lim at e-re la te d i n v e nt io ns 1978 1983 1988 1993 1998 2003 Year
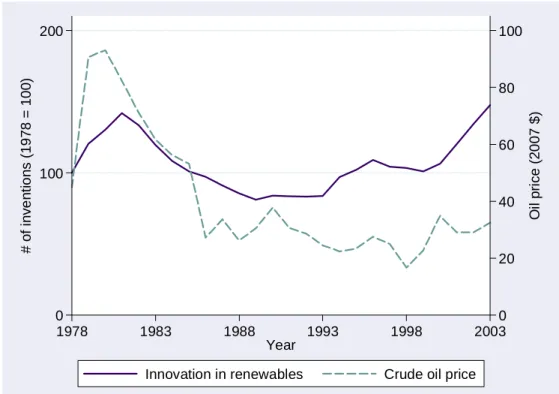
In specific areas, the evolution of oil prices seems to have had a significant influence. As shown in Figure 5, this is the case of renewable energies. Note that the level of innovation in 2003 just equals the early 1980s record high in this area.
Figure 5: Innovation in renewable energy technologies between 1978 and 2003, in comparison with oil prices
0 20 40 60 80 100 O il pr ic e ( 2 0 0 7 $ ) 0 100 200 # of i n v e nt io ns ( 1 9 7 8 = 10 0) 1978 1983 1988 1993 1998 2003 Year
Innovation in renewables Crude oil price
4.2 Innovation by technology
We now consider the different technology classes. Recall that patent breadth varies across sectors and that we have controlled only for cross-country heterogeneity. As a result, observed differences between technologies may reflect differences either in patent breadth or in innovation outputs.
Keeping this important limitation in mind, Figure 6 below shows that the recent level of innovation output differs widely across technologies. Lighting and
fuel injection are clearly dominant, with about 2,000 and 1,500 inventions per
year, respectively. This corresponds to large R&D-intensive industries where patents are perceived as an efficient means of protection (Cohen et al. 2000). By contrast, CCS, geothermal, cement, biomass, ocean, hydro and methane have fewer than 500 inventions per year over the same period. This group is heterogeneous. Biomass, hydropower and geothermal energy have already reached maturity whereas ocean energy and CCS are currently in the early development stages.
Figure 6: Average number of annual patented inventions 1998-2003, by technology 0 50 0 1, 00 0 1, 50 0 2, 00 0 # of i n v e nt io ns CC S Geothe rmal Cem ent Biom ass Oce an Hydr o Meth ane Wind Build ings Sola r Wa ste Fuel inje ction Ligh ting
What about trends since 1978? To answer the question, we have used as a benchmark the growth of inventions that are technologically similar to the technology classes of interest, without necessarily being related to the environment. The sectoral benchmarks reflect the growth of patenting activity in electricity production, motor vehicles, buildings, cement and lighting. The IPC codes that we used for these benchmarks can be found in Annex 5.
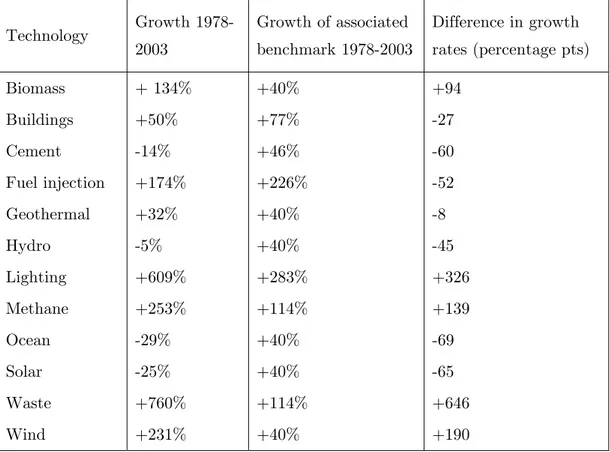
Table 2 shows the difference between the growth rate of innovation for each technology between 1978 and 2003, and the growth rate in the sectoral benchmarks. Carbon capture and storage is a new field with very few inventions and is treated separately.
Innovative activity in climate-change related technologies increased faster than in the corresponding benchmark in 5 fields out of 12. The growth of innovation is particularly strong in lighting, waste, wind, biomass and methane, whereas it is weak in the ocean, solar, hydro and geothermal classes. This result could be expected in the case of mature technologies such as hydro and geothermal, but is more surprising in the case of solar and ocean. Interestingly, the growth of innovation in fuel injection systems is also lower than that of the motor vehicle sector as a whole.
The evolution of all technology fields between 1978 and 2003 is shown in Annex 6.
Table 2: Growth of innovation by technology between 1978 and 2003, in comparison with relevant benchmarks
Technology Growth 1978-2003 Growth of associated benchmark 1978-2003 Difference in growth rates (percentage pts) Biomass + 134% +40% +94 Buildings +50% +77% -27 Cement -14% +46% -60 Fuel injection +174% +226% -52 Geothermal +32% +40% -8 Hydro -5% +40% -45 Lighting +609% +283% +326 Methane +253% +114% +139 Ocean -29% +40% -69 Solar -25% +40% -65 Waste +760% +114% +646 Wind +231% +40% +190
Are these innovation efforts in line with future needs? Figures 7 relates the average level of patenting in the recent period to the potential of abatement by 2030, i.e. the quantity of GHG emissions that can be avoided at the global level at a cost below 40 €/tCO2e. This graph suggests that innovation is in line with future abatement potential However, the graph highlights the specificity of
lighting on the one hand and of buildings on the other. It suggests that innovation
Figure 7: Average annual growth rate of patenting 1998-2003 and global GHG abatement opportunities up to 2030
Renewables Methane CCS Fuel injection Lighting Buildings Cement -5% 0% 5% 10% 15% Avg g rowth of pate n tin g 0 1 2 3 4
Abatement potential until 2030 (GtCO2e)
Note: abatement potential until 2030 with a cost below 40 €/ton of avoided CO2e emissions
Source: McKinsey / Vattenfall analysis & authors’ calculations
4.3 Leading inventor countries
Where do innovations take place? The PATSTAT database includes information on the country of residence of patent applicants, independently of the country where applications are filed. We use this indicator to measure the performance of inventor countries.8
Table 3 displays the main inventor countries between 1998 and 2003. Japan, the USA and Germany are the three main inventors in most technologies (details
8 Patents with multiple inventors are counted fractionally. For example, if two inventor countries
on the top 3 inventors for each technology can be found in Annex 7). With more than 40% of the world’s inventions on average, the performance of Japan is particularly impressive. It ranks first in all fields, except in biomass where it is second. In terms of percentage, Japan accounts for over 50% of the world's innovations in methane, waste and lighting.
Table 3: Top 10 inventors, with average % of total inventions (1998 - 2003)
Country Rank
Average % of world inventions
Most important technology classes
(decreasing order)
Japan 1 40.8 % All technologies
USA 2 12.8 % Wind, solar, hydro, methane, buildings
Germany 3 12.7 % Biomass, Ocean, Waste, CCS, wind, solar
China 4 5.8 % Cement, geothermal, solar, hydro, methane
South Korea 5 4.6 % Lighting, ocean, hydro, biomass, cement
Russia 6 4.2 % Geothermal, cement, hydro, CCS, ocean
France 7 2.4 % Cement, CCS, buildings, biomass, hydro
UK 8 1.9 % Ocean, biomass, wind, methane Canada 9 1.5 % Hydro, wind, CCS, ocean Brazil 10 1.1 % Ocean, building
technologies9 confirm the strong leadership of Japan: with $US 220 million spent in 2004, Japan alone outweighs the sum of US and EU15 public R&D spending (respectively $US 70 million and $US 50 million in 2004).
Interestingly, the three world’s leaders are followed by China, South Korea and Russia. Surprisingly, some emerging countries are already major innovators. As shown in Annex 7, these countries have strong positions in particular fields, namely geothermal and cement (China and Russia), biomass (South Korea) and
CCS (Russia).
Together, EU27 countries represent 24% of innovation.
Table 3 suggests that the production of innovation in climate-related technologies is strongly concentrated in a limited number of inventor countries. For a more synthetic view, we calculate an index based on the countries’ shares in the world patented inventions. The index is equal to:
H
=
s
i2i=1
n
∑
where si is the share of inventions patented by country i, and n is the number
of countries. This index is directly adapted from the so-called Herfindahl-Hirschman Index (HHI) which is commonly used by antitrust authorities to measure the concentration in markets. Above 0.2, it characterizes a strong concentration; below 0.1, it denotes a weak concentration.
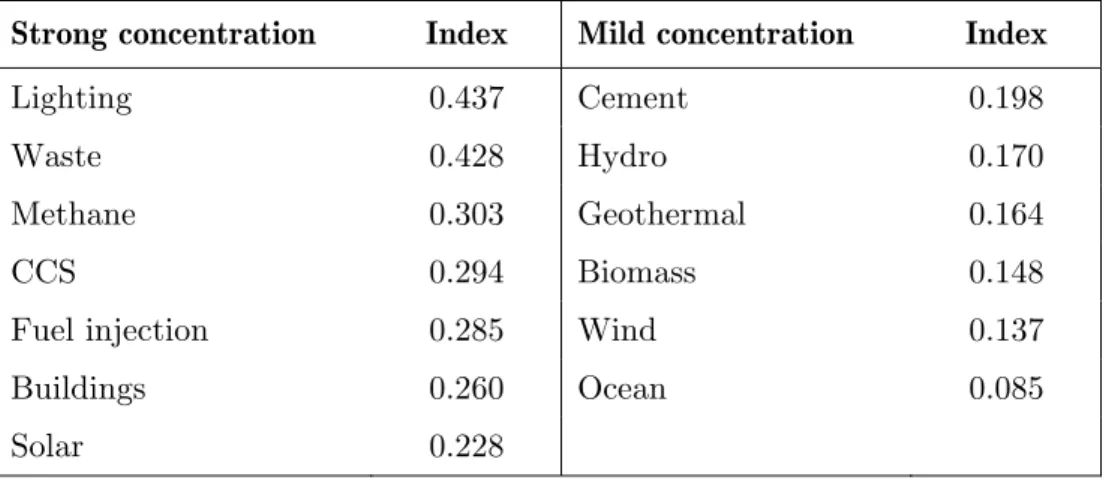
Table 4 presents this index for each technology. We have used the standard threshold of 0.2 to sort out the technology classes for which innovation is highly
concentrated. This approach highlights contrasting degrees of concentration across technologies.
Table 4: Spatial concentration of innovation for each technology (1998 - 2003)
Strong concentration Index Mild concentration Index
Lighting 0.437 Cement 0.198
Waste 0.428 Hydro 0.170
Methane 0.303 Geothermal 0.164
CCS 0.294 Biomass 0.148
Fuel injection 0.285 Wind 0.137
Buildings 0.260 Ocean 0.085
Solar 0.228
Interestingly, technology classes exhibiting a high concentration index also seem to be those with the highest innovation outputs. Figure 8 represents the concentration index as a function of the volume of innovation and confirms this positive correlation. This suggests the existence of specialization gains which enable certain countries to benefit from comparative advantages in certain technology fields.
4.4 A focus on Carbon Capture and Storage
Given the potentially huge importance of CCS in the medium term, we consider it relevant to dedicate a specific subsection to these technologies. Identifying patent applications related to carbon capture and storage is difficult since there is no IPC code corresponding precisely to CCS inventions. However, IPC class B01D53 includes inventions relative to “chemical or biological
B01D53/62 sub-class which concerns carbon oxides, and identified patents dealing specifically with carbon dioxide. To this data set we added patents found through a keyword search on titles—thus biased towards patents published in English. We searched for titles mentioning “capture”, “storage” or “sequestration” together with “CO2” or “carbon dioxide”. This dataset is a good proxy of innovative activity in CCS.
Figure 8: Concentration indices as a function of the annual innovation flow by technology Waste Ocean Methane Geothermal Fuel injection Lighting Buildings Cement Wind Solar Hydro Biomass CCS 0 .1 .2 .3 .4 C o nc e n tr at io n i n d e x 0 500 1000 1500 2000 Annual # of inventions
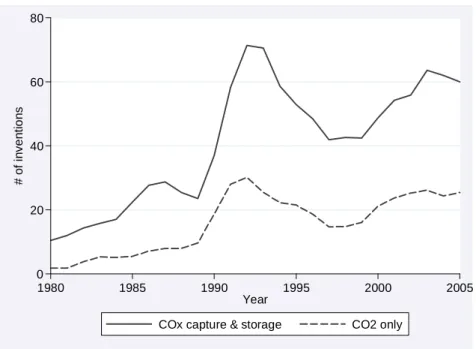
Figure 9 displays the number of yearly inventions in CCS technologies from 1980 to 2005. The solid line includes all patents in the data set and the dashed line includes only patents specifically dealing with CO2. Surprisingly, the annual number of inventions increased steeply in the late 1980s, reaching a peak in 1992, before falling for about 5 years. Since 1997 the level of innovation has been
increasing gradually, but in 2005 it was still below the 1992 record high. According to our data set, between only 25 and 60 inventions sought legal protection in 2005.
Figure 9. Patented innovation in carbon capture & storage, 1980-2005
0 20 40 60 80 # of i n v e nt io ns 1980 1985 1990 1995 2000 2005 Year
COx capture & storage CO2 only
Note that we probably underestimate the actual rate of innovation, since many inventions designed to isolate, transport and store gases are likely to have potential applications for CO2. However, our data shows that there are still very few inventions with specific CO2 capture & storageapplications.
Between 2000 and 2005, Japan accounted for over half of these inventions, followed by the US, which has been particularly active in the late 1990s and early 2000s. Other countries such as France, Russia and UK are also starting to emerge as significant sources of invention.
4.5 A focus on emerging economies
We have already seen that certain emerging countries—China, Russia, and South Korea in particular—are performing well in certain areas (geothermal,
cement, biomass). Apart from these countries, what is the overall picture? Table
5 displays statistics on selected emerging countries.10 It clearly shows that China, South Korea and Russia are the only significant innovators in this group of countries.
Table 5: Averages of the share of world innovations in each technology field for selected emerging economies (1998-2003)
World rank
Average % of world inventions.
Most important technology classes (decreasing order)
China 4 5.8 % Cement, geothermal, solar, hydro,
methane
South Korea 5 4.6 % Lighting, ocean, hydro, biomass,
cement
Russia 6 4.2 % Geothermal, cement, hydro, CCS,
ocean
Brazil 10 1.1 % Ocean, building
Taiwan 18 0.6 % Ocean, lighting
India 30 0.2 % Cement
Mexico 34 0.1% Ocean
South Africa 53 0.03%
10 Note that Least Developed Countries are not present in our dataset, for two related reasons: their
Emerging countries accounted for 16.3% of patented climate-friendly innovations in 2003. As shown in Figure 10, this is the result of a continuous increase which accelerated in the mid-nineties. Between 1997 and 2003, the share of inventions patented by emerging countries grew at an average annual rate of 18%. Additional figures on the growth of innovation in emerging countries for each technology field can be found in Annex 9.
The case of the former USSR and the transition economies is also very interesting. Before 1990, the Soviet Union and its satellite countries were steadily catching up with developed countries. Their innovative output then fell dramatically after the collapse of the Soviet Union.
Figure 10: Share of inventions by inventor country groups (1978 - 2003)
0 20% 40% 60% 80% S h a re of i n v e nt io ns 1978 1983 1988 1993 1998 2003 year
Developed countries Emerging ecos Former USSR & transition ecos
5 International technology transfer
We now study where inventions are used and in particular whether they cross national borders. International patent families provide interesting indicators of the international transfer of technologies. Inventors who want to enter markets in foreign countries usually seek patent protection in these countries for their most valuable innovations. We use the proportion of international families—the share of inventions that are patented in at least two countries—to measure the degree of internalization of markets for technology. At the country level, a large share of international families among inventions developed by domestic inventors denotes a good performance in terms of technology exports.
Figure 11 shows the export rate of climate change technologies between 1978 and 2003. As a benchmark we report in the same graph the evolution for all technologies. The export rate varied significantly over the period. It decreased sharply between 1978 and 1984—possibly after a peak due to the 1979 oil crisis which temporarily increased the international demand for energy-efficient technologies—and then increased until 2003.
Although this trend marks a real progression of technology internationalization since 1983—from 16% of inventions to 23% in 2003—, the export rate in 2003 only equals its 1978 value. This sounds very modest. However, the graph shows that it is not that much lower than the rate for all technologies. Furthermore, unlike the case of innovation, the signature of the Kyoto Protocol does not seem to have had a significant impact on the international diffusion of climate mitigation technologies as compared to the overall trend in all sectors.
Figure 11: Percentage of international families, 1978-2003. 10% 15% 20% 25% Ex p o rt ra te (% o f in te rn a ti o n a l fa m ili e s ) 1978 1983 1988 1993 1998 2003 Year
Climate change technologies All sectors
Kyoto Protocol 10% 15% 20% 25% Ex p o rt ra te (% o f in te rn a ti o n a l fa m ili e s ) 1978 1983 1988 1993 1998 2003 Year
Climate change technologies All sectors
Kyoto Protocol
Kyoto Protocol
5.1 The geography of international technology flows
The PATSTAT database identifies the inventor countries—the countries of residence of the inventors—and the recipient countries—the countries where the invention is patented. We define an exported invention as a patent granted to an inventor from a country different from that in which protection is sought, e.g. a patent filed in the US by a German inventor.
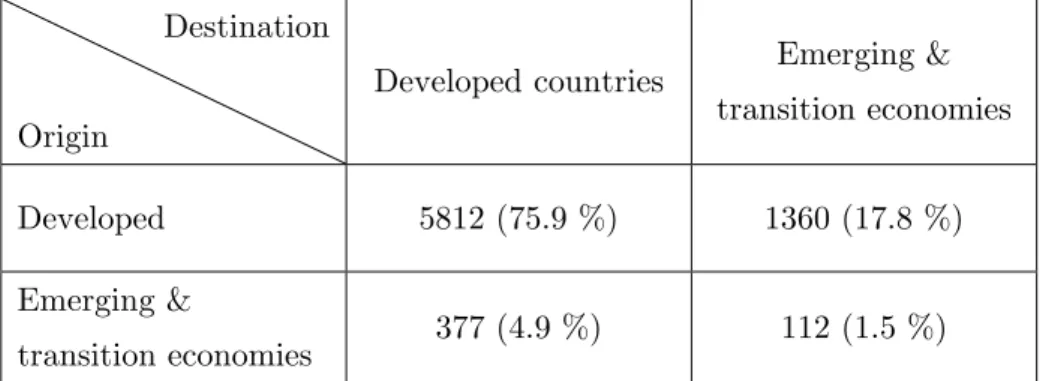
Table 6 gives the origin and destination of the inventions exported in the period 1998-2003. Clearly, international transfer essentially concerns the developed countries. North-South transfer accounts for less than 20 % of all exported inventions. South-South transfers are almost non-existent. Nevertheless,
Figure 12 shows that this has been evolving very quickly since the end of the nineties.
Table 6: Origin-Destination matrix giving the average annual number of exported inventions from 1998 to 2003 (% in brackets)
Destination
Origin
Developed countries Emerging & transition economies
Developed 5812 (75.9 %) 1360 (17.8 %) Emerging &
transition economies 377 (4.9 %) 112 (1.5 %)
Figure 12: International trends in technology flows, 1978-2003.
0 10 00 20 00 30 00 40 00 50 00 60 00 # of e x po rt e d in v e n ti ons 1978 1983 1988 1993 1998 2003 Year
North North North South South North South South
In this graph, “North” countries are Annex 1 countries and “South” countries are non-Annex 1
5.2 International transfer by technology
Figure 13 below displays the export rate, as measured by the percentage of international families, by technology. It differs substantially between technology classes (from 13% to 45%) and tends to reflect the level of maturity of each class. The most internationalized technology classes are fuel injection (45%), biomass (37%) and lighting (30%). The fuel injection and lighting classes correspond to internationalized industries that invest heavily in R&D (as shown in Figure 6). The case of biomass is different, since the global number of patented innovations is much lower in this mature renewable energy technology class. This suggests an original pattern of modest but strongly internationalized innovation.
The less internationalized technologies (cement, methane, hydro, ocean,
geothermal) are also those with the lowest numbers of inventions. These features
denote limited inventive activity taking place mainly on a local scale. Besides
cement, they concern either mature (except, again, biomass) or emerging
renewable energy technologies.
The average size of international families, as measured by the number of countries where patent protection is asked for, provides information on the size of the markets targeted by patent owners. In contrast to export rates, the size of international families is relatively constant among technology fields: on average, exported inventions are patented in about 5 countries, with peaks at 6 for wind and biomass. This suggests that the size of the international market for technology (as measured by the number of countries where patent protection is sought) does not vary significantly across technology fields. The most frequent
Figure 13: Export rate and size of international families by technology(1998-2003) 0% 5% 10% 15% 20% 25% 30% 35% 40% 45% Cem ent Meth ane Hydr o Ocea n Ge othe rmal Solar Build ings Wind Wa ste Ligh ting Bioma ss Fue l in jecti on % o f in te rn a ti o n a l fa m ilie s 0 1 2 3 4 5 6 7 # o f c oun tr ie s
Export rate Family size
5.3 Exporting countries
Figure 14 shows the rate of export for the 10 main inventor countries presented in Table 3. Interestingly, export rates vary widely across countries and the main innovators are not necessarily the best exporters. More than half of German inventions are exported. But the export rate is below 20% for Japan. More generally, Figure 14 shows very good performances of western countries (Germany, France, the USA, Canada and the UK). By contrast, emerging economies—with the exception of South Korea—export much less.
Figure 14: rate of exports for the 10 main inventor countries (1998-2003) 0 20% 40% 60% E x p o rt ra te
BRA RUS CHN JPN KOR USA CAN FRA GER GBR Note: the export rate of inventions is the percentage of inventions that have been patented in at least one country other than the inventor’s country
In Figure 15, we seek to compare the countries’ performances in terms of innovation and technology exports countries. The graph represents each according to their average ranking as inventor and as technology exporter in each technology field. The observations suggest a positive link between invention and exports, but also highlight important differences between three categories of countries.
In the top right corner, Japan, the USA and Germany stand out as world leaders in both innovation and exports. On the left-hand side, a group of medium-sized European economies have excellent performances in terms of technology exports, given their limited contributions to world inventions. This
suggests that inventors in these countries are strongly oriented towards international markets.
By contrast, emerging economies such as China, South Korea and Russia have good innovative performances in some technologies (especially in geothermal,
cement and lighting), but scarcely export their inventions. Inventors in these
countries seem to focus primarily on local markets, either because their inventions mostly address local needs or because they lack the resources to export their technologies.
Figure 15: Countries’ performances in invention and technology exports (1998-2003) JPN USA GER KOR CHN RUS FRA GBR CAN AUT ESP NLD ITA AUS SWE CHE TW BEL DNK 0 5 10 15 20 25 A v g ex p o rt er r ank 0 5 10 15 2 0 2 5
Avg inve ntor rank
JPN USA GER KOR CHN RUS FRA GBR CAN AUT ESP NLD ITA AUS SWE CHE TW BEL DNK 0 5 10 15 20 25 A v g ex p o rt er r ank 0 5 10 15 2 0 2 5
Avg inve ntor rank
5.4 Importing or innovating?
We define technology imports in a country as the foreign inventions that are patented in that country. As regards imports, a key question is whether they crowd out local innovations. Figures 16 and 17 allow us to answer that question. They unambiguously show that the volume of imports is positively correlated with the volume of local innovations. But they also show a negative correlation between the volume of local innovations and the share of imports
How can we reconcile these two statements? In fact, Figure 17 suggests that there is a “crowding out effect”. But Figure 16 shows that this effect is compensated by demand factors: when demand for climate change technologies increases in a country, this boosts both local innovations and imports.
Figure 16: Number of local inventions and number of imported inventions (logs) for selected countries (1998-2003)
JPN GER USA KOR CHN RUS FRA GBR CAN TW NLD BRA AUT AUS ESP DNK POL CHE SWE BEL FIN HUN ISR NOR IND HKG SVK MEX LUX ARG ZAF IDN 0 2 4 6 8 10 # of i m po rt e d in v e n ti ons ( lo g ) 0 2 4 6 8 10
Figure 17: Number of inventions (log) and share of imported inventions for selected countries (1998-2003) JPN GER USA KOR CHN RUS FRA GBR CAN TW NLD BRA AUT AUS ESP DNK POL CHE SWE BEL FIN HUN ISR NOR IND HKG SVK MEX LUX ARG ZAF IDN 20% 40% 60% 80% 100% % of i m po rt e d in v e n ti ons 1 3 5 7 9
# of local inventions (log)
6 Conclusion
In this paper we use the PATSTAT database to identify and analyze patented inventions in 13 climate-related technology classes between 1978 and 2003. This allows us to draw major conclusions concerning the dynamics and distribution of innovation, and the international transfer of technology.
A first set of results concern the impact of the Kyoto Protocol. Statistics suggest the protocol has induced more innovation in the recent period. While innovation in climate change technologies and innovation in all technologies were growing at the same pace until the mid-nineties, the former is now developing much faster. Between 1998 and 2003, innovation in climate mitigation