Early Diagnosis of Cancer Using
Light Scattering Spectroscopy
by Vadim Backman
M.S., Physics, Massachusetts Institute of Technology (1998)
SUBMITTED TO THE HARVARD UNIVERSITY - MIT DIVISION OF
HEALTH SCIENCES AND TECHNOLOGY IN PARTIAL FULFILLMENT OF
THE REQUIREMENTS FOR THE DEGREE OF DOCTOR OF PHILOSOPHY
IN MEDICAL ENGINEERING AND MEDICAL PHYSICS
at the
Massachusetts Institute of Technology
-May 2001
O 2001 Massachusetts Inst ute of Technology. All rights reserved.
Signature of Author:
Certified by: Accepted by:ARCHIVES
,SSACHUSETTS INTT OF TECHNOLOGY AUG 1 4 2001 LIBRARIESThe Harvard-TiT sion of ffeathiences and Technology
May 2001
Michael S. Feld, Ph.D.
Professor, Department of Physics, MIT Thesis Supervispor
Lev T. Perelman, Ph.D. Assistant Professor, Harvard Medical School
Thesis Supervisor
' V
T
.. ,1 .,
. v anna L. LJray. Mn.).Director, The Harvard-MIT Division of Health Scienc s and Technology
Edward Hood Taplin Professor of Med kal Engineering and Electrical Engineering. MIT
Early Diagnosis of Cancer with Light Scattering Spectroscopy
by
Vadim Backman
Submitted to the Harvard-MIT Division of Health Sciences and Technology in partial fulfillment of the requirements for the Degree of Doctor of Philosophy in
Medical Engineering and Medical Physics, May 2001
Abstract
This thesis presents a novel optical technique, light scattering
spectroscopy (LSS), developed for quantitative characterization of tissue
morphology as well as in vivo detection and diagnosis of the diseases associated with alteration of normal tissue structure such as precancerous and early cancerous transformations in various epithelia. LSS employs a wavelength dependent component of light scattered by epithelial cells to obtain information about subcellular structures, such as cell nuclei. Since nuclear atypia is one of the hallmarks of precancerous and cancerous changes in most human tissues, the technique has the potential to provide a broadly applicable means of detecting epithelial precancerous lesions and noninvasive cancers in various organs, which can be optically accessed either directly or by means of optical fibers.We have developed several types of LSS instrumentation including 1) endoscopically compatible LSS-based fiber-optic system; 2) LSS-based imaging instrumentation, which allows mapping quantitative parameters characterizing nuclear properties over wide, several cm2, areas of epithelial lining; and 3)
scattering angle sensitive LSS instrumentation (a/LSS), which enables to study the internal structure of cells and their organelles, i.e. nuclei, on a submicron scale. Multipatient clinical studies conducted to test the diagnostic potential of LSS in five organs (esophagus, colon, bladder, cervix and oral cavity) have shown the generality and efficacy of the technique and indicated that LSS may become an important tool for early cancer detection as well as better biological understanding of the disease.
Thesis Supervisors: Michael S. Feld, Ph.D., Professor, MIT
Acknowledgements
First of all, I must sincerely thank my research advisors Prof. Michael S. Feld and Prof: Lev T. Perelman for their scientific guidance, support, and personal attention. It is not an overstatement to say that it was my great pleasure and privilege to work with you and have you as my mentors and friends. Michael. thank you
for
the opportunity to work in your lab and learn so much about research. Thank you for your drive, optimism, and scientific and personal guidance. I,ev, I am grateful to my fortune for having the opportunity to work with you and learn not only about science, but also about life.This thesis could not possibly be completed without contribution fiomrn many people. I thank all the members of the Spectroscopy l,aboratory at MIT. I thank Dr. Irving Itzkan for his personal attention and for helping me during some of the most difficult periods of my graduate career. I thank Dr. Ramachandra Dasari for his constant scientific and personal support. I thank Dr. Kamran Badizadegan and Dr. Charles Boone for being my colleagues and for providing me with the crucial understanding of pathology. I would like to thank Dr. Rajan Gurjar for being my friend and partner. This work could not be completed without your hard work. I thank my friends and colleagues Dr. Venkatesh Gopal. Maxim Kalashnikov. D)r. Irene Georgakoudi. and Dr. Adam Wax who contributed immensely to the project. Special thanks goes to my friend Marcus Zaichick Mueller, who is a true optimist in the bottom of his heart, for shaping and sharing my vision on life. I would like to thank our clinical collaborators Dr. Stanley Shapshay. Dr. Michael Wallace. Dr. Fitzmaurice. Dr. Crowford. Dr. Van Dam. Special thank to Dr. Stanley Shapshay for letting me spend some time in his department at NEMC and learn a great deal about the head and neck surgery. I thank Dr. Martha Gray for constant support throughout my years at HST. It is thanks to vou I will remember my years at HST as the best time of my life.
Saving the best fr last. I thank my family for all the best that I am, because I owe it to ou. and I ask you to forgive me for the rest, because it is against all you have done and I owe it to myself: There are no words that can describe how grateful I am to my mother, who passed away too early to see me being called a Doctor. You know that I thank you every single day of my life in my thoughts. If I try to put in words all my thanks to my father. it will take longer than the rest of my thesis. So let me just say that I love you and I owe all my success to you. I thank my sister for the joy she brings to my' life. I thank Lev and Marina tor their patience and support. I love you all. Finally. I thank my ery special friend Eugenia for being by my side and for supporting me during the most difficult periods of my life. You made me keep running. You fill every single day of my life with happiness. This thesis is your accomplishment as much as it is mine. I could not have done this without ou.
Table of Contents
1 Introduction ... 15
1.1 Optical Techniques in Medicine ... 18
1.1.1 Therapeutic Applications of Biomedical Optics ... ... 18
1.1.2 Diagnostic Applications of Biomedical Optics ... 19
1.1.2.1 Spectral Diagnosis Using Elastically Scattered Light... 20
1.1.2.2 Biomedical Diagnosis Using Fluorescence
Spectroscopy
...
...
22
1.1.2.3 Biomedical Diagnosis Using Raman Spectroscopy... 23
1.1.2.4 Biomedical Optical Diagnostic Imaging ... 23
1.2 Organization of the Thesis ... ... 26
References ... 29
2 Histology of Mucosal Tissues ... 39
2.1 Morphology of the Cell ... 41
2.2 Histology of Mucosa ... 47
2.3 Introduction to Histopathology of Early Cancer and Dysplasia ... 51
References ... 59
3 Introduction to Light Scattering ... 61
3.1 Rigorous Solution of Direct Scattering Problem ... 62
3.2 Numerical Solutions of the Scattering Problem ... 65
3.3 Approximate Solutions of the Scattering Problem ... 68
3.3.1 Light Scattering by Particles with Sizes Smaller or Comparable to the Wavelength ... 68
3.3.2 Light Scattering by Particles Large Compared to the
Wavelength ...
72
3.3.3 General Properties of Light Scattering by Large Non-Spherical Composite Particles ... 78
3.4 Origin of Light Scattering in Cells ... .. 84
References ... 91
4 Principles of Light Scattering Spectroscopy:
Analysis of Single Scattering ...
....
94
4.1 Introduction to Light Scattering Spectroscopy ... ... 95
4.2 Diagnosis of Precancer with Single and Multiply Scattered Light ... 98
4.3 Analysis of Single Scattering Component ... 100
4.3.1 Analytical Treatment of Single Scattering Component ... 100
4.3.2.1 Mie Theory-Based Analysis ... 110
4.3.2.2 Fourier Transform-Based Analysis ... 113
References ...
119
5 Principles of Light Scattering Spectroscopy:
Removal of Diffusive Background ... 1225.1 Model Based Approaches to Diffusive Background Removal ... 123
5.1.1 Modeling Diffusive Background Using Diffusion
Approximation ...
126
5.1.2 Modeling Diffusive Background Using Exponential Model ... 130
5.1.2.1 Exponential Model ... 131
5.1.2.2 Studies with In Vivo Esophageal Tissue ... 133
5.2 Removal of Diffusive Background Using Polarization
Discrimination ...
137
5.2.1 Polarization Discrimination of Multiple Scattered Light ... 138
5.2.2 Experiments with Physical Tissue Models ... 140
5.2.3 Experiments with Cell Monolayers ... 147
5.2.4 Experiments with Ex Vivo Tissues ... 149
5.2.5 LSS with Polarized Light ... ... 156
References ...
...
159
6 Clinical Diagnosis of Precancerous Changes Using LSS ... 163
6.1 Clinical Diagnosis of Dysplasia in Human Epithelia Using LSS ... 166
6.2 Clinical Diagnosis of Dysplasia in Barrett's Esophagus ... 172
References ... 182
7 Biomedical Imaging with Light Scattering Spectroscopy ... 186
7.1 LSS Imaging Device ... 188
7.2 Calibration of LSS Imaging Device ... . 195
7.3 Experiments with Cell Monolayers ... 199
7.4 Measurement of Concentration and Mass of Nuclear Chromatin Using LSS ... 204
7.5 LSS Imaging of Ex Vivo Tissues ... 209
References ...
215
8 Measurement of Tissue Structure on Submicron Scale with LSS .... 219
8.1 Scattering Angle Sensitive Light Scattering Spectroscopy ... 221
8.2 Calibration of Scattering Angle Sensitive LSS Device ... .. 227
8.3 Experiments with Cell Monolayers ... 230
8.4 Experiments with Animal Models ... 235
9 Summary and Future Directions ...
243
9.1 Summary ... 2...4...3...
9.2 Potential Applications of LSS ...
...
...
251
List of Figures
2.1 Low power microphotograph of a section of the esophageal wall illustrating the major structures of the gastrointestinal tube. L -lumen. E - epithelium, CT - connective tissue, MM - muscularis mucosa, BV submucosal blood vessel, SM submucosa, MP
-muscularis propria ...
...
56
2.2 Microphotograph of an H&E stained section of the bronchial wallillustrating major components of the mucosa: epithelium and connective tissue. ... ... 56
2.3 Examples of epithelia. (a) simple coumnar epithelium, (b) -stratified squamous epithelium, (c) - pseudo-stratified epithelium, (d) - transitional epithelium ... 57
2.4 Dysplasia in the cervical stratified squamous epithelium. On the left, non-dysplastic epithelium is preserved. Dysplastic nuclei are pleomorphic (vary in size and shape), hyperchromatic (appear darkly stained with nuclear dyes due to excessive quantities of chromatin) and abnormally enlarged ... 58
3.1 Diagram illustrating geometry of light scattering in near forward
directions. ...
...
73
3.2 Total cross section o as a function of =-(m-) ... 76
3.3 Schematic diagram illustrating phase shift , of the light ray traversing path h(r) inside a non-spherical and non-uniform particle ... 79
4.1 Patterns of angular distribution of light scattered at azimuthal angles 0 and Ao, which are predicted by the Mie theory for spherical particles of (a) 20 gtm and (b) 10 pm. Brightness indicates intensity of scattered light at particular angle ... 105
4.2 Angular distribution of light scattered by a large (10 /um in diameter) sphere for two wavelengths: (a) -
X=400nm; (b)
-X=350nm. For comparison, (c) shows intensity of scattering by an "isotropic scatterer" that scatters all of the incident light4.3 Oscillatory component of light scattered by a cell monolayer. The dotted line shows the spectrum measured in the experiment. The solid line shows the signal predicted by the Mie theory ... 116
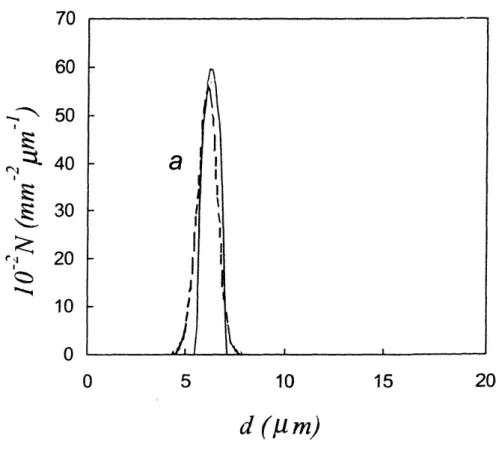
4.4 Size distributions of normal intestinal epithelial cell nuclei measured with LSS (solid line) and using conventional morphometry of the stained cell monolayer (dashed line) ... 117
5.1
Absorption coefficient !'a
of oxygenated (HbO,) and
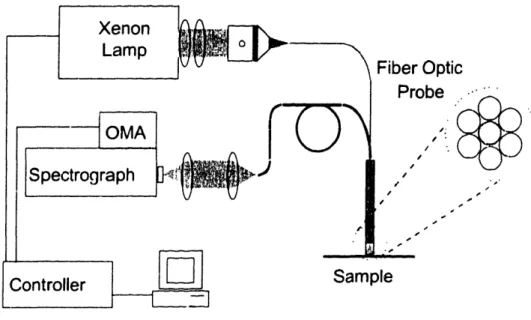
deoxygenated (Hb) forms of hemoglobin ... 1285.2 Experimental setup used in the experiments with in v'ivo tissues... 134
5.3 Reflectance from Barrett's' esophagus. (a) Reflectance from non-dysplastic site (solid line), dysplastic site (dashed line), and model fit (thick solid line); (b) corresponding single scattering components. ... ... 135
5.4 Nuclear size distribution obtained from the reflectance spectra from Barrett's' esophagus tissue sites: non-dysplastic site (solid line) and dysplastic site (dashed line) ... 136
5.5 Schematic diagram of LSS system for polarization discrimination of the diffusive background. ... 139
5.6 Residual signal <Al> from a single layer model averaged over 450-750 nm wavelength range measured for various values of optical depth . <Al> is normalized to one when --->oo. ... 142
5.7 Reflectance spectra of two-layer tissue model. The top layer consists of polystyrene beads in water, d=4.65 tm, n=1.19. (a) Parallel polarization, (b) perpendicular polarization. Note the characteristic hemoglobin dips ... 143
5.8
Spectra of polarized (residual) component of backscattered light
from two-layered tissue model. Top layer: (a) d=4.65 m beads in water (n=1.19); (b) d=5.7 pm beads in glycerol (n=1.09). The data (dashed lines) are in good agreement with the Mie calculations (solid lines). Absorption features of hemoglobin are completely removed ... ... 1455.9 Binary plot showing an agreement between the true diameters of polystyrene beads (dt) obtained with non-optical techniques and the diameters obtained with LSS (dLss). Each population of beads is represented by an open circle. The more accurate the measurement, the closer the corresponding circle to the diagonal
line ... 146 5.10 Microphotograph of the stained isolated normal intestinal
epithelial cells (panel A) and intestinal malignant cell line T84 (Panel B). Note the uniform nuclear size distribution of the normal epithelial cell (A) in contrast to the T84 malignant cell line which at the same magnification shows a larger nuclei and more variation in nuclear size (B). Solid bars equals 20um in each panel ... 148 5.11 Spectra of polarized components of light backscattered by (a)
normal intestinal cells and (b) T84 intestinal malignant cells. A monolayer of cells was placed on top a gel cotntaining hemoglobin and barium sulfate. Dashed line, experimental data; solid line, the Mie theory fit. See text for details ... 150
5.12 Nuclear size distributions for T84 intestinal malignant cells and normal intestinal cells. In each case, the solid line is the distribution extracted fom the data, and the dashed line is the distribution measured using light microscopy of stained cells ... 151
5.13 Spectra of the polarized components of light backscattered by (a) normal human colon tissue and (b) tumorous colon tissue. Dashed line, experimental data; solid line, the Mie theory fit ... 152
5.14 Size distributions of epithelial cell nuclei obtained with LSS for (a) normal and (b) cancerous colon tissue samples. Size
distribution of the nuclei form the cancerous site illustrates
nuclear enlargement, pleomorphism, and hyperchromasia(increased refractive index) ... 153
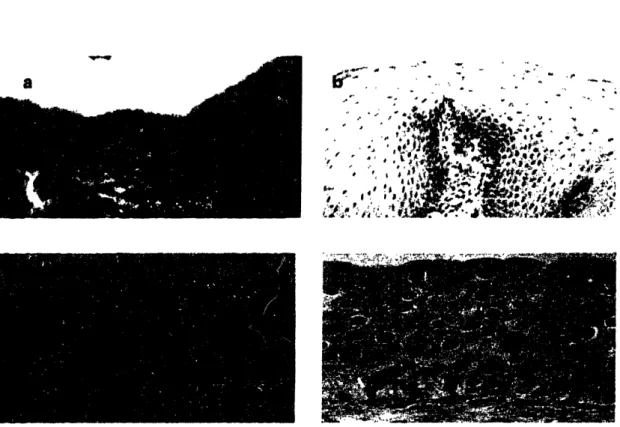
5.15 (a) Size distributions of the epithelial cell nuclei measured with LSS from the endo- and exocervix. (b) A typical histological section of the simple columnar epithelium lining the surface of the endocevix. (c) A typical histological section of the squamous stratified epithelium lining the surface of the exocevix ... 154
6.1 (a) Schematic diagram illustrating measurement of reflectance signal from esophageal tissue using fiber optic probe. An endoscope and a probe approaching the esophageal wall is shown. (b) Photograph obtained during the endoscopy.
Esophageal wall and a Barrett's esophagus segment are seen. (c) Photograph obtained during the collection of the spectroscopic data from the esophageal tissue during a routine esophagoscopy.
Fiber optic probe and biopsy forceps are shown ... 167
6.2 Examples of the epithelial nuclear size distributions N(d) obtained in vio with LSS from the urinary bladder. Transitional cell CIS epitheliurn exhibits greater nuclear population density (total number of nuclei per unit area) and percentage of large (>10 m) nuclei relative to the non -dysplastic transitional epithelium (-20%, vs. 3%) ... 169
6.3 Comparison of the parameters of the nuclear size distributions obtained in ivo using LSS with the histologic diagnosis in: (a)
Barrett's esophagus (non-dysplastic Barrett's mucosa (circles).
indefinite for dysplasia (filled squares), low grade dysplasia (filled circles), or high grade dysplasia (filled triangles)); (b) colon (normal colonic mucosa (circles) or adenomatous polyp (filled triangles)): (c) urinary bladder benign bladder mucosa (circles) or transitional cell carcinoma in situ (filled triangles)); and (d) oral cavity (normal (circles), low grade dysplasia (filled circles), or squamous cell carcinoma i sitit (filled triangles))... 171 6.4 Percentage of enlarged (>10 microns) nuclei and nuclearpopulation density (number of nuclei per 100 square microns), as detemined by LSS, for each of the 76 biopsy sites of the study set. The average histological diagnoses are indicated: NDB-circles; IND-squares; LGD-triangles; HGD-diamonds. The filled symbols denote samples diagnosed as dysplasia. The shaded symbols denote the 8 samples of the modeling set. The dashed line indicates the dysplasia/non dysplasia threshold used in the
prospective evaluation. ... ... 1777..7...
6.5 Binary decision graphs for the dichotomous groups representing the three histological thresholds. (a) NDB vs. (IND, LGD. HGD); (b) (NDB, IND) vs. (LGD, HGD); (c) (NDB, IND, LGD) vs.
HGD. The decision thresholds, determined by logistic 179 regression, are also shown. Key: NDB-circles; IND-squares;
LGD-triangles; HGD-diamonds. For each graph the filled symbols denote the group with the higher grades of dysplasia...
7.1 Schematic diagram of the LSS imaging set-up. (b) View from the top of the part of the device used to eliminate spurious beam
03-03' ...
189
7.2 Schematic diagram illustrating the principles of 4f-system... 1917.3 Schematic diagram illustrating the principles of LSS imaging 194
7.4 Comparison of the backscattering signal from 4.54 micron polystyrene beads in polyethylene glycol predicted by the Mie theory and signal measured experimentally using LSS device... 196
7.5 LSS imaging of three wells with polystyrene microspheres of different sizes. (a) Photograph of the wells containing microspheres. Bead diameters, from left to right, are 5, 10 and 6
tm repectively. (b) LSS image of of the three wells. Diameter is indicated by the color-bar ... 198
7.6 Two-layer tissue model with T84 cell monolayer on top of a suspension of Ba2SO4 particles and human blood used in LSS imaging studies shown in Fig. 7.7. (a) Original model with intact monolayer of cells as the top layer. (b) View from the top on model (a). (c) Model after a group of cells was removed. (d) View from the top on model (c) ... 200
7.7 LSS imaging of a two-layer tissue model with a monolayer of T84 cells on top of a diffusive layer. Polarized backscattering signal is shown for =589 nm. (a) image Ill; (b) image I; (c) image AI. Although the cells are not discernable on images (a) and (b), their backscattering is readily apparent when the the duffisive background us removed using polarization discrimination on image (c) ... ... 201
7.8 LSS imaging of two-layer tissue model with T84 colon tumor cell monolayer on top of a diffusibe background. (a) Micophotographs of the cell monolayer stained with a nuclear stain. (b) Color-coded contour map of nuclear sizes obtained 203 using LSS. (c) Color-coded contour map of nuclear sizes
obtained using morphometry on a stained microphotograph (a) ...
7.9 Gross and microscopic photographs of colonic polyps used for LSS imaging shown in Fig. 7.10. (a) and (b) show two polyps highlighted by arrows. (c) and (d) show microscopic sections of these polyps. Although the polyps are grossly similar, only one of them is dysplastic. Histological features identify polyp (a) as an adenoma and polyp (b) as an inflammatory polyp with no dysplasia. The insets show each polyp's surface epithelium at high magnification, illustrating dysplastic nuclear features in (c) but not in (d). Representative photomicrographs from each polyp and the surrounding normal tissue were used to measure the average diameter of the nuclei and their variations in size ... 209
7.10 LSS images of colon tissue samples. (a) and (b) LSS images showing the spatial distribution of the percentage of enlarged nuclei and amount of nuclear chromatin for the polyp of Fig. 7.9(a), respectively; (c) and (d) LSS images showing the spatial distribution of the percentage of enlarged nuclei and amount of nuclear chromatin for the polyp of Fig. 7.9(b), respectively. The polyps are marked by ellipses. ... 211
8.1 Schematic diagram of the aLSS apparatus. (b) Set-up to eliminate spurious beam 03-03'. (c) Detection system used in Mode I. (d) Detection system used in Mode II ... 222
8.2 Data collection using a/LSS apparatus. (a) Image created by lens L3 on fig. 8.1 in the detector (PL2) plane. (b) Data collection in Mode I. In this mode each pixel B on the CCD collects intensity of light scattered along direction (0, p) (c). In mode II, each pixel corresponds to a certain wavelength A, and scattering angle 0 (d)... 223 8.3 Ratio of angular distribution R=jii p; )'(!, I)/ ll1()(0,; A.) collected
in the experiment with polystyrene microspheres 9.8 m in
diameter for k=0.532 gm ...
... .. .
... 229
8.4 Experiments with two-layer tissue models with the upper layerformed by a monolayer of T84 colon tumor cells. (a) A color-coded contour map of the angular distribution collected using a/LSS device operated in mode 1. (b) Spectra of light scattered by cells in regions A and B marked on map (a). The analysis of these 231 spectra enabled to obtained quantitative characteristics of the size
distributions of scattering particles responsible for respective scattering spectra (c) ...
8.5 Correlation between values of spectral exponent P measured with LSS for living esophageal epithelial cells and dose of carcinogen applied to the esophagi. C - control (no carcinogen applied), LD - low dose, ID - intermediate dose, HD - high dose. In each measurement the value of is averaged over a population of approximately 10scells ... 236
List of Tables
3.1 Values of refractive index for some components of the cell ... 85
6.1 Summary of histologic diagnoses of study set ... 176
6.2 Sensitivity and specificity of the 68 sites prospectively evaluated by LSS in distinguishing samples diagnosed as non dysplastic and indefinite from those classified as low grade and
high grade dysplasia. ... 178
6.3 Sensitivity and specificity of multivariate LSS model at three different histologic thresholds ... 178
6.4 Inter-observer agreement between individual pathologists and
the average diagnosis of the three other pathologists, and
between the multivariate LSS model and the average diagnosisof all four pathologists ... 180
7.1 Comparison of the values of the mean nuclear diameters and standard deviations of nuclear sizes in the colon adenoma of Fig. 7.9(a) and surrounding non-dysplastic epithelium measured with LSS and using standard morphometry of the stained
tissues ...
...
212
9.1 Potential applications of LSS technology ... 251Chapter : Introduction
Chapter
1
Introduction
Significant advances in medical diagnostic technologies have been achieved over the last decades in such areas as magnetic resonance imaging (MRI) and spectroscopy, computed tomography (CT), nuclear medicine and ultrasound. However, these advances largely focused on structural or anatomic changes at the organ or tissue level. There is clearly a need and opportunity to stimulate the development of novel diagnostic technologies that exploit our current knowledge of the cellular and sub-cellular bases of disease. These technologies will have great implications on prevention and detection of diseases as well as targeted therapy. Apparently, the diagnostic techniques applicable in situ (inside human body) that can provide structural and functional information about the tissue at the cellular and subcellular level, the kind of information that is currently obtainable using in
vitro or techniques requiring tissue removal only, would be very useful.
Over the last decade several attempts have been made to develop methods to study human cells in situ non-invasively not only to provide accurate diagnosis but also to better understand the genesis of disease at the cellular level. Optical
Chapter 1: Introduction
methods have been shown to be very powerful tools for studying living tissues in
situ. Elastic [Mourant et al., !995; Yodh et al., 1995] and Raman [Rava et al.,
1991; Manoharan et al., 1998; Buschman et al., 1999; Deinum et al., 1999] scattering, absorption [Anderson wt al., 1981; Patterson et al., 1987], and fluorescence [Altano et al., 1989; Richards-Kortum et al., 1989; Schomacker et al., 1992; Zonios et al., 1998; Georgakoudi et al., 2001] of light can provide structural and functional information about the tissue. This information, in turn, can be used to diagnose and detect various diseases, including early cancer.
In this thesis we present a novel technology based on light scattering spectroscopy (LSS), which enables to identify and characterize premalignant abnormalities or other early changes in human tissues on cellular and subcellular level. Light scattering has long been used to study great variety of materials ranging from isolated atoms to complex condensed matter systems [Newton. 1969]. Biological tissue is yet another example of a complex system that can be studied with scattered light. One exciting application of LSS is non-invasive or minimally invasive detection of precancerous or early cancerous changes in human epithelium, a richly cellular layer lining the inner and outer surfaces of the body. Detection and diagnosis of such conditions is particularly important because most tumors are readily treatable if diagnosed at an early stage. Unfortunately, many forms of precancerous lesions are difficult to detect using conventional diagnostic techniques.
Cancers of epithelial origin, which represent more than 85% of all cancers [Landis et al., 1999], are generally preceded by a precursor condition known as dysplasia [Cotran et al., 1994]. Dysplasia is confined to the epithelial layer, and is characterized by cellular proliferation, abnormal appearance of the cell nuclei, and changes in tissue microarchitecture. In many cases the dysplastic tissue is flat and
Chapter 1: Introduction
indistinguishable from the surrounding non-dysplastic tissue. Since it cannot be distinguished, detection of such dysplastic tissue is based on random biopsy. The biopsied sample is then fixed, stained, and examined by a surgical pathologist. Microscopic examination of biopsy specimens of dysplastic tissue reveals characteristic morphologic changes in cell nuclei, which are hallmarks of dysplasia and early cancer. The nuclei become enlarged, crowded, hyperchromatic (abnormally darkly stained). The structure and organization of the cell nuclei is altered as well. Although the gross (macroscopic) appearance of dysplastic lesions in different organs and different types of epithelium can vary significantly, these cytologic changes are common to all types of precancerous and early cancerous conditions.
Despite these seemingly well-defined differences between normal and dysplastic tissues, there can be significant disagreement among even expert pathologists on the diagnosis. In some cases the inter-observer agreement can be as low as 50% [Riddell et al., 1983; Reid et al., 1988; Cotran, 1994]. The reason
for this is that pathology is partly science and partly art. Pathologists do not have the advantage of using objective quantitative information. The diagnosis, the choice of treatment and, consequently, the patient's well-being depend on a pathologist's ability to recognize a morphological pattern known to be associated with the disease.
Approaches to the diagnosis of disease based on techniques enabling objective and reproducible measurements can supplement or even surpass standard methods of histological diagnosis. Here we discuss LSS-based methods to probe epithelial morphology in living tissues, which do not require tissue removal.
ChaDter 1: Introduction
1.1 Optical Techniques in Medicine
Biomedical optics is a rapidly growing field that uses optical techniques for the purposes of biology and medicine. The applications of biomedical optics can be divided into two broad categories: therapeutic and diagnostic.
1.1.1 Therapeutic Applications of Biomedical Optics
Therapeutic applications employ the "effect of light on tissue" [Parrish et al, 1991]. These applications can be classified according to the type of changes induced in the tissue by light: mechanical, chemical, thermal, etc. Some of the major applications include laser ablation [Dixon et al., 1987, Itzkan et al, 1995] (mechanical changes), photodynamic therapy [Dougherty, 1989] (chemical changes), and laser hyperthermia Anghilery et al, 1986] (thermal changes). Laser ablation usually uses short high power pulses of laser light. They result in removal of the irradiated tissue. For example, PRK, a modality of laser ablation, is used to reshape the cornea of the eye. An important modification of this technique uses laser induced shock waves to ablate the tissue with minimal effect on the surrounding tissues [Itzkan et al, 1995]. This results in clean minimally invasive surgical intervention. Photodynamic therapy uses laser light to generate toxic chemicals from endogenous or exogenous molecules that mark a diseased tissue. This results in cellular necrosis and tissue destruction. Laser hyperthermia uses light at targeted wavelengths to increase tissue, i.e.tumor, temperature and induce thermal shock that again leads to cellular necrosis and tissue destruction.
Chapter 1: Introduction
1.1.2 Diagnostic Applications of Biomedical Optics
Several modalities of non-invasive or minimally invasive biomedical optical diagnosis, i.e. diffuse reflectance spectroscopy (DRS) [Farrell et al., 1992; Zonios et a., 1999], laser induced fluorescence (LIF) spectroscopy [Zonios et al., 1996;
Bigio et al., 1997], Rainan spectroscopy [Manoharan et al., 1998], and light scattering spectroscopy (LSS) [Perelman et al., 1998; Backman et al., 2000], have been developed and have shown favorable results in the diagnosis of variety of diseases, particularly precancerous and early cancerous changes in various tissues. The applications of biomedical optics generally employ the 'effect of tissue on light". One of the major advantages of optical diagnostic techniques is the fact that they can provide objective information about the tissue without need for tissue removal and in real time.
While most human organs can be examined by means of optical techniques, they are particularly suitable to diagnose pathological conditions in the organs easily accessed by optical fibers such as the organs of gastrointestinal, respiratory, urinary, and genital tracts. A tissue site or, in imaging applications, a wide area of tissue is irradiated by monochromatic or continuous wavelength light and light returned from or transmitted through the tissue is collected and analyzed. Thus, some tissue attributes can be revealed. These attributes include (1) macroscopic properties (architectural disorganization, changes in surface morphology, cell crowding, etc.), (2) cellular properties (enlargement and hyperchromasia of the cell nuclei, increased concentration of organelles, etc.). and (3) molecular (NAD/NADH shift, decreased activity of ferrochelatase, presence of abnormal proteins, etc.). Each of the spectroscopic techniques is sensitive to specific tissue
Chapter 1: Introduction
attributes. For example, fluorescence spectroscopy and Raman spectroscopy are sensitive to molecular attributes while diffuse reflectance spectroscopy and light scattering spectroscopy are well suited to provide information about morphological structure of the tissue at the cellular and macroscopic levels.
1.1.2.1
Spectral Diagnosis Using Elastically Scattered Light
Diagnosis of precancerous and early cancerous changes in various tissues using elastically scattered light has recently attracted significant research interest. Superficial targets, such as the uterine cervix and skin, can be accessed by open field optics. Epithelial tissues of some other hollow organs, such as esophagus or colon, can be accessed by means of optical fiber probes delivered through endoscopes and catheters. In any case, the tissue site under study is irradiated by monochromatic or broadband light, and the reflected light is collected and analyzed. Thus, some tissue attributes can be revealed. The ability to extract quantitative information in living cells, in situ, without perturbing them, could be used to study biophysical processes in living systems and to monitor morphological and physiological changes such as precancerous or cancerous conditions. Currently, such information can only be obtained by tissue removal or scraping. Techniques such as microscopy and flow cytometry can probe intracellular structure, but applying them in sitl is not possible.
Light Scattering in Biomedical Optics
Studies have been conducted to relate morphological and light scattering properties of cell structures. Beauvoit et al. [Beauvoit et al., 1998] have measured
Chapter 1: Introduction
the reduced scattering and absorption coefficients of the liver. They showed that most of the scattering from the liver is attributed to the mitochondrial content of the hepatocytes. Schmitt and Kumar [Schmitt et al., 1996] measured the variation in the refractive index of fibroblasts and showed the evidence of a broad distribution of scatterers ranging in size from 0.2 to 10 m. Beuhtan et al. [Beuthan et al., 1996] showed that the cell nucleus and membranes have refractive index significantly higher than that of the other subcellular structures. Sloot [Sloot et al., 1988] observed light scattering from lymphocytes and reported that the nuclei gave the main contribution to the forward scattering. Mourant and coworkers [Mourant et al., 1998] showed that the nucleus scatters more in the forward direction while smaller particles scatter at larger angles. Importantly, these results also showed that the scattering takes place due to the structures within the cells rather than from the cell surface. Most of these studies were done on cell suspensions. Hielscher and coworkers [Hielscher et al., 1997] used polarized back-scattered light to obtain images of biological cell suspensions. It was shown that in fibroblast, mitochondria were the strongest scatterers. Differences in mitochondria concentration were observed between healthy and diseased cells and tissues. However, neither of these works reported a technique capable of measuring sizes and refractive indexes of cells and their organelles in situ.
Diffuse Reflectance Spectroscopy
Diffuse reflectance spectroscopy (DRS) is a diagnostic modality of biomedical optics, which employs light returned from a tissue by means of elastic scattering. In DRS, white light is delivered to the tissue by means of an optical fiber probe. The scattered light is returned to a detector, usually by means of adjacent collection fibers, and its spectrum measured over a broad wavelength
Chapter 1: Introduction
range (e.g. 360-800 nm). Since light propagation in tissue is governed by elastic scattering and absorption, the reflected signal can provide inforniation about these tissue properties. This, in turn, can give information about particular types ol tissue absorbers (hemoglobin, for example) and scatterers (extracellular matrix, mitochondria, cell nuclei, etc.). Several reviews of this technique have appeared [Bigio et al., 1997; Farrell et al., 1992]. Researchers at G.R. Harrison Spectroscopy Laboratory have developed DRS techniques for characterizing and diagnosing adenomatous polypoid (precancerous) changes in human colon in vivo [Zonios et al., 1999], and for characterizing atherosclerotic lesions [Van de Pol et al., 1999]. Other groups have employed DRS to detect precancerous and cancerous transformations in organs such as the breast [Bigio et al., 2000], esophagus [Lovat et al., 2000], bladder [Mourant et al., 1995; Koenig et al., 1998], to characterize the orientation of collagen fibers and the integrity of connective tissues [Ferdman et al., 1993], and to measure tissue oxygenation in
vivo [Liu et al, 1995].
1.1.2.2 Biomedical Diagnosis Using Fluorescence Spectroscopy
Fluorescence spectroscopy uses a monochromatic laser source to illuminate the tissue, and the fluorescence signal at the wavelengths longer than that of the illumination is collected. The signal is substantially weaker than that of the diffuse reflectance. While reflectance spectroscopy is best suited to detect changes in tissue morphology, fluorescence signals depend on the presence of various tissue fluorophores such as collagen, elastin, NADH, and porphyrins. Reviews of this technique can be found in [Bigio et al., 1997; Zonios et al., 1998]. Fluorescence spectroscopy enables to obtain information about chemical composition of the
Chapter 1: Introduction
tissue. It has been applied to detect atherosclerosis of aorta and coronary artery
[Richards-Kortum et al., 1991; Van de Poll, et al., 1999], dysplasia in bladder
[Arendt et al., 1999], adenomatous polyps in colon [Kapadia et al., 1990; Zonios et al., 1996; Mahadevan-Jansen et al., 1998], brain stroke [Schantz et al., 1998], and cancers in esophagus [Vo-Dinh et al., 1998], dysplasia in eaophagus [Georgakoudi et al., 2001], breast [Ganesan et al., 1998], cervix [Mitchell et al., 1999; Georgakoudi et al., 2001], oral cavity [Schantz et al., 1998], and bronchi [Kurie et al., 1998].
1.1.2.3 Biomedical Diagnosis Using Raman Spectroscopy
A Raman spectrum is generated by a frequency shift in the excitation light, which is due to the vibrations and rotations of the molecules within a sample. A fiber delivers laser light at an infrared wavelength. The back-scattered light is collected by a fiber bundle and is sent to the spectrometer. Since most biological molecules are Raman-active and have distinctive spectral features, Raman spectra can be used to obtain concentrations of various chemical tissue components such as proteins, glucose, lipids, nucleic acids, and many others. This technique has been used to diagnose breast malignancies [Manoharan et al., 1998], atherosclerosis in coronary artery [Brennan et al., 1997] and to estimate the glucose levels in blood [Berger et al., 1997].
1.1.2.4 Biomedical Optical Diagnostic Imaging
As discussed earlier, optical techniques such as fluorescence spectroscopy, Raman spectroscopy, and the spectroscopy of elastically scattering light provide
Chapter 1: Introduction
structural and biochemical information about the tissue, and have been shown to be powerful tools for studying living tissues in situl. A number of optical imaging modalities based on these techniques have been developed for near-surface diagnostic imaging.
Confocal Microscopy Imaging
Confocal microscopy eliminates multiple scattering in turbid samples, producing thin section images with high resolution and contrast. The images produced are due to light scattered backwards at interfaces of different refractive index. Multiple scattered light is rejected by means of a pinhole, which selects only light travelling in straight-line paths. The location and size of the pinhole, among other variables, determine the depth and lateral resolution of the system, Several research groups have demonstrated the use of confocal scanning microscopes for imaging human and animal tissues, both in vivo and ex vivo [Petroll et al., 1996]. Skin and oral mucosa are easily accessible with this technique. The technique has also been applied to image bladder [Koenig et al., 1999], embryo [Kulesa et al., 1999; Gonzalez et al., 1999], kidney [Kneen et al., 1999], skin [Rajadhyaksha et al., 1998], and retina [Vierra et al., 1999]. Reported image depth depended on the type of tissue studied, and ranged from 350 microns to I mm, with a lateral resolution of 0.5-1 microns and axial resolution of 3-5 microns.
Optical Coherence Tomography
Optical coherence tomography (OCT) utilizes the coherent properties of light to obtain cross sectional images of scattering media such as living tissue. This technique employs low coherence light (i.e. light with a short coherence length) in
Chapter 1: Introduction
a Michelson interferometer. The specimen is placed at the end of the sample arm. Backscattered light is combined with light returning from the mirror in the reference arm. Constructive interference occurs only when the distance to a scattering interface in the sample matches that to the reference mirror within the coherence length. Depth is probed by scanning the reference mirror position and detecting the envelope of the interference signal. Cross-sectional images can be built up from multiple axial scans at different transverse positions in the sample. As in confocal microscopy, image formation is again due to refractive index change. In turbid tissues, imaging depths of the order of I mm can be achieved, with resolution of the order of several tens of microns. OCT has been used to obtain in
vivo images of clear tissues such as the human eye [Hee et al., 1995] and turbid
tissues such as esophageal mucosa [Kobayashi et al., 1998]. It has also been used to image intra-arterial walls, arthritic cartilage and gynecologic neoplasms, and
in-vitro frog embrios [Fujimoto et al., 1999: Boppart et al., 1998; Pitris et al., 1999].
Recently, a related set of techniques, based on interference light scattering spectroscopy has been developed in G.R. Harrison Spectroscopy Laboratory. These techniques combine dispersion spectroscopy with low-coherence interferometry [Yang et al., 1999; Yang et al., 2000; Yang et al., 2001].
Polarization-based Imaging
Several groups have used polarized light to image superficial tissues. Anderson et al. [Anderson et al., 1991] used polarized light to enhance contrast in skin images by separating the specular and multiple-scattered components of light emerging from the skin surface. Demos et al. [Demos et al., 1996; Demos et al., 1997] showed that polarized gating can enhance the images of surface and
sub-Chapter 1: Introduction
surface structures in biological tissues. Jacques et al. used polarized light to image superficial layers of human skin [Jacques et al., 2000]. Bartel and Heischler [Bartel et al., 2000] have imaged the spatial distribution of polarized light returned to the surface of a random media, such as a suspension of polystyrene micro-beads or cells, by means of scattering. They measured the degree of polarization retained after multiple scattering events, and compared the experimental results with those of models based on a Monte Carlo algorithm that computes two-dimensional elements of the diffuse backscattering Mueller matrix. They showed that model predictions and experimental data were in good agreement, and that some properties of the scattering particles comprising the medium can be inferred by measuring the spatial distribution of the polarized scattered light.
The above techniques all create physical images, based on refractive index changes at interfaces within the medium, and all are limited in resolution by optical wavelength considerations (so-called diffraction limit). In this thesis we introduce a novel modality of biomedical imaging based on LSS to study superficial tissues such as epithelia. It will be shown that LSS imaging allows exceeding the diffraction limit in a sense that it enables to measure the sizes of scattering objects, such as cell organelles, with sub-wavelength accuracy.
1.2 Organization of the Thesis
This thesis presents a novel optical technique, light scattering spectroscopy (LSS), developed for quantitative characterization of tissue morphology as well as
in vivo detection and diagnosis of certain diseases associated with alteration of normal tissue structure such as precancerous and early cancerous transformations
Chapter 1: Introduction
in various epithelia. LSS employs a wavelength dependent component of light scattered by epithelial cells to obtain information about subcellular structures, such as cell nuclei. Since nuclear atypia is one of the hallmarks of precancerous and cancerous changes in most human tissues, the technique has the potential to provide a broadly applicable means of detecting epithelial precancerous lesions and noninvasive cancers in various organs, which can be optically accessed either directly or by means of optical fibers.
The thesis consists of eight chapters. Chapter 2 provides a brief introduction to histology of human epithelia and mucosal tissues as well as to histopathology of precancerous and early cancerous transformations.
Chapter 3 introduces the basics of light scattering and discusses the relationship between the structure of cells and tissues presented in Chapter 2 and their light scattering properties.
Chapter 4 introduces light scattering spectroscopy. The basic principles of LSS are discussed in this chapter. LSS aims to distinguish between a single scattering component and a multiple scattering component (diffusive background) of light returned from a tissue by means of elastic scattering. The spectrum of the single scattering component is then analyzed to provide quantitative information about cell and tissue structure. Chapter 4 discusses the methods of analysis of the single scattering component.
Chapter 5 discusses methods to remove the diffusive background. Experiments with tissue models and ex vivo and in vivo tissues testing principles and capabilities of LSS are discussed as well.
Chapter 1: Introduction
Chapter 6 builds on the foundations presented in Chapters 4 and 6. It reports the multipatient clinical studies showing that LSS enables to diagnose precancerous changes in four different organs (esophagus, colon, bladder, and oral cavity), thus, illustrating the generality and efficacy of the technique.
Chapter 7 presents a novel biomedical imaging modality based, on LSS. LSS imaging allows probing the structure of the epithelial cell nuclei over wide areas of tissue. Studies with ex vivo tissues are presented.
Chapter 8 introduces another modality of LSS, scattering angle sensitive light scattering spectroscopy aiLSS), that enables to probe the internal structure of cells and their organelles, i.e. cell nuclei, at a subniicron scale.
Finally, Chapter 9 summarizes the main results of the work and discusses some of the potential future applications of LSS technology.
Chapter I: Introduction
References
Alfano RR, Prahdan AA, Tang GC, Wahl SJ, "Optical spectroscopic diagnosis of cancer and normal breast tissues", J. Opt. Soc. Amer. B 6(5) 1015-1023 (1989).
Anderson RR and Parish JA "The optics of human skin" J. Invest. Dermialol. 77, 13-19 (1981).
Anderson RR, "Polarized light examination and photography of the skin", Arch.
Derinatol., 127, 1000-1005, (1 991).
Andersson-Engels S, Klinteberg C, Svanberg K, Svanberg S, "In vivo fluorescence imaging for tissue diagnostics", Phys. Med. Biol., 42, 815-24 (1997).
Anghilery LJ and Robert J, HLperthermia in Cancer Teatment, (CRC Press,
Boca Raton, 1986).Arendt J T, "Detection of early cancerous changes and cancer in bladder tissue by autofluorescence and reflectance," V- , thesis, School of Ohio State University ( 1999).
Backman V, Gurjar R, Badizadegan K, Zonios G6, Itzkan , Dasari RR, Crawford JM, Van Dam J, Perelman LT and Feld MS, "Light Scattering Spectroscopy for Early Cancer Diagnosis", Laser Spectroscop)v World Scientific Publishing Co., Rainer Blatt et al. ed., 286-295 (1999).
Backman V, Gurjar R. Badizadegan K, Itzkan , Dasari R, Perelman LT, Feld MS. "Polarized light scattering spectroscopy for quantitative measurement of
epithelial structures in situ", IEEE .
Se. Topics Quantun Electron, 5.
1019-1027 (1999).
Backman V, Wallace MB, Perelman LT, Arendt JT, Gurjar R, Muller MG, Zhang Q, G. Zonios G, Kline E, McGillican T, Shapshay S, Valdez T, Van Dam J, Badizadegan K, Crawford JM, Fitzmaurice M, Kabani S, Levin HS, Seiler M, Dasari RR, Itzkan I and Feld MS, "Light scattering spectroscopy: a new technique for clinical diagnosis of precancerous and cancerous changes in human epithelia", Nature, 406, 35-36 (2000).
Chater 1: Introduction
Backman V, L.T. Perelman, J.T. Arendt, R. Gurjar, M.G. Muller, Q. Zhang, G.
Zonios, E. Kline, T. McGillican, T. Valdez, J. Van Dam, M. Wallace, K.
Badizadegan J.M. Crawford, M. Fitzmaurice, S. Kabani, H.S. Lcvin. M. Seiler, R.R.Dasari, . Itzkan, and M. S. Feld, "Light Scattering Spectroscopy: A New Technique for Clinical Diagnosis of Precancerous And Cancerous Changes in Human Epithelia", La.sers in Li 'iciences, in
press (2001 i).
Bartel S and Hielscher AH. "Monte Carlo simulations of the diftuse backscattcring Muller matrix for highly scattering media", .AI),) (Opt. 39, 1580-1588
(2000).
Beauvoit B, Chance B. "ime-resolved spectroscopy of mitochondria. cells and
tissues under normal and pathological conditions'. ll. (eIll. Biochem..
184. 445-55 (1998).
Berger AJ. Itzkan I. Feld MS. "Feasibility oft' measuring blood glucose concentration by near-infraredRaman spectroscopy' .j)tlctro(him A.cta .I
A.,l Hilolol Secmtos . 53A. 287-92 (
1')97)
Beuthan J. Minert O. Helfinann J. Herrig M and Muller (. "The spatial variation of the refactive index in biological cell;". Phi's. fMe(l. Biol., 41. 369-382 (1996).
Bigio IJ and Mourant JR. "Ultraviolet and visible spectroscopies for tissue diagnostics: fluorescence spectroscopy and elastic-scattering spectroscopy". Ph:s Mkle Biol. 42. 803-14 (1997).
Bigio IJ. Bown S(. Briggs (G. Kelley C, Lakhani S. Pickard D. Riplecy PM. Rose I(i, Saunders C('. "Diagnosis of breast cancer using elastic-scattering
spectroscopy: preliminary clinical results." J. Biotmecl. Optics.. 5. 221-228
(2000).
Boppart SA, Bouma BE, Pitris C, Southem JF, Brezinski ME. Fujimoto JG. "In vivo cellular optical coherence tomography imaging". latulre Medicine.
4, 861-5 (1997).
Brennan JF 3rd, Romer TJ, Lees RS, Tercyak AM, Kramer JR Jr, Feld MS, "Determination of human coronary artery composition by Raman
spectroscopy", Circulation, 96, 99-105 (1997).
Chapter 1: Introduction
Brown GL, McEwan, Pratt M, "Macromolecular weight and size of deoxypentose nucleic acids", Nature, 176, 161-162 (1955).
Buschman HPJ, Motz JT, Fitzmaurice M, van der Laarse A, Bruschke AV, Feld MS, "Human Coronary Atherosclerosis Studied by Morphological NIR Raman Confocal Microscopy", SPIE Proceedings, 3608: 7-1 1 (1999).
Bruce J Berne and Robert Pecora, Dtnamic light scattering -
tith
application. tocheisty,
hiologv and pYll sics. (Wiley New York 1976).
Chemrnyshev AV, Prots VI, Doroshkin AA and Maltser VP, "Measurenient of scattering properties of individual particles with a scanning tlow cytometer". .pp. Oprt.. 34, 6301-6309 (1995).
C(otran RS. Robbins SL, Kumar V, Robhins Pathological Ba.sis of l)i.isease (W.3. Saunders Company. Philadelphia. 1994).
Dainty JC ed., Laser Speckle and relatt d phetnomena (Springer-Verlag. Berlin 1975).
Davies HG, Deeley EM, Denby EF, "Attempts at measurement of lipid, nucleic acid and protein content of cell nuclei by microscope-interferometry', Exp. Cell Res., Suppl. 4, 136-149 (1957).
Demos SG( and Alfano RR, "Temporal gating in highly scattering media by the degree of optical polarization ", Opt. Lentt., 21, 161 - 163 ( 1996).
Demos S and Alfano RR, "Optical polarized imaging". App. Opt., 36. 150-155 (1997).
Deinum G, Rodriguez D, Romer T, Fitzmaurice M, Kramer JR, Feld MS. "Histological Classification of Raman Spectra of Human Coronary Atherosclerosis Using Principal Component Analysis". Applied
Spectroscopy, 58(8): 938-942 (1999).
Dixon J, Surgical Applications of Lasers, (Year Book Publisher. Chicago. 1987).
Chapter 1: Introduction
Farrell TJ, Patterson MS, Wilson B, "A diffusion theory model of spatially resolved, steady state diffuse reflectance for the noninvasive determination of tissue optical properties in vivo", Med. Phys., 19, 879-888 (1992).
Ferdman AG, Yannas IV, "Scattering of light from histologic sections - a new method for the analysis of connective tissue", J Invest. Dermr., 100, 710-716 (1993).
Freysz E, Pouligny B, Argoul F and Arneodo A, "Optical wavelet transtorm of fractal aggregates", Ph1vs. Rev. Lett. 64, 745 (1990).
Fujimoto JG, Boppart SA, Tearncy (iJ, Bouma BE, Pitris C, Brezinski ME, "High resolution in vivo intra-arterial imaging with optical coherence
tomography", Heart, 82, 28- 133 (1997).
(ianesan S. Sacks PG, Yang Y. Katz A, Al-Rawi M, Savage HE, Schantz SP, Alfano RR, "Native fluorescence spectroscopy of normal and malignant epithelial cells". (C'amcr Biochen Bioplw^s.. 16, 365-73 (1998).
(;corgakoudi I, Jacobson BC, Backman V, Wallace M, Muller M. Zhuang Q, Badizadegan K, Sun D., Thomas Ci, Van Dam V, Feld MS, "The Combination of Fluorescence, Diffuse Reflectance, and Light Scattering Spectroscopy for the Improved Detection of Low- and High-grade Dysplasia in Patients with Barrett's Esophagus ", Gastrointerologg'. in press (2001 ).
(ieorgakoudi I, Sheets EE, Miiller MG, Backman V, Crum CP. Badizadegan K. Dasari RR, Feld MS. "Tri-Modal Spectroscopy as a Tool for the Detection and Biochemical/Morphological Characterization of Cervical Pre-Cancers
In Vilo", Obstet. Gvnecol.. submitted (2001).
Giglio M, Carpineti M and Vailati A, "Space intensity correlations in the near field of the scattered light: a direct measurement of the density correlation function g(r)", Phvs. Rev. Lett., 85, 1416 (2000).
Gonzalez S, Rajadhyaksha M, Gonzalez-Serva A, White WM, Anderson RR, "Confocal reflectance imaging of folliculitis in vivo: correlation with
routine histology", .J Cutan. Pathol., 26, 201-5 1999).
Chapter 1: Introduction
Gurjar R, Backman V, Badizadegan K, Dasari R, Itzkan I, Perelman LT, Feld MS, "Functional Imaging of Human Epithelia with Polarized Light Scattering Spectroscopy", Nature Medlicine, to be published (2001).
licee MR, Izatt JA, Swanson EA, Huang D, Schuman JS, Lin CP, Puliafito CA, Fujimoto JG, "Optical coherence tomography of the human retina", Arch
Ophthalnmol, 113, 325-32 (1995).
Hielscher AH, Mourant JR, Bigio IJ, "Influence of particle size and concentration on the diffuse backscattering of polarized light from tissue phantoms and biological cell suspensions", Appi. Opt., 36. 125-135 (1997).
Hielscher AH, Mourant JR, Bigio IJ, "Influence of particle size and concentration on the diffuse backscattering of polarized light from tissue phantoms and
biological cell suspensions",/ /)pi. Opt., 36, 125-135 (1997).
Jacques, SL, Roman JR, Lee K, "Imaging Superficial Tissues with Polarized Light", ltl.as. Sli,. Ctedl., 26, 119- 1 29 (2000).
Jain RK, "Determinants of tumor blood flow a review", 48, 2641-2658 (1988).
Ishimaru
A, fWavCe
propagation and scalltering in random nedlia(McGill, New
York, 1978).Itzkan I, Albagli D, Dark ML, Perelman LT, von Rosenberg C, Feld MS, PN.4S.
92, 1960 (1995).
Kapadia CR, Cutruzzola FW, O'Brien KM, Stetz ML, Enriquez R, Deckelbaum LI, "Laser-induced fluorescence spectroscopy of human colonic mucosa.
Detection of adenomatous transformation", Gastiroenterolog. 99, 150-7
(1990).
Kneen MM, Harkin DG, Walker LL, Alcoin D, Harris PJ, "Imaging of renal medullary interstitial cells in situ by confocal fluorescence microscopy",
Anat Embryol, 200, 117-21 (1999).
Kobayashi K, Izatt JA, Kulkarni MD, Willis J. Sivak MV Jr, "High-resolution cross-sectional imaging of the gastrointestinal tract using optical coherence
tomography: preliminary results", Gastrointest Endosc, 47, 515-23 (1998).
Chapter 1: Introduction
Koenig F, Lame R, Enquist H, McGovern FJ, Schomacker KT, Kollias N, Deutsch TF, "Spectroscopic measurement of diffuse reflectance for enhanced
detection of bladder carcinoma", Urolog,, 51, 342-345 ( 1998).
Konig K, So PT, Mantulin WW, Tromberg BJ, Gratton E, "Two-photon excited lifetime imaging of autofluorescence in cells during UVA and NIR
photostress",. ,/icrosc, 183, 197-204 (1996).
Kulcsa PM. Fraser SE. "Confocal imaging of living cells in intact embryos",
AMethodt. MIol Biol, 122, 205-222 (1999).
Kuric JM, Lee JS, Morice RKC, Walsh GL, Khuri FR, Broxson A, Ro JY, Franklin WA, Yu R, Hong WK, "Autofluorescence bronchoscopy in the detection of squamous metaplasia and dysplasia in current and former smokers", J
Natl ('Carcer Inst. 1, 991-5 (1998).
Lee L., Pappelis AJ. Pappelis
(iA, Kaplan HM. "Cellular and nuclear dry mass and
area changes during human oral mucosa cell development". Acta C'tol. 17, 214-219 (1973).L[iu Il., Boas DA, Zhang YT, Yodh AG, Chance B, "Determination of optica! properties and blood oxygenation in continuous NIR light", Phs. lMel. Bio., 40, 1983-1993 ( 995).
Landis SH, Murray T, Bolden S, Wingo PA, "Cancer Statistics 1999". CA - A Cancer Journal for Clinicians, 49, 8-31 (1999).
Liu HL. Boas DA, Zhang YT, Yodh AG, Chance B "Detemlination of optical properties and blood oxygenation in continuous NIR light", Phys. Med.
Bio.. 40, 1983-1993 (1995).
Lovat LB, Pickard D, Novelli M, Ripley PM, Francis H. Bigio IJ, Bown SG, "A novel optical biopsy technique using elastic scattering spectroscopy for dysplasia and cancer in Barrett's esophagus", Gastroint. Endoscop ., 51,
4919 (2000).
Manoharan R. Shafer K, Perelman L, Wu J, Chen K, Deinum G, Fitzmaurice M, Myles J, Crowe J. Dasari RR, Feld MS, "Raman Spectroscopy and Fluorescence Photon Migration for Breast Cancer Diagnosis and Imaging", Photochemistry and Photobiology, 67, 15-22 (1998).
Chapter : Introduction
Mourant JR, Bigio IJ, Boyer J, Conn RL, Johnson T, Shimada T, "Spectroscopic diagnosis of bladder cancer with elastic light scattering spectroscopy",
Lasers S-urg. Med., 17, 350-357 (1995).
Mahadevan-Jansen A, Mitchell MF, Ramanujam N, Utzinger U, Richards-Kortum R, "Mevelopment of a fiber optic probe to measure NIR Raman spectra of cervical tissue in vivo", Photochen Photohiol, 68, 427-31 (1998).
Mitchell MF, Cantor SB, Ramanujam N, Tortolcro-Luna G, Richards-Kortum R, "Fluorescence spectroscopy for diagnosis of squamous ntra-epithelial
lesions of the cervix", Obstet Gvnecol, 93, 462-70 (1999).
Mourant J, Freyer A, Heilscher A, Eick D, Shen and Johnson T, "Mechanisms of light scattering from biological cells relevant to noninvasive optical-tissue
diagnostics",1
App!.
Opt.,37, 3586-3593 (1998).
Newton R(;. Scatterirng Theor of WaveIfe andl Particles (McGraw-Hill Book'
('ompany, New York, 1969).
Parrish JA and Wilson BC, Photochem. Photobio., 53, 731 ( 991 ).
Patterson MS, Wilson BC, Feather JW, Bums DM, Pushka W, "The measurement of dihematoporhyrin ether concentration in tissue by reflectance
spectrophotometry", Photochein. Photohiol. 46(3) 337-343 (1987).
Perelman LT, Wu J, Itzkan I, Fceld MS, "Photon migration in turbid media using path-integrals", Phvs. Rev. Lett., 72, 1341-1344 (1994).
Perelman LT, Backman V, Wallace MB, Zonios G, Manoharan R, Nusrat A, Shields S, Seiler M, Lima C, Hamano T, Itzkan I, Van Dam J, Crawford JM and Feld MS, "Observation of periodic fine structure in reflectance from biological tissue: a new technique for measuring nuclear size
distribution", Phys. Rev. Lett., 80, 627-630 (1998).
Petroll WM, Cavanagh HD, Jester JV, "Clinical confocal microscopy", C-r.
Opin. Ophthalmol., 9, 59-65 (1998).
Pine DJ, Weitz DA, Chaikin PM and Herbolzheimer E, "Diffusing-wave spectroscopy", Phys. Rev. Lett., 60, 1134 (1988).
Chapter 1: Introduction
Pitris C, Goodman A, Boppart SA. Libus JJ, Fujimoto JG, Brezinski ME, "High-resolution imaging of gynecologic neoplasms using optical coherence tomography", Obstet. Gynecol., 93, 135-139 (1999).
Rajadhyaksha M, Anderson RR, and Webb RH, "Video-rate confocal scanning laser microscope for imaging human tissues in vivo", A,ppl. Opt., 38
(1999).
Rava RP, Baraga JJ, Feld MS, "Near-infrared Fourier-transform Raman
spectroscopy of human artery", Spectrochemica Acta A 47(3-4), 509-512
(1991).Reid BJ, Haggitt RC, Rubin CE, et al., "Observer Variation in the Diagnosis of Dysplasia in Barrett's Esophagus", Hum. Pathol., 19, 166-178 (1988).
Richards-Kortum RR, Rava R. Fitzmaurice M, Tong L, Ratliff NB, Kramer JR,
Feld MS, "A one-layer model of laser-induced ftluorescence for diagnosis of disease in hunlan-tissue - applications to atherosclerosis" IEEE Trans.
Bioned(l. Eng. 36, 1222-1232 (1989).
Richards-Kortum R, Rava RP, Fitzmaurice M, Kramer JR, Feld MS, "476 nm excited laser-induced fluorescence spectroscopy of human coronary arteries: applications in cardiology", Amn Heart .J 122, 1141-50 (1991).
Riddell R, Goldman H, Ransohoff D, Appelman HD, Fenoglio CM, Haggitt RC, Ahren C, Correa P, Hamilton SR, Morson BC, Sommers SC, Yardley JH, "Dysplasia in Inflammatory Bowel-Disease, Standardized classification with provisional clinical applications", Human Patholog, 14, 931-968
(1983).
Russ JC, The Image Processing Hancdbook (CRC Press, Boca Raton, Ann Arbor, London, Tokyo, 1992).
Schantz SP, Kolli V, Savage HE, Yu G, Shah JP, Harris DE, Katz A, Alfano RR, Huvos AG, "In vivo native cellular fluorescence and histological
characteristics of head and neck cancer", Clin Cancer Res, 4, 1 177-82 (1998).