transcriptomics of differentiating embryonic stem cells
The MIT Faculty has made this article openly available.
Please share
how this access benefits you. Your story matters.
Citation
Semrau, Stefan et al. “Dynamics of Lineage Commitment Revealed
by Single-Cell Transcriptomics of Differentiating Embryonic Stem
Cells.” Nature Communications 8, 1 (October 2017): 1096 © 2017
The Author(s)
As Published
http://dx.doi.org/10.1038/S41467-017-01076-4
Publisher
Nature Publishing Group
Version
Final published version
Citable link
http://hdl.handle.net/1721.1/114774
Terms of Use
Creative Commons Attribution 4.0 International License
Dynamics of lineage commitment revealed by
single-cell transcriptomics of differentiating
embryonic stem cells
Stefan Semrau
1,2,3
, Johanna E. Goldmann
2
, Magali Soumillon
4,5
, Tarjei S. Mikkelsen
4,5
, Rudolf Jaenisch
2,6
& Alexander van Oudenaarden
1
Gene expression heterogeneity in the pluripotent state of mouse embryonic stem cells
(mESCs) has been increasingly well-characterized. In contrast, exit from pluripotency and
lineage commitment have not been studied systematically at the single-cell level. Here we
measure the gene expression dynamics of retinoic acid driven mESC differentiation from
pluripotency to lineage commitment, using an unbiased single-cell transcriptomics approach.
We
find that the exit from pluripotency marks the start of a lineage transition as well as a
transient phase of increased susceptibility to lineage specifying signals. Our study reveals
several transcriptional signatures of this phase, including a sharp increase of gene expression
variability and sequential expression of two classes of transcriptional regulators. In summary,
we provide a comprehensive analysis of the exit from pluripotency and lineage commitment
at the single cell level, a potential stepping stone to improved lineage manipulation through
timing of differentiation cues.
DOI: 10.1038/s41467-017-01076-4
OPEN
1Hubrecht Institute–KNAW (Royal Netherlands Academy of Arts and Sciences) and University Medical Center Utrecht, Uppsalalaan 8, 3584 CT Utrecht,
The Netherlands.2Whitehead Institute for Biomedical Research, 9 Cambridge Center, Cambridge, MA 02142, USA.3Leiden Institute of Physics, Einsteinweg 55, 2333 CC Leiden, The Netherlands.4Broad Institute, 415 Main St, Cambridge, MA 02142, USA.5Harvard Stem Cell Institute and Department of Stem
Cell and Regenerative Biology, Harvard University, 7 Divinity Ave, Cambridge, MA 02138, USA.6Department of Biology, Massachusetts Institute of
Technology, 31 Ames St, Cambridge, MA 02142, USA. Stefan Semrau, Johanna Goldmann contributed equally to this work. Rudolf Jaenisch, Alexander van Oudenaarden jointly supervised this work. Correspondence and requests for materials should be addressed to S.S. (email:[email protected])
123456789
I
n vitro differentiation is a key technology to enable the use of
embryonic and induced pluripotent stem cells as disease
models and for therapeutic applications
1,2. Existing directed
differentiation protocols, which have been gleaned from in vivo
development, are laborious and produce heterogeneous cell
populations
3. Protocol optimization typically requires costly and
time-consuming trial-and-error experiments. To be able to design
more efficient and specific differentiation regimens in a
sys-tematic way it will be necessary to gain a better understanding of
the decision-making process that underlies the generation of cell
type diversity
4.
Lineage decision-making is fundamentally a single-cell
pro-cess
5and the response to lineage specifying signals depends on
the state of the individual cell. A substantial body of work has
revealed lineage biases related to, for example, cell cycle phase or
pre-existing subpopulations in the pluripotent state
4, 6–8. The
commitment of pluripotent cells to a particular lineage, on the
other hand, has not yet been studied systematically at the
single-cell level. We consider a single-cell to be committed, if its state cannot be
reverted by removal of the lineage specifying signal.
Here we set out to characterize the single-cell gene expression
dynamics of differentiation, from exit from pluripotency to
lineage commitment. Using single-cell transcriptomics we
find
that retinoic acid drives the differentiation of mouse embryonic
stem cells to neuroectoderm—and extraembryonic endoderm—
like cells. Between 24 h and 48 h of retinoic acid exposure, cells
exit from pluripotency and their gene expression profiles
gradu-ally diverge. By pseudotime ordering we reveal a transient
post-implantation epiblast-like state. We also study the influence of the
external signaling environment and identify a phase of high
susceptibility to MAPK/Erk signaling around the exit from
pluripotency. We employ a minimal gene regulatory network
model to recapitulate the dynamics of the lineage response to
signaling inputs. Finally, we identify two classes of transcription
factors which have likely distinct roles in the lineage
decision-making process.
Results
Retinoic acid driven lineage transition. Mouse embryonic stem
cells (mESCs) are a well-characterized model system to study
in vitro differentiation. Here, we focused on mESC differentiation
driven by all-trans retinoic acid (RA), which is widely used in
in vitro differentiation assays
9and has important functions in
embryonic development
10. E14 mESCs were grown feeder free in
2i medium
11plus LIF (2i/L) for several passages to minimize
heterogeneity before differentiation in the basal medium (N2B27
medium) and RA (Fig.
1
a). Within 96 h the cells underwent a
profound change in morphology from tight, round, homogeneous
colonies to strongly adherent, morphologically heterogeneous
cells (Fig.
1
a). To characterize the differentiation process at the
population level we
first measured gene expression by bulk
RNA-seq at 10 time points during 96 h of continuous RA exposure
(Supplementary Fig.
1
). Genes that are absent in the pluripotent
state but upregulated during differentiation can reveal the identity
of differentiated cell types. To
find such genes we clustered all
genes by their temporal gene expression profiles using k-means
clustering (Methods, Supplementary Fig.
1
a). By testing for
reproducibility through repeated clustering (stability analysis
12,
see Methods) we determined that there were 6 robust gene
clusters. The two clusters that showed a continuous increase in
expression over the time course (clusters 5 and 6 in
Supple-mentary Fig.
1
a), were enriched with genes that have functions in
development and differentiation (Supplementary Fig.
1
b). In
particular,
established
neuroectoderm
and
extraembryonic
endoderm
(XEN)
markers
belonged
to
these
clusters.
Mesodermal markers, on the other hand, were not up-regulated.
(Supplementary Fig.
1
c, d). This observation is in agreement with
earlier reports showing that RA induces neuroectodermal and
XEN
lineages
while
suppressing
mesodermal
gene
expression
10,13,14.
We next set out to identify the
final cell types present after 96 h
of RA exposure. The up-regulation of both ectodermal and XEN
markers seemed to indicate that cells adopted these two fates.
Since population level measurements are not able to resolve
population heterogeneity, we turned to the recently developed
a
20 µm 20 µm 0 h x h 96 h (Sample) RA 2ib
t-SNE space Ectoderm-like XEN-like t[h] 0 1 Rex1 rel. expressionc
PC 1 PC 2 Ectoderm-like (96 h) XEN-like (96 h) mESCs (0 h) –10 –5 0 5 10 15 0 10 20 30 40 50 0 12 24 36 48 60 72 96 –60 –40 –20 0 20 40 60 6 Exit from pluripotencyd
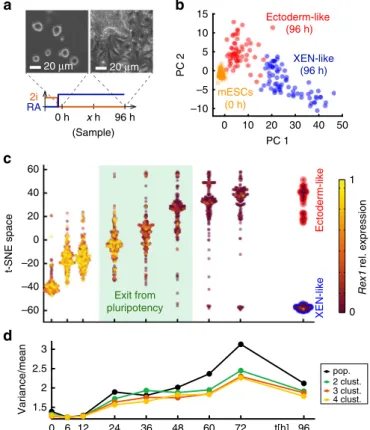
1.5 2 2.5 3 pop. 2 clust. 3 clust. 4 clust. Variance/meanFig. 1 Single-cell RNA-seq revealed an RA driven lineage transition of mESCs towards ectoderm- and XEN-like cells.a Scheme of the
differentiation protocol with phase contrast images of cells growing in 2i/L (0 h) and after 96 h of exposure to 0.25µM RA in N2B27 medium. b Principal component analysis of single-cell expression profiles of mESCs and cells after 96 h of RA exposure. Principal components were calculated across all cells and time points. Cells were placed in the space of thefirst two principal components (PC 1 and PC 2). Each data point corresponds to a single cell. Two robust clusters identified by k-means clustering and stability analysis are shown in red (ectoderm) and blue (XEN), respectively. mESCs are shown in orange.c t-SNE mapping of single-cell expression profiles. The single-cell RNA-seq data (SCRB-seq) for all cells and time points were mapped on a one-dimensional t-SNE space, which preserved local similarity between expression profiles, while reducing dimensionality. Each data point corresponds to a single cell. Data points for individual time points are shown in violin plots to reflect relative frequency along the t-SNE axis. The color of each data point indicatesRex1 expression (relative to maximum expression across all cells). For the 96 h time point, two robust clusters (found by k-means clustering and stability analysis) are indicated with red or blue edges, respectively.d Single-cell gene expression variability quantified as the variance over the mean (Fano factor). The Fano factor was calculated either for the whole population or subpopulations of cells defined by k-means clustering using 2,3 or 4 clusters. Clustering was carried out repeatedly and the Fano factors obtained for separate clusterings were averaged
Single Cell RNA Barcoding and Sequencing method
15(SCRB-seq,
Supplementary Fig.
2
). We quantified the transcriptional profiles
of over 2000 single cells, sampled at 9 time points during
differentiation, typically spaced 12 h apart. To visualize the
heterogeneity of gene expression profiles and find subpopulations
that emerge during differentiation, we used principal component
analysis (PCA) and k-means clustering of the cells (Fig.
1
b,
Supplementary Fig.
3
a, b). Repeated k-means clustering of the
cells (stability analysis
12, see Methods) indicated that the
population was homogeneous at 0 h and two robust clusters
were present at the end of the differentiation time course (96 h).
To reveal the identity of the two observed clusters, we turned to
the composition of the
first two principal components. The first
principal component (PC 1) was primarily composed of
established markers for the XEN lineage (Sparc, Col4a1, Lama1,
Dab2), while PC 2 comprised markers of neuro-ectodermal
development (Prtg, Mdk, Fabp5, Cd24) (Supplementary Fig.
3
a, b).
Accordingly, we identified one cluster as XEN-like and the other
one as as ectoderm-like (Fig.
1
b). Hierarchical clustering
supported our interpretation of the PCA results (Supplementary
Fig.
3
c). In particular, we observed that genes from gene cluster 5
(Supplementary Fig.
1
a), which includes ectoderm markers, were
more broadly expressed in the ectoderm-like cells. By contrast,
genes from cluster 6, which includes XEN markers, were largely
restricted to XEN-like cells.
To confirm the existence of two cell types by an independent
method, we next sought to
find surface markers that would allow
us to identify and purify the cell types. Cd24, which is among the
genes with the highest loadings in PC2, is an established marker
for neuroectodermal lineages
16. Pdgfra is the earliest known
marker of the primitive endoderm lineage in vivo
17. Antibody
staining of these two markers showed two well-separated
subpopulations at 96 h (Supplementary Fig.
4
a): an
ectoderm-like subpopulation (CD24 + /PDGFRA-) and a XEN-ectoderm-like
sub-population (CD24−/PDGFRA + ). The frequencies of these two
subpopulations were robust across multiple biological replicates
(Supplementary Fig.
4
b) and in accordance with the single-cell
RNA-seq results. We then purified ectoderm-like and XEN-like
cells after 96 h of RA exposure and cultured them in the same
medium (N2B27 supplemented with EGF and FGF2). After
continued culture, the two subpopulations showed markedly
different morphologies (Supplementary Fig.
4
c) and distinct gene
expression patterns, as measured by bulk RNA-seq
(Supplemen-tary Fig.
4
d, f). Ectoderm-like cells expressed neuro-ectodermal
and neural crest markers and were similar in their expression
profile to neural progenitor cells and neural crest cells in vivo.
XEN-like cells expressed primitive endoderm markers and
resembled an embryo-derived XEN cell line and yolk sac tissue.
Taken together, these results provide evidence that the observed
cell clusters corresponded to stable neuroectoderm-like and
XEN-like cell types with XEN-likely in vivo correlates.
Exit from pluripotency between 24 h and 48 h of RA exposure.
Having established the identity of the differentiated cell types we
next sought to study the exit from pluripotency in detail. At the
population level, we detected a gene expression response to
dif-ferentiation conditions within only 6 h, as well as a second wave
of gene expression changes between 24 h and 36 h
(Supplemen-tary Fig.
1
e). While the immediate response was a direct effect of
the switch to RA containing media, as evident from the
upre-gulation of direct RA targets, we hypothesized that the second
wave of changes indicated the exit from pluripotency. In support
of this hypothesis we found that pluripotency markers were
strongly down-regulated between 24 h and 48 h (Supplementary
Fig.
1
c, d). Cell morphology and cell cycle phase lengths
(Supplementary Fig.
5
a–c) also changed significantly during the
same time interval, in agreement with the observed expression
dynamics. As a functional assay we used replating of the cells at
clonal density in 2i/L medium. 90% of the cells could not grow in
this selective medium anymore by 36 h of RA exposure
(Sup-plementary Fig.
5
d). Taken together, our population level gene
expression measurements and functional assays suggested that
cells exited pluripotency between 24 h and 48 h of RA exposure.
Gradual divergence of gene expression profiles. To visualize
gene expression dynamics around the exit from pluripotency at
the single–cell level we used t-distributed stochastic neighbor
embedding
18(t-SNE) of our SCRB-seq data set. t-SNE maps gene
expression profiles to a low-dimensional space and places similar
expression profiles in proximity to each other. Here we used
t-SNE to map the expression profiles of individual cells throughout
the time course on a single axis (Fig.
1
c). We assessed the
plur-ipotency status of individual cells by the expression level of the
established pluripotency marker Rex1
19. t-SNE showed that gene
expression changed homogeneously throughout the population
for the
first 12 h of RA exposure, which was likely a direct effect
of the RA containing medium. At this stage Rex1 expression was
high throughout the population. The subsequent steep increase in
single-cell variability of gene expression at 24 h (Fig.
1
d) indicated
that gene expression profiles started to become more
hetero-geneous during the exit from pluripotency. Simultaneously, Rex1
expression started to decline in a subset of cells, confirming the
exit from pluripotency at the single-cell level. To pinpoint the
time when distinguishable cell types
first appeared during the
differentiation time course, we calculated gene expression
varia-bility for individual cell clusters formed by k-means clustering
(Fig.
1
d), instead of the whole population. Starting at 48 h,
within-cluster variability using 2 clusters was reduced compared
to population variability, signifying the emergence of the two cell
types. Clustering into 3 or 4 clusters did not reduce the variability
much further. Taken together, t-SNE mapping and variability
analysis showed that cells exited pluripotency and started to
diverge in gene expression between 24 h and 48 h of RA exposure.
To further quantify the divergence of gene expression profiles
we classified cells based on their similarity (Pearson correlation)
with the average profiles of either mESCs at 0 h or the two
differentiated cell types at 96 h (Fig.
2
a–c). Cells which were more
similar to a differentiated cell type than to mESCs
first appeared
between 24 h and 48 h of RA exposure, which matched the
dynamics visible in the t-SNE map (Fig.
1
c). Importantly, average
expression profiles of the three classes were similar around the
exit from pluripotency and only diverged more quickly afterwards
(Fig.
2
d). These observations suggested that the cells adopted the
final cell fates only gradually, potentially via distinct transitory
states.
Initial differentiation into post-implantation epiblast. We next
wanted to zoom in further on the initial lineage decision, right
after the exit from pluripotency, to reveal potential intermediate
cell states. To achieve this goal, we had to remove possible
obfuscating effects related to the asynchrony of differentiation.
The transient coexistence of all three classes of cells (Fig.
2
c) and
the heterogeneous expression of Rex1 (Fig.
1
c) around the exit
from pluripotency had indicated that differentiation was indeed
asynchronous. Confounding effects due to asynchronous
differ-entiation can be mitigated with the help of pseudo-temporal
ordering of cells
20. Here we defined a pseudo-time based on the
Pearson correlation with mESCs or the differentiated cell types at
96 h (Fig.
3
a, b). This pseudo-time thus reflects the progress of
XEN-like lineage. Pseudo-temporal ordering reduced the co-existence
of cell types to a small period in pseudo-time (Fig.
3
c) and was
thereby able to clarify expression dynamics. Furthermore, it
revealed that pluripotency factors were down-regulated already
before the branch point, where differentiated cell types could
first
be distinguished (Fig.
3
d, e). During the same time, markers of
post-implantation epiblast
21(e.g. Pou3f1, Fgf5) were
up-regulated. This intermediate period might represent a phase of
homogeneous lineage priming or subtle population heterogeneity
that we cannot resolve given the technical noise of our single-cell
RNA-seq method. After the branch point, several
neuroecto-dermal markers (like Pax6, Sox11 or Nes) were up-regulated in
the ectoderm-like branch. Established XEN markers (e.g. Gata6,
Dab2), on the other hand, were restricted to the XEN-like branch,
as to be expected.
Gene expression dynamics in pseudo-time seemed to suggest a
transient state in which the cells resembled the post-implantation
epiblast. To further clarify the relationship of RA differentiation
with in vivo development we used PCA to compare our data set
to RNA-seq measurements of pre- and peri-implantation
tissues
21(Fig.
4
a and Supplementary Fig.
6
). This analysis
revealed that mESCs were most similar to pre-implantation
epiblast (E4.5), as has been shown previously
22. During
differentiation the cells
first moved closer to the E5.5 epiblast
around 48 h before separating into two subpopulations (Fig.
4
a).
At 96 h, the XEN-like subpopulation was closest to E4.5 primitive
endoderm. The occurrence of these XEN-like cells is thus likely
due to a trans-differentiation from E4.5 or even E5.5 epiblast–like
cells. The initial lineage decision in our system is therefore
between continued differentiation along the epiblast lineage and
trans-differentiation to a primitive endoderm-like state.
To confirm the single-cell RNA-seq results with an
indepen-dent method we sorted cells based on PDGFRA and CD24
expression at 48 h, 72 h and 96 h and profiled the expression of
the sorted subpopulations by bulk RNA-seq (Fig.
4
b). At 48 h
only few cells expressed PDGFRA but the majority expressed
CD24. Most importantly, in PDGFRA negative cells the
expression of post-implantation epiblast markers increased with
CD24 expression. By 96 h the expression of post-implantation
epiblast markers had largely disappeared. XEN markers, on the
other hand, were expressed exclusively in PDGFRA positive cells
at 72 h and 96 h. To determine cell identities in the bulk
expression data set in an unbiased way we used the KeyGenes
algorithm
23together with pre- and peri-implantation tissues
21as
training set (Fig.
4
c). KeyGenes identified mESCs as E4.5 epiblast,
in agreement with our PCA (Fig.
4
a) and previous results
22.
Notably, at 48 h PDGFRA negative/CD24 low cells were classified
as E4.5 epiblast, while PDGFRA negative/CD24 high cells were
identified as E5.5 epiblast. CD24 thus indicated the adoption of a
post-implantation epiblast-like state, in agreement with previous
findings
24. PDGFRA positive cells, on the other hand, were
consistently identified as E4.5 primitive endoderm. Bulk RNA-seq
of sorted subpopulations and KeyGenes analysis thus confirmed
that cells either continued to differentiate along the epiblast
lineage or adopted a XEN-like cell type.
Regulation by the external signaling environment. Having
characterized the gene expression dynamics of the exit from
pluripotency and the subsequent lineage transition, we next
wanted to identify effectors of the lineage decision. Notably,
mESCs lost their ability to differentiate into a XEN-like lineage
a
b
0 h 6 h 12 h 24 h 36 h 48 h 60 h 72 h 96 h PC 1 PC 2 PC 1 PC 2c
Ectoderm-like XEN-like Ectoderm-like XEN-like Ectoderm-like XEN-like mESC-like mESC -like 24 h 36 h 48 h PC 1 PC 2 48 h 48 h 60 h 60 h 72 h 72 h 96 h 96 h 0 h 0 12 24 36 48 60 72 96 t[h] 0 0.2 0.4 0.6 0.8 1 Rel. frequency mESCsd
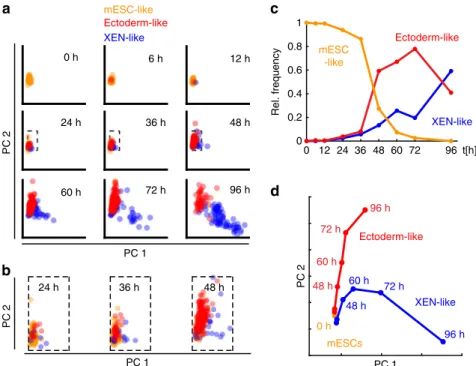
Fig. 2 mESCs showed gradual adoption and divergence of lineage specific expression profiles. a Principal component analysis of single-cell expression profiles. Principal components were calculated across all cells and time points. Cells measured at the indicated periods of RA exposure were placed in the space of thefirst two principal components. Each data point corresponds to a single cell. Cells were classified as mESC-like (orange), ectoderm-like (red) and XEN-like (blue). Classification was based on Pearson correlation between expression profiles of individual cells and mean expression profiles of mESCs at 0 h or ectoderm-like and XEN-like cells after 96 h of RA exposure. An individual cell is identified with the cell type with which it is most strongly correlated.b Same data as in a for three select time points (24 h, 36 h and 48 h), zoomed in on the areas indicated by dashed rectangles in a. c Relative frequencies of cells classified as mESC-like, ectoderm- or XEN-like in the same way as in a. d Average movement of ectoderm- and XEN-like cells in the principal component space during RA differentiation. The positions of cells of the same type were averaged at the indicated time points
a
d
mESC-like ECT-like XEN-like
Pseudotime 0 20 40 –10 –5 0 5 10 15 –0.96 0.85 0 20 40 –10 –5 0 5 10 15 0 20 40 –10 –5 0 5 10 15 –0.2 0 0.2 0 0.5 1 Pluripotency Post-implant. epiblast Neur oectoderm Extraemb. endod. PC 1 PC 1 PC 1 PC 2 PC 2 PC 2 Pseudo time R e l. fr equency Expression (z-score) 1.5 –1.5 Pseudotime mESC-like ECT-like XEN-like
ECT-like branch XEN-like branch
b
c
mESC-like ECT-like XEN-likee
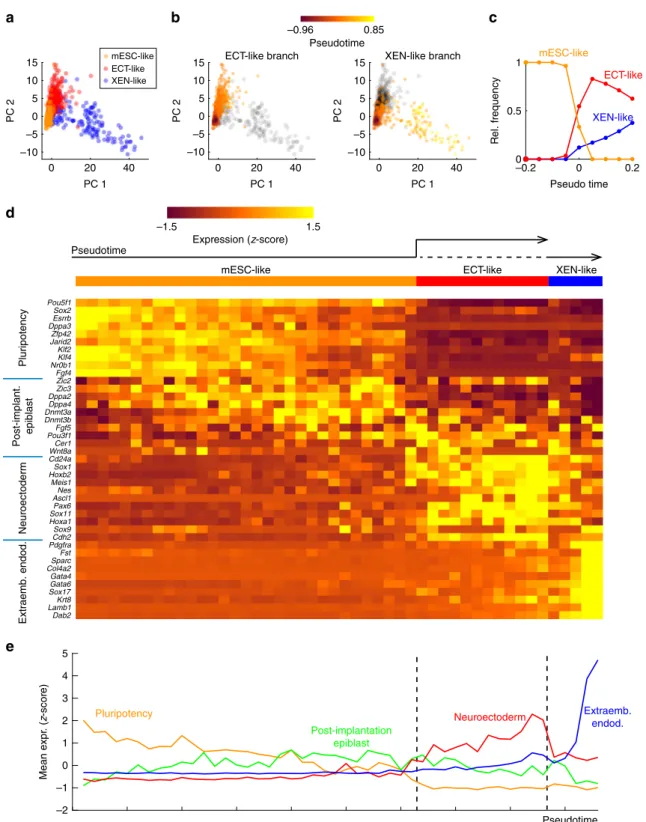
Pou5f1 Sox2 Esrrb Dppa3 Zfp42 Jarid2 Klf2 Klf4 Nr0b1 Fgf4 Zic2 Zic3 Dppa2 Dppa4 Dnmt3a Dnmt3b Fgf5 Pou3f1 Cer1 Wnt8a Cd24a Sox1 Hoxb2 Meis1 Nes Ascl1 Pax6 Sox11 Hoxa1 Sox9 Cdh2 Pdgfra Fst Sparc Col4a2 Gata4 Gata6 Sox17 Krt8 Lamb1 Dab2 –2 –1 0 1 2 3 4 5 Mean expr . ( z -scor e ) Pluripotency Post-implantation epiblast Neuroectoderm Extraemb. endod. PseudotimeFig. 3 Pseudo-temporal ordering of SCRB-seq data revealed gene expression dynamics around the exit from pluripotency. a Classification of all cells measured during the differentiation time course. Cells were classified according to the correlation of their expression profiles with the average expression of mESCs at 0 h or ectoderm- or XEN-like cells at 96 h. Cells were placed in the space of thefirst two principal components (PC1 and PC2). b Pseudo-time of cells in the ectoderm-like branch (mESC-like cells and ectoderm-like cells, left) or the XEN-like branch (mESC-like cells and XEN-like cells, right). Pseudo-timeτ, which is indicated by color, is defined as τ = Rpluri−0.5*(Rect+ Rxen) where Rpluri, Rectand Rxenare the Pearson correlations of an individual
expression profile with the average expression of mESCs, ectoderm-like cells at 96 h and XEN-like cells at 96 h, respectively. c Relative frequencies of the three classes of cells with respect to pseudo-time.d Expression of a panel of marker genes for pluripotency, post-implantation epiblast70, neuroectoderm
and primitive endoderm with respect to pseudo-time. Cells were ordered by increasing pseudo-time and expression was averaged over 50 consecutive cells. Expression is presented as gene-wise z-score to accentuate temporal differences.e Average expression of the 4 sets of marker genes shown in d: pluripotency factors, post-implantation epiblast markers, neuroectoderm markers and extraembryonic endoderm markers
when they were cultured, prior to differentiation, in serum and
LIF conditions (without feeders) instead of 2i/L (Supplementary
Fig.
7
a, b). The ability of RA to drive ectodermal differentiation
seemed unaffected under these conditions, as reported before
25.
Since culture conditions had such a strong impact on the
devel-opmental potential of mESCs we wanted to explore the
con-tribution of specific signaling pathways on the cellular decision.
We differentiated mESCs with RA in the presence of a MEK
inhibitor (MEKi, PD0325901), which abrogates MAPK/Erk
naling; a GSK3 inhibitor, which effectively stimulates Wnt
sig-naling (GSK3i, CHIR99021), LIF, which activates the JAK/Stat
pathway or an FGF receptor inhibitor (FGFRi, PD173074).
(Supplementary Fig.
7
c–h). The first 2 of these molecules are
components of the defined 2i medium and are known to prevent
differentiation while stabilizing the pluripotent state. The
pre-sence of GSK3i or LIF led to an overall reduction of differentiated
cells (Supplementary Fig.
7
c), consistent with their role in
stabi-lizing pluripotency. Addition of MEKi alone, however, led to a
specific reduction of the XEN-like subpopulation (Supplementary
Fig.
7
c–e), in agreement with previous results
26,27. This effect was
unlikely due to interference with RA signaling since increasing
RA concentration did not reverse the effect (Supplementary
Fig.
7
f). In contrast to the MEK inhibitor, the FGF receptor
inhibitor not only suppressed the XEN-like population but also
greatly reduced the ectoderm-like population (Supplementary
Fig.
7
g, h). This observation is in agreement with earlier studies
that reported a requirement for FGF signaling in mESC
differ-entiation
28and lineage segregation in the early mouse
blas-tocyst
29. Taken together these experiments clearly demonstrate
that RA driven XEN-specification requires the same signaling
pathways as other differentiation regimens and XEN-specification
in vivo, despite the pleiotropic nature of RA.
Phase of high susceptibility to external signal inputs. We next
wanted to establish when mESCs are sensitive to RA signaling
and how long the signal would have to be applied to drive a
complete lineage transition. Having observed that gene
expres-sion responds to differentiation conditions within 6 h
(Supple-mentary Fig.
1
e), we hypothesized that a short pulse of RA might
be sufficient to induce XEN specification. To test this hypothesis
a
b
E2.5, MOR E3.5, ICM E4.5, EPI E5.5, EPI E4.5, PrE id score 0 0.6 mESC CD24 1st Q. CD24 2nd Q. CD24 3rd Q. CD24 4th Q. CD24-CD24 low CD24 high CD24-, rep 1 CD24-, rep 2 CD24+, rep 1 CD24+, rep 2 48 h 72 h 96 h
Cd24a Zfp42 Pou5f1 Fgf4 Nr0b1 Pou3f1 Fgf5 Cer1 Cd40 Gata6 Gata4 Dab2 Sox17 Expr. (z-score) –1 3 Pluripot. Post-imp. epiblast Pr. endod. Pdgfra
c
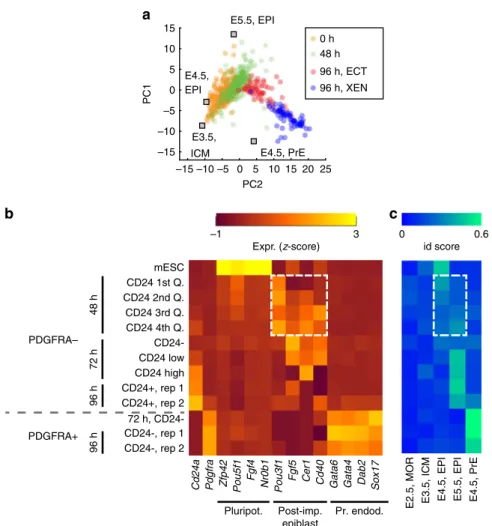
PDGFRA– PDGFRA+ 72 h, CD24-96 h –10 –5 10 15 20 25 –10 –5 0 5 10 15 E3.5, ICM E4.5, EPI E4.5, PrE E5.5, EPI 0 5 PC2 PC1 –15 –15 0 h 48 h 96 h, ECT 96 h, XENFig. 4 Differentiation with RA differed from the pathway observed in in vivo development. a Principal component analysis of a panel of pre- / peri-implantation tissues21. The SCRB-seq gene expression profiles obtained during RA differentiation were placed in the space of the first two principal
components. Each data point represents an individual cell. Data points are colored according to duration of RA exposure and cell type (at 96 h). ICM: inner cell mass, EPI: epiblast, PrE: primitive endoderm.b Expression of pluripotency, post-implantation epiblast and primitive endoderm marker genes in subpopulations defined by CD24 and PDGFRA expression. Cells were sorted on PDGFRA and CD24 antibody staining by FACS before RNA extraction at the indicated periods of RA exposure (48 h, 72 h and 96 h) and bulk RNA-seq. At 48 h, PDGFRA- cells were sorted by quartiles of CD24 expression, at 72 h cells were sorted by PDGFRA expression and terciles of CD24 expression. Expression of post-implantation epiblast markers at 48 h is highlighted with a dashed white box.c Identity of bulk RNA-seq samples as determined by the KeyGenes algorithm23. A panel of pre- / peri-implantation tissues21was used
as the training set. A high identity (id) score corresponds to a high confidence about tissue identity. (MOR: morula, ICM: inner cell mass, EPI: epiblast, PrE: primitive endoderm). The identity scores for the epiblast tissues at 48 h are highlighted by a white dashed box
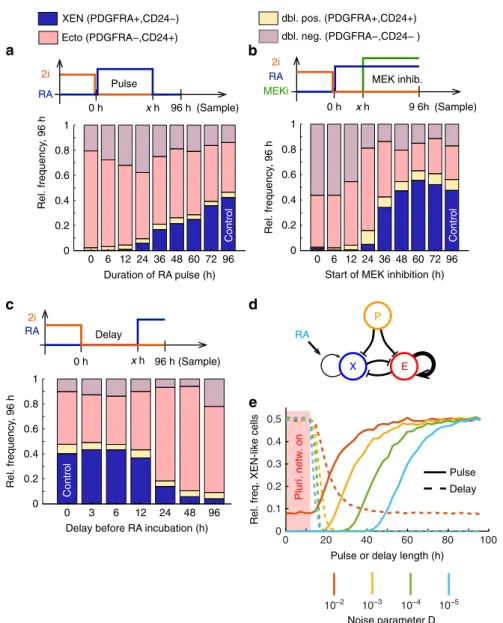
we applied a precisely defined pulse of RA by first exposing the
cells to RA for a defined period of time and then switching to a
highly potent pan-RA receptor antagonist
30(Fig.
5
a). These
experiments showed that, contrary to our expectation, RA had to
be applied for at least 24 h for XEN-like cells to appear. Longer
pulses resulted in a gradual increase of the XEN-like fraction. A
36 h long pulse of RA resulted in 20% XEN-like cells at the 96 h
time point, roughly half of what we found after uninterrupted RA
exposure (Fig.
5
a). This indicated that even after 36 h of RA
exposure and significant down-regulation of the pluripotency
network XEN specification continued to depend on RA-signaling.
Timed abrogation of MAPK/Erk signaling by MEKi resulted in a
similar response as an RA pulse (Fig.
5
b). At least 24 h of
uninterrupted MAPK/Erk signaling was necessary for XEN-like
cells to occur. Longer durations of MAPK/Erk signaling resulted
in an increase in the XEN-like subpopulation. This effect
pla-teaued after 48 h, which suggested that XEN-like cells then
became independent of MAPK/Erk signaling and thus stably
committed. We also wanted to establish when cells lost their
ability to respond to RA signaling. To this end we
first
differ-entiated the cells in basal (N2B27) medium and started RA
exposure after a defined time period (Fig.
5
c). When RA exposure
was delayed by up to 12 h, we did not observe any difference in
the lineage distribution at the 96 h time point. For longer delays
of RA exposure, we found that the fraction of XEN-like cells
declined. This observation demonstrated that the cells quickly lost
dbl. neg. (PDGFRA−,CD24− ) Ecto (PDGFRA−,CD24+) dbl. pos. (PDGFRA+,CD24+) XEN (PDGFRA+,CD24−) 0 6 12 24 36 48 60 72 96 0 0.2 0.4 0.6 0.8 1
Start of MEK inhibition (h)
Rel. frequency , 96 h 0 h x h (Sample) RA 2i MEKi MEK inhib. Co nt ro l
a
b
0 6 12 24 36 48 60 72 96 0 0.2 0.4 0.6 0.8 1 Rel. frequency , 96 h Duration of RA pulse (h) 0 h x h (Sample) RA 2i Pulse Co nt ro lc
d
0 3 6 12 24 48 96 0 0.2 0.4 0.6 0.8 1Delay before RA incubation (h)
Rel. frequency , 96 h 0 h x h 96 h (Sample) RA 2i Delay Control X E P RA
e
PulsePulse or delay length (h)
Rel. freq. XEN-like cells
Delay Pluri. netw . on 10–2 0 20 40 60 80 100 0 0.1 0.2 0.3 0.4 0.5 10–3 10–4 10–5 Noise parameter D 96 h 9 6h
Fig. 5 Susceptibility to signaling inputs was highly dynamic around the exit from pluripotency. a–c Fractions of cells classified as XEN-like, ectoderm-like, double positive and double negative after 96 h, based on CD24 and PDGFRA expression. Expression of the two markers was measured by antibody staining andflow cytometry. a Cells were pulsed with 0.25 µM RA for x h (pulse) and subsequently differentiated in basal medium (N2B27) complemented with an RA receptor antagonist.b Cells were incubated with 0.25µM RA for x h (pulse) after which 0.5 µM PD0325901 (MEK inhibitor) was added for the remainder of the time course.c Cells werefirst incubated with basal medium (N2B27) for x h (delay) and then exposed to 0.25 µM RA for the remainder of the time course.d Schematic representation of a minimal gene regulatory network that can model a lineage decision32. Pointy arrows indicate (auto-) activation; blunted arrows indicate repression. E and X represent expression of ectoderm-like and XEN-like transcriptional programs, respectively. P stands for the pluripotency network. RA increases the auto-activation of the XEN program.e Results of the stochastic simulations of the network shown in d. The relative frequency of XEN-like cells after 96 h is shown vs. the length of an RA pulse (solid lines) or the length of the delay before RA exposure is started (dashed lines). In all cases the pluripotency network was turned off after 12 h. Simulations were run with different amounts of gene expression noise (D: noise power / time, see Methods). See Supplementary Fig.8b for exemplary trajectories
their susceptibility to RA after the exit from pluripotency. Taken
together, these signaling experiments revealed a short transient
phase after the exit from pluripotency, during which cells were
maximally susceptible to external signaling cues to inform their
lineage decision.
A minimal gene regulatory network of lineage bias.
Interest-ingly, our experiments revealed a difference in the lineage
response dynamics between the RA pulse and RA delay. While
cells abruptly lost their ability to become XEN-like after only 12 h
in N2B27 (Fig.
5
c), the RA pulse had to be applied for at least 24 h
to cause XEN-specification and longer pulses elicited a gradually
increasing response (Fig.
5
a). This asymmetry could be related to
the fact that N2B27 on its own drives differentiation towards the
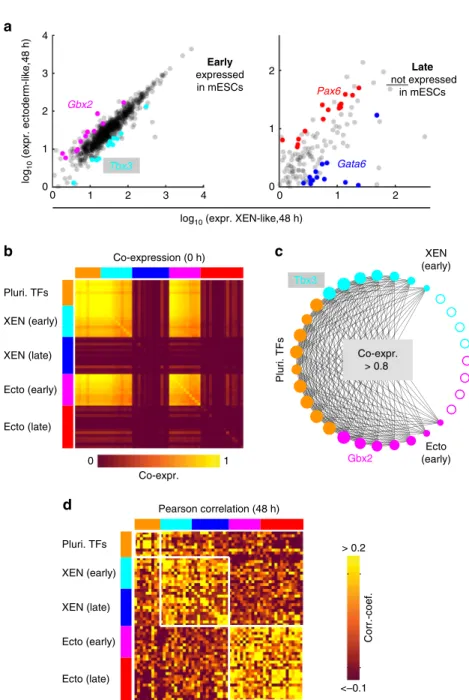
a
b
Gata6 Gbx2 Tbx3 log 10 (expr. ectoderm-like,48 h)log10 (expr. XEN-like,48 h)
Late not expressed in mESCs Early expressed in mESCs Co-expression (0 h) Pearson correlation (48 h) Pluri. TFs XEN (early) XEN (late) Ecto (early) Ecto (late) 0 1 <–0.1 > 0.2 Co-expr. Corr.-coef. Pluri. TFs XEN (early) XEN (late) Ecto (early) Ecto (late)
c
d
XEN (early) Pluri. TFs Ecto (early) Tbx3 Gbx2 0 1 2 3 4 0 1 2 3 4 0 1 2 0 1 2 Co-expr. > 0.8 Pax6Fig. 6 Distinct co-expression and correlation patterns identified two classes of lineage specific transcriptional regulators. a Expression of transcriptional regulators in ectoderm-like and XEN-like cells identified in the SMART-seq2 data set. Genes that were significantly differentially expressed after 48 h of RA exposure are shown in red or pink (overexpressed in ectoderm-like cells) and blue or cyan (overexpressed in XEN-like cells), respectively. The two panels contain genes, which are present in the pluripotent state (early, left panel) or absent in the pluripotent state (late, right panel). A list of all identified genes is given in Supplementary Fig.9b.b Co-expression of transcriptional regulators in the pluripotent state. The gene set comprised the differentially expressed transcriptional regulators identified here (see a), as well as pluripotency related transcription factors51(see Supplementary Fig.9b). Co-expression was calculated using gene expression measured by SMART-seq2. Co-expression of two genes was quantified as the fraction of cells in which the expression of both genes exceeded a certain threshold value (see Methods).c Co-expression network in the pluripotent state. Two genes are connected by an edge if their co-expression exceeds 0.8. The gene set comprised XEN specific regulators (cyan nodes) and ectoderm specific regulators (pink nodes) that are expressed in the pluripotent state (early factors), as well as pluripotency factors51(orange nodes). The radius of solid nodes is proportional to the number of connections to other nodes. Nodes without any connections are depicted as open nodes.d Pearson correlation between transcriptional regulators after 48 h of RA exposure. The gene set is the same as inb. Pearson correlation was calculated using gene expression measured by SMART-seq2
neuroectoderm lineage
31. Correspondingly, we consistently found
that the majority of cells became ectoderm-like when there was
no RA present (Fig.
5
a–c). To explore the role of an intrinsic
epiblast or ectoderm bias we developed a simple
phenomen-ological model based on a minimal gene regulatory network
(GRN)
27,32. Briefly, the GRN is comprised of two lineage-specific,
auto-activating expression programs that mutually repress each
other (Fig.
5
d, Supplementary Fig.
8
a). This GRN can produce
two stable attractors that correspond to two differentiated cell
types. Here, we added repression of both lineages by the
plur-ipotency network to model the pluripotent state. Consistent with
our data, we assumed that the pluripotency program is turned off
after 12 h. To model the ectoderm bias we assumed that
activation of the ectoderm program was stronger than
auto-activation of the XEN program in the absence of RA. In the
presence of RA auto-activation of both programs was taken to be
equal. Due to the great importance of gene expression noise in
lineage decision-making
5, 4, we also incorporated noise in our
model (Methods). Stochastic simulations of the 3-state GRN
reproduced the asymmetry between RA pulses and delays
(Fig.
5
e). The frequency of XEN-like cells decreased sharply when
the delay in RA signaling was extended beyond the exit from
pluripotency. The RA pulse, on the other hand, had to be applied
for a longer period of time to cause XEN-specification and the
response was more gradual. This behavior can be explained by the
fact that in the absence of RA cells are quickly drawn to the
ectoderm attractor after the exit from pluripotency. When RA is
added after a delay, the cells are already in the proximity of the
d
c
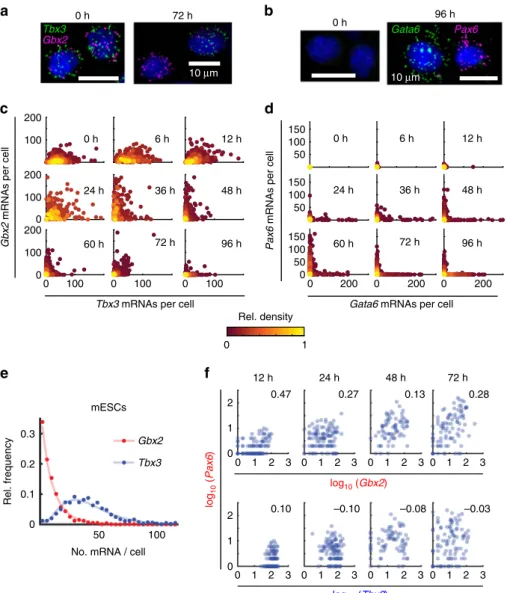
Gata6 10 µm 96 h Pax6 10 µm Gbx2 Tbx3 72 h 0 h 0 h Pax6mRNAs per cell
Gata6 mRNAs per cell
a
b
Gbx2
mRNAs per cell
Tbx3 mRNAs per cell
0 h 12 h log 10 ( Pax6 ) 24 h log10 (Tbx3) log10 (Gbx2) 48 h 72 h 0 1 2 0 1 2 1 2 3 0 0 1 2 3 0 1 2 3 0 1 2 3 0.47 0.10 0.27 –0.10 0.13 –0.08 0.28 –0.03 1 2 3 0 0 1 2 3 0 1 2 3 0 1 2 3 50 100 150 50 100 150 0 200 0 50 100 150 0 200 0 200 6 h 24 h 36 h 48 h 60 h 72 h 96 h 12 h 100 200 100 200 0 100 0 100 200 0 100 0 100 0 0 1 Rel. density
e
0 h 6 h 24 h 36 h 48 h 60 h 72 h 96 h 12 hf
No. mRNA / cell
Rel. frequency mESCs Gbx2 Tbx3 50 100 0 0.1 0.2 0.3
Fig. 7 smFISH confirmed distinct expression patterns of exemplary transcription factors. a Fluorescence images of smFISH for Gbx2 and Tbx3 in mESCs (0 h) and after 72 h RA exposure. Each diffraction limited dot corresponds to a single mRNA molecule. Hoechst staining of nuclei is shown in blue. b Fluorescence images of smFISH forPax6 and Gata6 in mESCs (0 h) and after 96 h RA exposure. Each diffraction limited dot corresponds to a single mRNA molecule. Hoechst staining of nuclei is shown in blue.c Scatter plots of the number ofGbx2 and Tbx3 mRNAs per cell measured by smFISH. Each data point is a single cell. Color indicates the local density of data points. The number of shown cells measured at a certain time point ranges between 224 and 983.d Scatter plots of the number ofPax6 and Gata6 mRNAs per cell measured by smFISH. Each data point is a single cell. Color indicates the local density of data points. The number of shown cells measured at a certain time point ranges between 293 and 570.e Distribution of theTbx3 and Gbx2 transcripts in individual mESCs as measured by smFISH. Both data sets arefit by a Gamma distribution (Tbx3, R2= 0.94, solid blue line; Gbx2, R2= 0.99, solid red line).f Scatter plots of the number of mRNAs per cell forGbx2 and Tbx3 vs Pax6 measured by smFISH. Each data point is a single cell. Cells were exposed to RA for 12 h, 24 h, 48 h and 72 h, respectively, as indicated above each column of panels. The number in each panel is the Pearson correlation between the genes plotted in the respective panel
ectoderm attractor and cannot escape it anymore, which causes
the lack of XEN cells. Notably, the asymmetry between the
response curves was reduced by gene expression noise. Noise
allowed the cells to switch between the basins of attraction of the
two attractors (Supplementary Fig.
8
b), thereby equalizing the
intrinsic difference between the two attractors. Taken together,
our stochastic simulations showed that an intrinsic ectoderm bias
can explain the difference in the response dynamics between an
RA signal delay and an RA pulse.
Two classes of transcriptional regulators. Having revealed a
highly dynamic susceptibility to signaling cues, we were
won-dering if the expression of transcriptional regulators was equally
dynamic. To that end we focused on transcriptional regulators
that show lineage specific expression when the two lineages can
be
first discerned robustly, around 48 h (see Methods for the list
of GO terms used to define transcriptional regulators). Since these
regulators were typically lowly expressed, they were not
well-represented in the SCRB-seq data set. Therefore, we collected
another single-cell RNA-seq data set using SMART-seq2
33at four
early RA differentiation time points (0 h, 12 h, 24 h and 48 h). We
first identified XEN-like and ectoderm-like cells at the 48 h time
point (Supplementary Fig.
9
a). The remaining cells were likely
mostly undifferentiated cells as several pluripotency factors were
differentially expressed in this population (Supplementary
Fig.
9
b). In the cells classified as XEN- or ectoderm-like we found
50 transcriptional regulators to be differentially expressed
between the two lineages (Fig.
6
a, Supplementary Fig.
9
b). 22 of
those genes (dubbed
“early”) were present already in mESCs.
These early regulators were broadly co-expressed in individual
cells at the beginning of the time course (Fig.
6
b and
Supple-mentary Fig.
9
c). Compared to canonical pluripotency factors,
early regulators showed a smaller level of co-expression with each
other in the pluripotent state, in particular if they belonged to
different lineages (Fig.
6
b, c). Individual mESCs thus expressed
varying ratios of XEN and ectoderm specific early regulators.
Over time, co-expression of XEN and ectoderm specific early
regulators declined but they never became completely mutually
exclusive (Supplementary Fig.
9
c). Hence, we speculated that
other transcriptional regulators might be up-regulated in lineage
biased cells and take over lineage specification from the early
regulators. Indeed, 28 of the identified differentially expressed
regulators (dubbed
“late”) were, by definition, not significantly
expressed at the beginning of the time course (Fig.
6
a,
Supple-mentary Fig.
9
b). These late regulators were overall positively
correlated with early regulators of the same lineage and
anti-correlated with regulators of the opposing lineage (Fig.
6
d and
Supplementary Fig.
9
c). This correlation pattern suggested that
early regulators might have a role in lineage biasing, whereas late
factors could be involved in lineage commitment.
To confirm the sequential expression of early and late
regulators, we next focused on four transcription factors, chosen
based on their reported function for the specification of ectoderm
(Gbx2
34(early), Pax6
35(late)) and extraembryonic endoderm
(Tbx3
36(early), Gata6
37(late)). Notably, Tbx3 and likely also
Gbx2 are direct targets of RA
38, 39. In agreement with their
reported roles we found these 4 factors to be differentially
expressed in ectoderm-like and XEN-like cells, respectively, in
our SCRB-seq data set (Supplementary Fig.
9
d). To quantify
correlation patterns with high precision we used single-molecule
FISH (smFISH
40) due to its superior sensitivity and precision
compared to single-cell RNA-seq (Supplementary Fig.
10
a). We
measured the expression of the early factors (Fig.
7
a, c) or the late
factors (Fig.
7
b, d) together with the pluripotency factor Nanog
and quantified co-expression at all time points (Supplementary
Fig.
10
b–d). In agreement with the SMART-seq2 data, early
factors were broadly co-expressed in the pluripotent state and a
smaller subpopulation of co-expressing cells persisted during
differentiation (Fig.
7
c, Supplementary Fig.
10
c). Importantly,
mESCs expressed the early factors at highly variable ratios: 30% of
mESCs did not express the early ectoderm factor Gbx2 at a
significant level, while almost all cells expressed the early XEN
factor Tbx3 (Fig.
7
e). smFISH further confirmed that late factors
were only sporadically expressed before the exit from
pluripo-tency but strongly up-regulated in separate subpopulations
thereafter. These subpopulations likely corresponded to
lineage-committed cell states (Fig.
7
d and Supplementary Fig.
10
d, e).
Interestingly, a simultaneous measurement of the early ectoderm
factor Gbx2 and the late ectoderm factor Pax6 revealed their
positive correlation throughout the time course, even before the
exit from pluripotency (Fig.
7
f). A possible explanation for such a
correlation might be a lineage-biasing role for Gbx2. All in all, the
smFISH measurements clearly confirmed differences in the
expression dynamics and correlation patterns of early and late
transcriptional regulators.
Discussion
In summary, we leveraged a recently developed high-throughput
single-cell transcriptomics method to dissect the exit from
plur-ipotency and dynamics of lineage commitment in RA driven
differentiation of mESCs with high temporal resolution. We
characterized the influence of the external signaling environment
and explained the dynamics of the signaling response with a
minimal gene regulatory network. We
finally identified potential
transcriptional regulators of lineage decision and commitment.
In particular, we showed that after 96 h of RA exposure mESCs
had differentiated into neuroectoderm-like and XEN-like cells. By
purification and continued culture we showed that these cell types
are stable and not just transient expression
fluctuations. In
agreement with previous results
22we found mESCs cultured in
2i/L to be transcriptionally most similar to E4.5 epiblast in vivo
(Fig.
4
a–c). At E4.5 the lineage decision between primitive
endoderm and epiblast has already occurred, so a priori it would
not be expected that mESCs should be able to generate XEN cells.
The potential to create XEN-like cells could be explained by a
subpopulation of cells in the pluripotent state that resembles an
earlier developmental stage. In our single-cell RNA-seq data set
we could not
find evidence for such pre-existing heterogeneity
(Fig.
4
a). Alternatively, RA might have caused the
dedifferentia-tion of the whole mESC populadedifferentia-tion to an earlier developmental
stage after which the cells could follow the in vivo bifurcation
between E4.5 epiblast and primitive endoderm. While the whole
population indeed initially moved closer to the E3.5 inner cell
mass during the
first 24 h, cells then moved towards E5.5 epiblast
before discernible XEN-like cells appeared (Supplementary
Fig.
6
). Hence, most likely XEN-like cells are created by
trans-differentiation from E4.5 or E5.5 epiblast-like cells and mESCs
initially decide between progression along the epiblast lineage and
the XEN-like cell type right after the exit from pluripotency. The
epiblast lineage then further develops to neuroectoderm-like cells
by 96 h. A recently published study by Klein et al. used single-cell
RNA-seq to characterize mESC differentiation by LIF
with-drawal
41and also found a small XEN-like subpopulation. That
and other studies
42, 27show that XEN-like cells occur more
generally in in vitro differentiation of mESCs and are not an
idiosyncratic artefact of exposure to RA. We also found that
mESCs grown in 2i/L (but not in serum and LIF) efficiently
generate XEN cells under RA exposure (Supplementary
Fig.
7
a, b). Similarly, Schröter et al. have observed, for a different
differentiation assay, that pre-culture in 2i/L greatly increases the
number of XEN-like cells generated from mESCs
27. Together
with those results our observations thus support a model in which
mESCs grown in 2i/L functionally correspond to a slightly earlier
developmental stage than mESCs grown in serum and LIF
42.
Despite the artificial nature of the lineage transition described
here, we observed several similarities with the epiblast/primitive
endoderm bifurcation in vivo. A recent study by Saiz et al. in the
mouse embryo
43showed that epiblast and primitive endoderm
are specified asynchronously from a pool of progenitor cells,
which also happened in our experiments (Fig.
2
c). Furthermore,
in the absence of primitive endoderm inducing signals, all cells of
the inner cell mass become epiblast-like in vivo
29,43–45. In our
experiments the majority of mESCs adopted the
epiblast/ecto-dermal lineage in the absence of RA, in agreement with the
literature
31, 46. Saiz et al. observed that MEKi prevented the
specification of primitive endoderm, in agreement with an earlier
report by Nichols et al
47. The experiments by Saiz et al. also
revealed that the susceptibility to MEKi disappeared gradually
between E3.5 and E4.5. Our experiments with MEKi showed
similar dynamics (Fig.
5
b). Thus, both in vivo and in vitro, cells
seem to gain competence to respond to XEN specifying signals
over time. In vitro, the susceptibility to signaling inputs is thought
to be contingent on the down-regulation of pluripotency factors
and the exit from pluripotency
46,48, a notion which is supported
by our study (Fig.
5
a–c). Our results thus clearly reveal a window
of opportunity right after the exit from pluripotency, which might
be exploited to guide lineage decisions with maximal efficacy.
Using a minimal GRN to model the lineage decision, we also
showed that an inherent epiblast/ectoderm bias can cause the
observed asymmetry between an RA delay and an RA pulse
(Fig.
5
d). A similar GRN has been used successfully before in a
report by Schröter et al., studying induction of the XEN lineage by
exogenous Gata4 expression
27. Importantly, our model does not
strictly require an ectoderm bias. An initial bias for progression
along the epiblast lineage (and continued differentiation to
ectoderm under RA) would be sufficient. This interpretation is in
line with previous results that reported expression of
non-ectodermal markers during early stages of differentiation in
N2B27
49. Notably, in our model, gene expression noise was able
to reduce the asymmetry between the RA regimens, because gene
expression trajectories could switch more easily between the
basins of attraction of the two lineage attractors (Supplementary
Fig.
8
b). The impact of noise in the context of lineage decisions
was recently addressed in a publication by Marco et al
50. In that
study the authors focused on the ability of noise to destabilize
committed cell states. Here we showed that noise can also impact
commitment dynamics and even mask an intrinsic lineage bias.
This result suggests that gene expression noise could be exploited
to influence lineage decision-making in vitro.
Our study further identified early-expressed lineage specific
transcriptional regulators that are heterogeneously expressed in
the pluripotent state and thus have a potential role in biasing the
lineage decision. Importantly, the two factors we studied in detail,
Gbx2 and Tbx3, were previously determined to be part of an
essential pluripotency network
51–55. It has been suggested before
that some pluripotency genes are also involved in lineage
specification
25,48,49. Thomson et al. showed that Sox2 and Oct4
promote the neuroectodermal and mesendodermal lineage,
respectively
48. Malleshaiah et al. reported similar functions for
Nac1 and Tcf3, respectively
25. Future research will have to show
whether Gbx2 and Tbx3 have similar roles for the
epiblast/neu-roectoderm and XEN lineage, respectively. In fact, for Tbx3 Lu
et al. recently demonstrated a dual function in self-renewal and
XEN specification
36. The observed correlation between Gbx2 and
Pax6 suggests a function of Gbx2 in epiblast or neuro-ectoderm
specification. The long-tail distribution of Gbx2 in mESCs hints at
infrequent transcriptional bursting and possibly distinct
sub-populations
56. The causal relationship between Gbx2 and Pax6
and the functional relevance of the Gbx2 high subpopulations will
be explored in a future study. Late-expressed lineage specific
transcription factors, like Pax6 and Gata6, which were not
expressed in the pluripotent state, have a role in lineage
com-mitment. They can thus serve as bona
fide lineage markers.
Transient phases of susceptibility to lineage cues, such as the
one characterized in this study, might be valuable windows of
opportunity for the control of lineage decisions. We speculate that
exit from a pluripotent cell state necessarily coincides with a
phase of instability and increased gene expression variability, as
demonstrated recently for lineage decisions in the hematopoietic
system
57,58. Based on our results we would like to propose
ten-tative transcriptional signatures of such phases (Fig.
8
): 1.
down-regulation of pluripotency factors (Fig.
1
c), 2. a sudden increase
in single-cell gene expression variability (Fig.
1
d), 3. slowly
diverging lineage specific expression patterns (Fig.
2
d), 4.
co-expression of early-expressed (thus potentially lineage-biasing)
transcriptional regulators (Fig.
6
b), 5. sporadic expression of
late-expressed (thus potentially lineage-committing) transcriptional
regulators (Fig.
7
d). We hope that these results will be a stepping
stone towards
finding more efficient ways to guide lineage
decisions.
Methods
Cell culture. All cell lines were grown routinely in modified 2i medium11plus LIF
(2i/L): DMEM/F12 (Life technologies) supplemented with 0.5x N2 supplement, 0.5x B27 supplement, 0.5mML-glutamine (Gibco), 20µg/ml human insulin (Sigma-Aldrich), 1 × 100U/ml penicillin/streptomycin (Gibco), 0.5x MEM Non-Essential Amino Acids (Gibco), 0.1 mM 2-Mercaptoethanol (Sigma-Aldrich), 1µM MEK inhibitor (PD0325901, Stemgent), 3µM GSK3 inhibitor (CHIR99021, Stemgent), 1000 U/ml mouse LIF (ESGRO). Cells were passaged every other day with Accutase (Life technologies) and replated on gelatin coated tissue culture plates (Cellstar, Greiner bio-one).
E14 cells were provided by A. van O., V6.5 cells were provided by R.J. Both cell lines were regularly tested for mycoplasma infection.
Exit from pluripotency mESC ECT XEN Post-imp. epi Expression of pluripotency factors
Expression of early regulators
Single-cell gene expression variability
Expression of late regulators
2i 96 h RA
Differentiation. Prior to differentiation cells were grown in 2i/L for at least 2 passages, with the exception of the experiment shown in Supplementary Fig.7a,b: here cells were grown in knockout DMEM (Thermofisher) supplemented with 10% ES cell screened FBS (Sigma), 1 × 100U/ml penicillin/streptomycin (Gibco), 0.1 mM 2-Mercaptoethanol (Sigma-Aldrich) and 1000 U/ml mouse LIF (ESGRO) for 3 passages prior to differentiation. For all differentiation experiments cells were seeded at a density of 2.5 × 10⁵cells per 10 cm dish and grown over night (12 h).
After washing cells twice with PBS, differentiation was carried out in basal N2B27 medium (2i/L medium without the inhibitors, LIF and the additional insulin) supplemented with all-trans retinoic acid (RA, Sigma-Aldrich). RA concentration was 0.25µM unless stated otherwise. Spent medium was exchanged with fresh medium after 48 h.
For the RA pulse experiments (Fig.5a) cells werefirst differentiated with 0.25 µM RA for the indicated amounts of time, washed three times with PBS and cultured in basal medium with 2.5µM of the RA receptor antagonist AGN 193109 (sc-210768, Santa Cruz Biotechnology). At this concentration this antagonist completely inhibits signaling through all-trans retinoic acid30.
For the differentiation under perturbation of various signaling pathways (Supplementary Fig.7c) we used the MEK inhibitor PD0325901 (Stemgent, standard concentration 1µM or dilutions thereof), GSK3 inhibitor CHIR99021 (Stemgent, standard concentration 3µM or dilutions thereof) or mouse LIF (ESGRO, 1000 U/ml). For the experiments with MEK inhibition shown in Fig.5b and Supplementary Fig.7d,e we used PD0325901 at a concentration of 0.5µM. For differentiation under inhibition of FGF signaling, shown in Supplementary Fig.7g, h we used the FGF receptor inhibitor PD173074 (Sigma-Aldrich) at a
concentration of 1µM.
Multiple biological replicates of the differentiation of E14 cells with RA were performed, where replicates were characterized with different methods to cross-validate the results: SCRB-seq (1 replicate), SMART-seq2 (1 replicate), smFISH (3 replicates where 2 replicates used the same probe set), antibody staining (3 replicates). Morphologies similar to the ones shown in the representative images in Fig.1a and Supplementary Fig.5b were observed in at least 5 independent biological replicates of the experiment.
Long-term culture of differentiated cells. Cells that were differentiated for 96 h with RA were sorted into ectoderm-like (CD24A + /PDGFRA-) and XEN-like (PDGFRA + /CD24-) and replated on poly-D-lysine and laminin coated tissue culture dishes in basal (N2B27) medium complemented with 20 ng/ml mouse EGF (E5160, Sigma) and 10 ng/ml mouse FGF2 (SRP4038-50UG, Sigma). Ectoderm-like cells were propagated by dissociation with Accutase (Life Technologies) and replating under identical conditions every 3–4 days. Floating aggregates of XEN-like cells were propagated in suspension in uncoated plastic petri dishes. Aggregates were not dissociated but the medium was refreshed typically every 4 days. Morphologies similar to the ones shown in the representative images in Supple-mentary Fig.4c were observed in 3 independent biological replicates of the experiment.
Antibody staining and FACS sorting. We used the following antibodies: APC Rat Anti-Mouse CD24 (BD Bioscience, 562349), PE Rat Anti-Mouse CD24 (BD Bioscience, 553262), Anti-Mouse CD140a (PDGFRA) FITC (eBioscience,17-1407), Anti-Mouse CD140a (PDGFRA) APC (eBioscience,17-1401), all at a dilution of 1:1000. Cells growing in 6-well plates were washed once with PBS and then incubated in a volume of 500µl of basal (N2B27) medium with antibodies for 30 min at 37 °C, in the dark. Subsequently, cells were washed once with PBS, 300µl Accutase (Life Technologies) was added and cells were gently dissociated by pipetting up and down. After adding 600µl of basal medium the cell suspension was loaded on aflow cytometer (LSR II, BD Bioscience) or cell sorter (FACSAria III, BD Bioscience). Cells growing in 10 cm dishes werefirst dissociated and incubated in 1 ml medium with the same incubation conditions and antibody concentrations as for adherent cells. After staining in solution, cells were spun down, the supernatant was removed and cells were resuspended in 1 ml of basal medium beforeflow cytometry or sorting.
Sorting gates for positive and negative populations were set by comparison to the signal measured in undifferentiated mESCs. For the experiments shown in Fig.4b, c cells were sorted according to quartiles of CD24 signal at 48 h or terciles of CD24 signal at 72 h.
Colony formation assay. Cells were differentiated with or without RA as described above for various amounts of time and then replated at a density of 5 × 10⁴cells/ well in a gelatinized 6-well tissue culture plate in 2i/L. Colonies were grown for 2 additional days, washed twice with PBS and then imaged in PBS. Remaining colonies were counted automatically by a custom made image analysis script written in MATLAB. The number of surviving colonies was normalized to thefirst data point (replating of untreated cells growing in 2i/L).
Measurement of cell cycle phases. Cells growing on gelatinized tissue culture dishes were washed twice with PBS, detached with Accutase (Life technologies) and resuspended in full medium. Formaldehyde was added to the cell suspension to a final concentration of 4%. Cells were incubated for 12 min at room temperature
while being rotated and then spun down for 3 min at 90 x g. Subsequently cells were permeabilized at least over night in 70% ethanol. Cells were stained with Hoechst 33342 in PBS for 1 h andfluorescence measured on a flow cytometer (LSR II, BD Biosciences). The Dean-Jet-Fox model59wasfit to histograms of the
fluorescence signal to determine the relative lengths of the cell cycle phases reported in Supplementary Fig.5c.
Single cell isolation for SCRB-seq. For each differentiation time point cells were harvested and medium removed by spinning for 5 min at 90 x g. RNA was sta-bilized by immediately resuspending the pelleted cells in RNAprotect Cell Reagent (Qiagen) and RNaseOUT Recombinant Ribonuclease Inhibitor (Life Technologies) at a 1:1000 dilution. Just prior tofluorescence-actived cell sorting (FACS), the cells were diluted in PBS and stained for viability using Hoechst 33342 (Life Technol-ogies). 384-well SBS capture plates werefilled with 5 μl of a 1:500 dilution of Phusion HF buffer (New England Biolabs) in water and individual cells were then sorted into each well using a FACSAria IIflow cytometer (BD Biosciences) based on Hoechst DNA staining. After sorting, the plates were immediately sealed, spun down, cooled on dry ice and then stored at−80°C.
SCRB-Seq of isolated single cells. Frozen cells were thawed for 5 min at room temperature and cell lysis was enhanced by a treatment with proteinase K (200μg/ mL;Ambion) followed by RNA desiccation to inactivate the proteinase K and simultaneously reduce the reaction volume (50 °C for 15 min in sealed plate, then 95 °C for 10 min with seal removed).
To start, diluted ERCC RNA Spike-In Mix (1μl of 1:107; Life Technologies) was
added to each well and the template switching reverse transcription reaction was carried out using Maxima H Minus Reverse Transcriptase (Thermo Scientific), our universal adapter E5V6NEXT (1 pmol, Eurogentec):
5′-iCiGiCACACTCTTTCCCTACACGACGCrGrGrG-3′
where iC: iso-dC, iG: iso-dG, rG: RNA G, and our barcoded adapter E3V6NEXT (1 pmol, Integrated DNA Technologies):
5′-/5Biosg/ACACTCTTTCCCTACACGACGCTCTTCCGATCT[BC6] N10T30VN-3′
where 5Biosg= 5′ biotin, [BC6] = 6 bp barcode specific to each cell/well, N10 = Unique Molecular Identifiers. Following the template switching reaction, cDNA from 384 wells was pooled together, and then purified and concentrated using a single DNA Clean & Concentrator-5 column (Zymo Research). Pooled cDNAs were treated with Exonuclease I (New England Biolabs) and then amplified by single primer PCR using the Advantage 2 Polymerase Mix (Clontech) and our SINGV6 primer (10 pmol, Integrated DNA Technologies):
5′-/5Biosg/ACACTCTTTCCCTACACGACGC-3′
Full length cDNAs were purified with Agencourt AMPure XP magnetic beads (0.6x, Beckman Coulter) and quantified on the Qubit 2.0 Flurometer using the dsDNA HS Assay (Life Technologies). Full-length cDNA was then used as input to the Nextera XT library preparation kit (Illumina) according to the manufacturer’s protocol, with the exception that the i5 primer was replaced by our P5NEXTPT5 primer (5μM, Integrated DNA Technologies):
5′-AATGATACGGCGACCACCGAGATCTACACTCTTTCCCTACACGACG CTCTTCCG *A*T*C*T*-3′
where *= phosphorothioate bonds.
The resulting sequencing library was purified with Agencourt AMPure XP magnetic beads (0.6x, Beckman Coulter), size selected (300–800 bp) on a E-Gel EX Gel, 2% (Life Technologies), purified using the QIAquick Gel Extraction Kit (Qiagen) and quantified on the Qubit 2.0 Flurometer using the dsDNA HS Assay (Life Technologies). Libraries were sequenced on Illumina Hiseq paired-endflow cells with 17 cycles on thefirst read to decode the well barcode and UMI, a 9 cycle index read to decode the i7 Nextera barcode andfinally a 46 cycle second read to sequence the cDNA.
RNA-seq on bulk samples. Bulk RNA-seq samples comprise complete popula-tions at 10 time points during RA differentiation (Supplementary Fig.1) as well as various sorted subpopulations (Fig.4b, c) and long term cultured ectoderm- and XEN-like cells (Supplementary Fig.4d, e). Cells were collected in RNAprotect, lysed in QIAzol (Qiagen) and total RNA was extracted and purified using Direct-zol RNA MiniPrep (Zymo Research). DGE libraries were prepared from 10 ng of extracted total RNA, using the protocol described above for SCRB-seq with the exception of using more concentrated E3V6NEXT and E5V6NEXT (10 pmol).
SCRB-seq and bulk RNA-seq read alignment. All second sequence reads were aligned to a reference database consisting of all mouse RefSeq mRNA sequences (obtained from the UCSC Genome Browser mm10 reference set:http://genome. ucsc.edu/), the mouse mm10 mitochondrial reference sequence and the ERCC RNA spike-in reference sequences using bwa version 0.7.4 with non-default parameter“-l 24”. Read pairs for which the second read aligned to a mouse RefSeq gene were kept for further analysis if 1) the initial six bases of thefirst read all had quality scores of at least 10 and corresponded exactly to a designed well-barcode and 2) the next ten bases of thefirst read (the UMI) all had quality scores of at least 30. Digital gene expression (DGE) profiles were then generated by counting, for each microplate well and RefSeq gene, the number of unique UMIs associated with