HAL Id: hal-01579380
https://hal.sorbonne-universite.fr/hal-01579380
Submitted on 31 Aug 2017
HAL is a multi-disciplinary open access
archive for the deposit and dissemination of
sci-entific research documents, whether they are
pub-lished or not. The documents may come from
teaching and research institutions in France or
abroad, or from public or private research centers.
L’archive ouverte pluridisciplinaire HAL, est
destinée au dépôt et à la diffusion de documents
scientifiques de niveau recherche, publiés ou non,
émanant des établissements d’enseignement et de
recherche français ou étrangers, des laboratoires
publics ou privés.
different dust emission parametrisation: assessment in
the broader Mediterranean region
Emmanouil Flaounas, Vassiliki Kotroni, Konstantinos Lagouvardos, Martina
Klose, Cyrille Flamant, Theodore M. Giannaros
To cite this version:
Emmanouil Flaounas, Vassiliki Kotroni, Konstantinos Lagouvardos, Martina Klose, Cyrille Flamant,
et al.. Sensitivity of the WRF-Chem (V3.6.1) model to different dust emission parametrisation:
assess-ment in the broader Mediterranean region. Geoscientific Model Developassess-ment, European Geosciences
Union, 2017, 10 (8), pp.2925-2945. �10.5194/gmd-10-2925-2017�. �hal-01579380�
https://doi.org/10.5194/gmd-10-2925-2017 © Author(s) 2017. This work is distributed under the Creative Commons Attribution 3.0 License.
Sensitivity of the WRF-Chem (V3.6.1) model to different
dust emission parametrisation: assessment in the broader
Mediterranean region
Emmanouil Flaounas1, Vassiliki Kotroni1, Konstantinos Lagouvardos1, Martina Klose2, Cyrille Flamant3, and Theodore M. Giannaros1
1National Observatory of Athens, Athens, Greece
2USDA-ARS Jornada Experimental Range, Las Cruces, NM, USA
3LATMOS/IPSL, UPMC Univ. Paris 06, Sorbonne Universités, UVSQ, CNRS, Paris, France
Correspondence to:Emmanouil Flaounas (flaounas@noa.gr) Received: 21 December 2016 – Discussion started: 1 February 2017
Revised: 31 May 2017 – Accepted: 15 June 2017 – Published: 4 August 2017
Abstract. In this study we aim to assess the WRF-Chem model capacity to reproduce dust transport over the east-ern Mediterranean. For this reason, we compare the model aerosol optical depth (AOD) outputs to observations, focus-ing on three key regions: North Africa, the Arabian Peninsula and the eastern Mediterranean. Three sets of four simulations have been performed for the 6-month period of spring and summer 2011. Each simulation set uses a different dust emis-sion parametrisation and for each parametrisation, the dust emissions are multiplied with various coefficients in order to tune the model performance. Our assessment approach is performed across different spatial and temporal scales using AOD observations from satellites and ground-based stations, as well as from airborne measurements of aerosol extinction coefficients over the Sahara.
Assessment over the entire domain and simulation period shows that the model presents temporal and spatial variabil-ity similar to observed AODs, regardless of the applied dust emission parametrisation. On the other hand, when focusing on specific regions, the model skill varies significantly. Tun-ing the model performance by applyTun-ing a coefficient to dust emissions may reduce the model AOD bias over a region, but may increase it in other regions. In particular, the model was shown to realistically reproduce the major dust trans-port events over the eastern Mediterranean, but failed to cap-ture the regional background AOD. Further comparison of the model simulations to airborne measurements of vertical profiles of extinction coefficients over North Africa suggests
that the model realistically reproduces the total atmospheric column AOD. Finally, we discuss the model results in two sensitivity tests, where we included finer dust particles (less than 1 µm) and changed accordingly the dust bins’ mass frac-tion.
1 Introduction
The geographical belt composed by North Africa and the Arabian Peninsula constitutes the largest desert in the world (Tsvetsinskaya et al., 2002). This region is a major dust source, emitting annually large loads into the atmosphere and thus has a global impact on climate and air quality (Huneeus et al., 2011). While both North Africa and the Arabian Penin-sula emit remarkable amounts of particulate matter, it is the Saharan desert that constitutes the worldwide main source of dust. In fact, annual dust emissions from the Arabian Penin-sula are about one-fifth of those from North Africa (Taichu et al., 2006). Dryan et al. (1991) showed that dust intru-sions in the eastern Mediterranean from the Arabian Penin-sula have a short duration (of the order of a day) and take place within shallow atmospheric layers of up to 2 km a.s.l., while African dust intrusions persist longer (2–4 days of du-ration) and transport takes place at atmospheric layers over 3 km of altitude.
Climatologically, the emissions of dust over both regions are higher during spring and summer (Engelstaedter et al.,
2006; Taichu et al., 2006). During this period, the atmo-spheric dynamics over North Africa, the Middle East and the eastern Mediterranean are strongly impacted by the monsoon system of western Africa and India (Flaounas et al., 2012; Tyrlis et al., 2014). The Indian monsoon onset establishes a low pressure system that extends from the Indian subconti-nent to the eastern Mediterranean. A quasi-constant descend-ing cell of air masses is located over the eastern Mediter-ranean with pronounced impact on the surface wind circu-lation over the region (Tyrlis et al., 2014). Under these con-ditions dust storms are frequent over the Arabian Peninsula (Miller et al., 2008), while the Mediterranean climate and dust emissions are strongly affected by the West African monsoon and the Saharan heat low (Chauvin et al., 2010; Wang et al., 2015). Indeed, early summer is of particular in-terest for west African dust emissions. At the end of June, the monsoon propagates towards the north, displacing the intertropical discontinuity (a near-surface convergence zone between the monsoon and the Harmattan wind) to 20◦N over the main source areas of dust (Prospero et al., 2002; Sultan et al., 2007; Klose et al., 2010; Gazeaux et al., 2011). In-deed, this region has been estimated by Evan et al. (2015) to emit about 80 % of the total North African dust. In particu-lar, Engelstaedter et al. (2006) showed that the West African monsoon onset plays a key role in the regional seasonal max-imum of dust emissions. While uptakes of dust may occur due to local meteorological events such as dust devils, wind surges, turbulent mixing of low-level jets and cold pools as-sociated with convective systems (Washington et al., 2006; Bou Karam et al., 2008; Knippertz and Todd, 2012; Klose and Shao, 2013), synoptic-scale systems may transport dust away from the continent with a global impact (D’Almeida, 1986; Prospero, 1996; Moulin et al., 1997a; Kaufman et al., 2005; Bristow et al., 2010; Bou Karam et al., 2010; Prospero et al., 2014; Flaounas et al., 2015).
Despite the importance of the African continent as a worldwide major dust source, the quantification of dust emissions is still an open question and strongly relies on nu-merical modelling. However, modelling dust uptake is a del-icate issue, subject to a variety of uncertainties associated with the model’s capacity to realistically reproduce the near-surface meteorological conditions, the applied dust emission parametrisation, the model’s vertical and horizontal resolu-tions, as well as the surface-related input datasets, such as erodible areas (e.g. Menut et al., 2007; Haustein et al., 2015; Teixeira et al., 2015; Evan et al., 2015; Basart et al., 2017). Indeed, the results of the analysis of an ensemble of 15 mod-els showed that the potential dust emissions of North Africa vary significantly, ranging between 400 and 2200 Tg year−1 (Huneeus et al., 2011).
Accurate forecasts of dust emission and transport are also a societal demand worldwide as they pertain to many health and economic issues, such as air quality. Ambient air pollu-tion is now the world’s largest single environmental health risk, causing 3.7 million premature deaths worldwide
ev-ery year (World Health Organization, 2014; Lelieveld et al., 2015). Modelling dust uptake and transport requires adequate parametrisations, input fields and tuning techniques in order for results to best match observations (Basart et al., 2012; Benedetti et al., 2014; Sessions et al., 2015). For instance, Flaounas et al. (2009) showed that the realistic simulation of a pollution episode in southern France depended strongly on the explicitly resolved dust emissions over North Africa. In another case study of a 3-day dust event over the Bodélé de-pression in northern Africa, Todd et al. (2008) showed that the simulated dust-related fields (such as dust flux and con-centration) from five models differed by at least an order of magnitude. The meteorological conditions were realistically reproduced by all five models, suggesting that uncertainties were mostly related to the dust emission parametrisations and/or corresponding land-surface input data.
In this study, we test the sensitivity of the Weather Re-search and Forecasting model with chemistry (WRF-Chem) version 3.6.1 (Grell et al., 2005) to the dust emission parametrisation through the comparison of modelled and ob-served atmospheric optical depth (AOD) over a large re-gion that includes North Africa, the Arabian Peninsula and the eastern Mediterranean basin. The WRF-Chem model has been previously used to investigate dust storms and dust in-teractions with atmospheric thermodynamics and radiation (e.g. Zhao et al., 2010; Smoydzin et al., 2012; Kalender-ski et al., 2013). In particular, Su and Fung (2015) used WRF-Chem to assess its performance to simulate dust con-centrations over East Asia using two different dust emis-sion parametrisations. Their results showed significant dif-ferences in the WRF-Chem performance when different dust uptake parametrisations were applied. To the best of the au-thors’ knowledge, this is the first comprehensive study in evaluating the model performance with a focus on dust emis-sions over the area of northern Africa, the Arabian Penin-sula and the eastern Mediterranean. Our study concentrates on the 6-month period from spring to summer 2011, when dust transport over the Mediterranean is expected to be high. Summer 2011 was included in the evaluation period in order to benefit from aircraft measurements of aerosol extinction coefficient profiles that were acquired over the Sahara during the Fennec campaign (Ryder et al., 2015).
Our objective is to assess the model performance in key dust source regions. For this purpose, we performed three sets of simulations with each set using a different dust emis-sion scheme. For every dust emisemis-sion scheme we applied different tuning coefficients to the surface dust emission fluxes (a total of 12 simulations). Model outputs have been compared to AOD, as observed by satellites, ground-based aerosol robotic network (AERONET, Holben et al., 1998) stations and to airborne lidar-derived extinction coefficient measurements. Retaining the dust schemes in their original configuration, but multiplying dust emissions by different co-efficients, is a straight forward tuning of the model perfor-mance, in order to achieve realistic AOD values within the
simulation domain. However, tuning dust emissions is a sec-ondary objective here that aims to establish an empirically modified model set-up that effectively reproduces dust trans-port over the eastern Mediterranean. The limitation of this approach is that the tuning has no physical basis and hence the model adjustment is only valid for the specific simulation area and model set-up (see also Sect. 5).
2 Simulation set-up, observations and methods 2.1 Model domain and configuration
The WRF-Chem model was operated on the domain shown in Fig. 1 at a standard longitude–latitude projection with a horizontal resolution of 0.22 and 0.19◦, respectively (of the order of ∼ 22 km). The domain is composed by 424 × 250 grid points and 40 vertical levels. All simulations have been performed for the period of 21 February 2011 to 31 Au-gust 2011. The model is initialised with zero dust concentra-tions. The 1-week period from 21 to 28 February has been used as a spin-up period for building dust concentrations within the domain and has not been taken into account for the model assessment. The model was forced into its initial and boundary conditions by the ERA-Interim (ERA-I) reanalysis of the European Centre for Medium-Range Weather Fore-casts (Dee et al., 2011). Boundary conditions and sea surface temperature were updated every 6 h.
The WRF model has been previously shown to realisti-cally simulate the West African monsoon and heat low dy-namics during spring and summer (Flaounas et al., 2011; Klein et al., 2015). Here, we use the Grell three-dimensional (3-D) ensemble scheme for convection (Grell and Devenyi, 2002), the WRF single moment five microphysics scheme (Hong et al., 2004) and the Yonsei University planetary boundary layer parametrisation (Hong et al., 2006). In this study we nudged wind, temperature and water vapour at each grid point to the ERA-I reanalysis, except within the bound-ary layer. Grid nudging has been previously shown to con-tribute to the realistic reproduction of a severe dust event over India (Kumar et al., 2014), as well as to the atmospheric cir-culation in seasonal simulations (Lo et al., 2008). The grid nudging coefficient we used is 6 × 10⁻⁴s−1. Comparison of 10 m wind speed between our nudged simulations, a simu-lation where no nudging was applied and SYNOP (surface synoptic) observations showed that nudging clearly improves the model 10 m wind speed. In particular, it was found that applying nudging reduces the model 10 m wind speed abso-lute bias over North Africa by approximately 35 %, while it also allows for a better subjective agreement between the ob-served and modelled synoptic-scale patterns associated with dust transport. Furthermore, in long simulations of more than a few days, nudging is beneficial in reducing uncertainties in the atmospheric circulation due to the model internal vari-ability. Our choice to nudge is thus based on achieving
realis-Figure 1. Fraction of erodible surface after Ginoux et al. (2001). Boxes depict the three sub-regions of North Africa (NA), Arabian Peninsula (AP) and the eastern Mediterranean (MED). Numbers represent the locations of AERONET stations used in this study and black bullets show the locations of airplane retrievals of the vertical profiles of extinction coefficients. The AERONET stations are (1) Zouerate, (2) Tamanrasset, (3) Oujda, (4) Solar Village, (5) Lampedusa and (6) Crete.
tic seasonal atmospheric circulation over the domain, which is particularly important to dust emissions. Since nudging in-troduces additional tendencies to the model for wind, tem-perature and water vapour, it would affect our results only if we compared simulations that treat dust direct and indirect effects. However, here dust is treated as a passive tracer.
2.2 Model chemistry component and sensitivity tests
The chemistry component of the WRF model is used in dust-only mode, where the model takes into account dust uptakes from the soil – the only source of particulate matter – and transports it as a passive tracer within the simulation do-main, treating explicitly gravitational settling, vertical mix-ing and wet removal due to convective and large-scale precip-itation. Consequently, all simulations present identical mete-orological conditions and atmospheric circulations, i.e. unaf-fected by dust direct or indirect effects. Three dust emission schemes are considered that output dust emissions for five size bins with effective radii of 0.73, 1.2, 2.4, 4.8 and 8 µm. In all schemes, the areas where dust can potentially be emit-ted are defined by the erodibility field, used here as a spa-tial dataset of 1◦×1◦ resolution in longitude and latitude. This field was defined by Ginoux et al. (2001; Fig. 1) aim-ing to account for the variable amounts of sediment available in topographic depressions. The erodibility field has values between 0 and 1, expressing the probability of accumulated
sediments to lie in a given location. The following dust emis-sion schemes have been tested:
a. The first scheme is based on an empirical formulation developed by Gillette and Passi (1988) and is incorpo-rated in WRF-Chem within the GOCART model (Gi-noux et al., 2001). In this scheme (GOCART in the fol-lowing), the dust mass flux from the surface to the first model atmospheric level scales with the third power of 10 m wind speed, multiplied by the surface erodibil-ity (as defined by Ginoux et al., 2001) and the mass fraction of each size class. In accordance with Ginoux et al. (2001), mass fraction is set to be equal to 0.1 for emitted dust of effective radius 0.73 µm, suggesting that clay (particle size smaller than 1 µm) corresponds to 10 % of the total silt mass. For the other four bins, considered to be silt (effective radii larger than 1 µm), it is assumed that the mass fractions are equally dis-tributed and are 0.25 each. Dust emissions are activated as soon as 10 m wind speed exceeds a threshold value. This threshold is calculated for dry soil based on a for-mulation derived by Marticorena and Bergametti (1995) and is then adjusted according to soil moisture.
b. The second dust emission scheme is the parametrisa-tion developed by Marticorena and Bergametti (1995), incorporated in WRF-Chem in the Air Force Weather Agency dust module (AFWA hereafter). The scheme parametrises dust emission caused by saltation bom-bardment and the vertical dust emission flux is propor-tional to the horizontal saltation flux, calculated when friction velocity exceeds a threshold. For dry soil, the threshold is the same as that used in GOCART emis-sion scheme, but a different soil moisture correction is used in the AFWA scheme. The horizontal saltation flux is obtained using a modification of the expression pro-posed by White (1979). The proportionality between dust emission and saltation flux was empirically re-lated to soil clay content by Marticorena and Bergametti (1995). Dust emissions in AFWA are also scaled with the erodibility field from Ginoux et al. (2001) and dis-tributed into size bins according to the mass fraction, derived by Kok (2011).
c. The third emission scheme is that developed by Shao (2004) implemented in the University of Cologne (UoC hereafter) dust module package. The scheme ac-counts for the emission mechanisms of saltation bom-bardment and aggregate disintegration and relates dust emission to the volume removal by saltating particles. In the scheme of Shao (2004), vertical dust emission flux is also proportional to horizontal saltation flux, but the proportionality depends on soil texture and soil plas-tic pressure. The scheme of Shao (2004) was originally implemented using four particle-size bins, but was mod-ified to have size bins consistent with those used in
the other parametrisations. Required land-surface input datasets for the scheme are soil type and vegetation cover. In contrast to GOCART and AFWA, the UoC scheme uses the erodible area by Ginoux et al. (2001) only to define areas of potential dust emission; i.e. dust emissions are calculated only at grid points where erodi-bility is non-zero. In contrast to the other two schemes tested in this study, the calculated dust emissions are not scaled with the erodibility function.
For each dust emission scheme, we perform four simula-tions where the dust emissions are multiplied by four dif-ferent coefficients in order to increase or decrease the dust fluxes in the atmosphere. The erodibility field is used by the GOCART and the AFWA schemes as a scaling factor to dust emissions, meaning that emissions – parametrised as a func-tion of atmospheric and soil physical properties – are scaled in each grid point with different values between 0 and 1. For these schemes the application of a tuning coefficient could be interpreted as a uniform decrease or increase of the erodi-bility field. More generally, the tuning coefficients applied here aim at scaling the modelled dust emissions to be more realistic and would ideally – for all three schemes – compen-sate for any boundary conditions or processes that affect dust emission, but are not accounted for in the model. Preliminary tests showed that a coefficient equal to 1 for AFWA and GO-CART resulted in disproportionally high AOD values over North Africa compared to the scheme of UoC. Consequently, we chose coefficients to be different for the four simulations when using the UoC scheme. Table 1 presents a summary of the 12 performed simulations set-up.
2.3 Observations and comparison approach
To compare modelled AOD with observations, we use the MODIS AOD observations at 550 nm from the Terra and Aqua satellites, corresponding to version 6 of daily gridded data in 1◦×1◦ grid spacing in longitude and latitude, provided by the Goddard Earth Sciences Data and Information Services Center (MOD08 D3 and MYD08 D3, combined dark target and deep blue, gio-vanni.sci.gsfc.nasa.gov/giovanni). Aqua and Terra satellites provide worldwide daily observations, having a 2330 km swath and crossing the Equator at 01:30 p.m. and 10:30 a.m. local time (LT), respectively. Retrieval of MODIS aerosol data is performed by different algorithms (e.g. Hsu et al., 2004; Remer et al., 2005) according to the underlying sur-face type. The accuracy of the AOD retrievals has been eval-uated both on a global and regional scale, against AERONET sun photometer measurements (e.g. Levy et al., 2010; Sayer et al., 2013). From the MODIS database, we have also used measurements of Ångström Exponent (AE) over land (470–660 nm; MOD/MYD 08_D3_051), over ocean (550– 865 nm; MOD/MYD 08_D3_051) and over deserts (412– 470 nm; MOD/MYD 08_D3_6), as well as the absorption aerosol index (AI), taken from OMI-Aura (Ozone
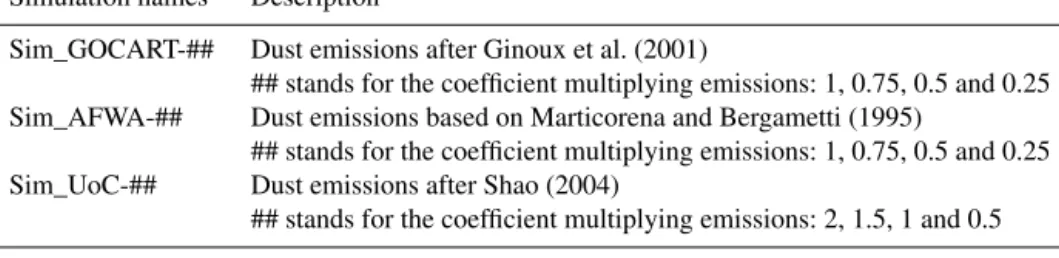
Moni-Table 1. Simulations description.
Simulation names Description
Sim_GOCART-## Dust emissions after Ginoux et al. (2001)
## stands for the coefficient multiplying emissions: 1, 0.75, 0.5 and 0.25 Sim_AFWA-## Dust emissions based on Marticorena and Bergametti (1995)
## stands for the coefficient multiplying emissions: 1, 0.75, 0.5 and 0.25 Sim_UoC-## Dust emissions after Shao (2004)
## stands for the coefficient multiplying emissions: 2, 1.5, 1 and 0.5
toring Instrument) measurements (Torres et al., 2007). Fol-lowing the same approach as in Flaounas et al. (2015), the MODIS AOD dataset was filtered so that model evaluation is performed only for grid points and days that dust is present. For this reason, we took into account only AOD values when AE is lower than 0.7 and AI is greater than 1. Finally, we also use ground observations of AOD, taken by AERONET. In contrast to satellite observations, AERONET observations offer the advantage of continuous, high temporal-resolution measurements in the daytime over a given location where satellite coverage might not be always available.
The major sources of dust are located in North Africa and in the Arabian Peninsula (Sect. 1). We focus on these regions in order to validate the modelled dust emissions. A second focus is on the eastern Mediterranean in order to validate the model capacity in realistically reproducing the dust trans-port over this region. These three sub-regions are depicted by boxes in Fig. 1. Six AERONET stations have been chosen so that their locations are representative of the sub-regions of interest and their observations are available during the simu-lation period (Fig. 1).
The quality of MODIS observations has been investigated in the different regions of interest. For this reason, MODIS and AERONET observations were compared for the whole 6-month period of the simulations (March–August 2011). Deep blue AODs have been evaluated over Africa and the Arabian Peninsula using the four AERONET stations of Zouerate, Tamanrasset, Oujda and Solar Village, while MODIS dark target AODs have been evaluated over the Mediterranean us-ing the two AERONET stations of Lampedusa and Crete. Results showed a good agreement between AODs in the Mediterranean region (i.e. dark target vs. AERONET) with high correlations (0.84 for Crete and 0.95 for Lampedusa), low root mean square errors (RMSEs; 0.05 for both stations) and low absolute bias (0.04 for both stations). On the other hand, the comparison between deep blue and AERONET AODs exhibits correlations ranging from 0.39 (Oujda) to 0.83 (Tamanrasset), RMSEs between 0.26 (Zouerate) and 0.55 (Oujda) and biases between 0.19 (Zouerate) and 0.26 (Oujda). These numbers indicate better agreement between dark target AODs and AERONET AODs. Consistently with our analysis, the additional systematic bias of AOD linked to the use of deep blue products may be of the order of ∼ 0.18
(on average for the four stations in Africa and in the Middle East).
Finally, airborne measurements of the lidar-derived extinc-tion coefficient acquired over the western Sahara during the Fennec campaign are used to evaluate the vertical profiles of modelled dust. During the Fennec campaign, the SAFIRE (Service des Avions Français Instrumentés pour la Recherche en Environnement) Falcon 20 was equipped with the LEAN-DRE Nouvelle Génération (LNG) backscatter lidar (Bruneau et al., 2015). The profiles of atmospheric extinction coef-ficient at 532 nm were retrieved using a standard lidar in-version method that employs a backscatter-to-extinction ra-tio of 0.0205 sr−1(see Schepanski et al., 2013, for details). At this wavelength, the lidar signal is mostly sensitive to aerosols with radii ranging from 0.1 to 5 µm, and hence to dust aerosols. Furthermore, over the African continent, close to the sources, desert dust particles are generally considered to be hydrophobic (e.g. Fan et al., 2004). Therefore, extinc-tion associated with desert dust is generally considered to be a good proxy for dust concentration in the atmosphere. The retrievals have an estimated uncertainty of 15 %, a res-olution of 2 km in the horizontal and 15 m in the vertical. Lidar-derived extinction coefficient profiles were averaged over 30 min (∼ 350 km) along levelled legs performed by the Falcon 20 during five flights on 14, 15, 20, 21 and 22 June (see Ryder et al., 2015 for flight tracks). This was done to extract the main characteristics of the dust layers over the Sahara (vertical extent, magnitude of extinction) in an inte-grative approach more adapted to a comparison with model outputs, which generally do not reproduce the high-spatial variability observed with lidars. The locations of the aver-aged vertical profiles are shown as black dots in Fig. 1. The lidar-derived extinction coefficient profiles are compared to their simulated counterparts averaged over the same leg and extracted at the model output time closest to the time when the lidar profiles were acquired.
3 Comparison of simulation results to observations 3.1 Model assessment in the simulation domain
The seasons of spring and summer are expected to have the highest dust emission activity in the broader region
includ-ing North Africa, the Middle East and the Mediterranean (Moulin et al., 1997b). Figure 2 shows the average dust AOD as retrieved by MODIS for the whole 6-month period of spring and summer 2011. Over North Africa, the higher AOD values are observed along the 15◦N latitudinal belt, at the climatological location of the inter-tropical disconti-nuity frontal area between the monsoon and the Harmattan wind. The highest AODs are observed downstream of the Bodélé depression. High dust AODs are also located over the northern part of the Arabian Peninsula and are related to the Shamal winds continuously blowing over dust sources, linked to the alluvial plains of Syria, Iraq and western Iran. Large AOD values are also observed to be associated with emissions from the Aral Sea sediment basin, east of the Caspian Sea. The mean AOD values of spring and summer are dramatically lower over the Mediterranean region where dust sources are limited.
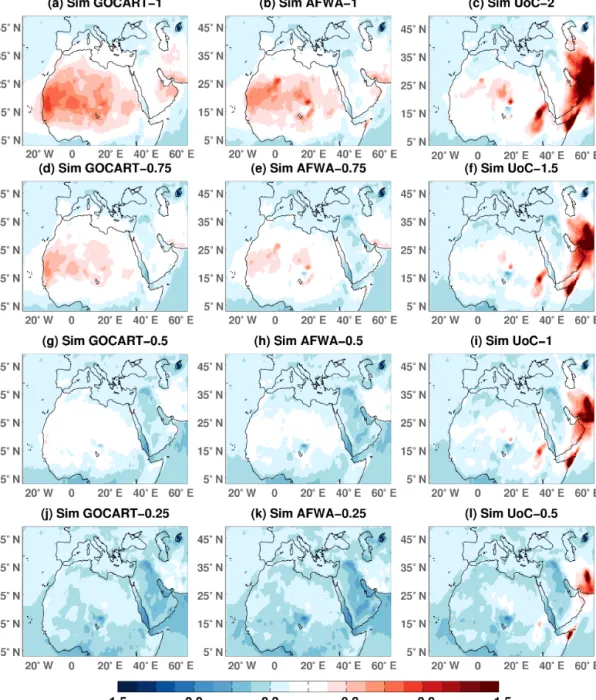
The AOD differences between the WRF-Chem simula-tions and the MODIS estimasimula-tions (as shown in Fig. 2) are presented in Fig. 3. To be consistent with the Equator cross-ing time difference between Aqua and Terra, we compare AOD from MODIS with model outputs at 12:00 UTC. Differ-ences correspond to the AOD 6-month averages, taking into account only the days and grid points when MODIS provides measurements. As expected, in all simulations, the AOD bias changes over the whole region with the dust flux coeffi-cient. In Sim_GOCART-1 and Sim_GOCART-0.75 (Fig. 3a and d), the AOD is largely overestimated over North Africa while when applying a coefficient of 0.5, the model seems to be in better agreement with the MODIS observations (Fig. 3g). On the other hand, the modelled AOD over the Mediterranean Sea seems to be closer to the observations in Sim_GOCART-1 and Sim_GOCART-0.75, while the model overestimates AOD over North Africa. In the Arabian Penin-sula, Sim_GOCART-1 tends to overestimate AOD over the south-eastern part of the region, compared to the AOD over the northern side. This is consistent with the higher fraction of erodible surface in the south of the Arabian Peninsula, as shown in Fig. 1. Sim_GOCART-0.75 also appears to produce the most realistic AODs in that region. It is noteworthy that all the GOCART simulations underestimate the AOD in the vicinity of the Euphrates and Tigris rivers basin.
Similar results are obtained using the AFWA scheme. Over North Africa, the AOD is overestimated for the larger tuning coefficients (Fig. 3b and c), with a smaller bias over the Mediterranean. The UoC scheme shows similar of smaller biases for most areas in North Africa throughout all UoC simulations, with Sim_UoC-1.5 having the smallest bias. However, the UoC scheme produces substantial AOD overestimations for particular regions in the eastern part of the simulation domain, namely for three hot spots located in southern Iran, close to the Sistan region, in the northern part of the horn of Africa and in the eastern part of central Africa. These are areas that have a small fraction of erodible surface according to the estimate from Ginoux et al. (2001)
Figure 2. MODIS AOD observations within the simulation domain, averaged for the whole 6-month period, i.e. 1 March to 31 Au-gust 2011.
(compare Fig. 1); thus, emissions produced with the GO-CART and AFWA schemes are already significantly reduced through multiplication with this fraction (Sect. 2.1). It can-not be ruled out that similar overestimations would occur for the GOCART and AFWA schemes without this second scaling. Overall, the lower tuning coefficients provide a gen-eral underestimation of AOD over the whole simulation do-main, regardless the dust emission parametrisation (Fig. 3j– l). In addition to the emission schemes themselves, the model bias over the dust source regions might be also related to the quality of observations, where MODIS uncertainties over North Africa and Middle East might be of the order of ∼ 0.18 (Sect. 2.3).
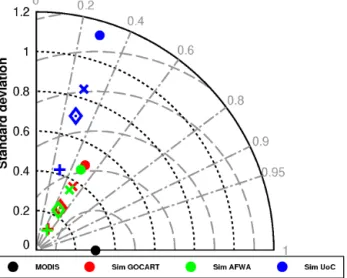
In order to quantify the WRF-Chem model skill in repro-ducing the 6-month average AOD in all simulations, Fig. 4 presents the spatial Taylor diagram (Taylor, 2001) that com-pares MODIS observations (as presented in Fig. 2) to the simulation outputs. In the Taylor diagrams, the centred root mean square error (RMSE; in abscissa) provides a measure of the model total AOD differences from the observations within the entire domain, while the SD (in ordinate) and cor-relation provide a measure of the models skill to reproduce the AOD spatial variability. Figure 4 shows that simulations using GOCART and AFWA present a correlation coefficient of the order of 0.5, while in simulations using UoC corre-lation coefficient is about 0.3. Figure 3 suggests that this is likely related to the substantial AOD overestimation in the eastern part of the model domain (see also Fig. 7). The GO-CART and AFWA simulations perform similarly in repro-ducing the seasonal spatial variability of dust concentrations. On the other hand, the RMSEs and SDs strongly depend on the applied tuning coefficients. In fact, Sim_GOCART-0.25, Sim_AFWA-0.25 and Sim_UoC-0.5 seem to present SDs, which are closer to MODIS, as well as the lowest RMSE.
Al-Figure 3. Differences between the modelled and observed AOD, averaged over the 6-month period. Note that different coefficients are applied for simulations using UoC compared to the ones using GOCART and AFWA.
though these three simulations underestimate the AOD com-pared to MODIS (see Fig. 3j–l), their overall bias, averaged over the whole domain, is smaller than in the simulations using larger tuning coefficients as for instance Sim_AFWA-0.75, Sim_GOCART-0.75 and Sim_UoC-1.5 (Fig. 3d–f, re-spectively). Small and moderate tuning coefficients limit the simulated hot spots of high dust concentrations and thus the model SD is closer to the observations.
Figure 3 shows that the average spatial AOD patterns pro-duced by the AFWA and GOCART schemes are similar and differ from those obtained using the UoC scheme. A main
reason for this is the scaling of the calculated dust emis-sion fluxes with estimated values for surface erodibility in the AFWA and GOCART implementations. Such empiri-cal tuning is common and necessary in particular for (semi-)empirical parametrisations that do not explicitly describe the physical processes of dust emission at the surface. Physics-based parametrisations, such as the UoC implementation, aim to represent the physics of dust emission and, if all pro-cesses were accounted for, would not need empirical tuning. However, dust emission is a complex process including as-pects that are not yet accounted for in the parametrisations
Figure 4. Taylor diagram comparing the 6-month AOD average of all simulations with MODIS observations for the region illus-trated in Fig. 2. Root mean square error lines (grey-dashed cir-cular lines) and SDs (blacked dotted lines) are plotted with an interval of 0.2, while correlation coefficients are shown by the grey radii lines. Symbols in red stand for Sims_GOCART, in green for Sims_AFWA and in blue for Sims_UoC. The black dot stands for MODIS, dots (.) for Sim_GOCART-1, 1 and Sim_UoC-2, (X) for Sim_GOCART-0.75, Sim_AFWA-0.75 and Sim_UoC-1.5, Diamond (3) for Sim_GOCART-0.5, Sim_AFWA-0.5 and Sim_UoC-1, cross (+) for Sim_GOCART-0.25, Sim_AFWA-0.25 and Sim_UoC-0.5.
because they are not yet fully understood and because model resolution limits the spatial representation of land-surface properties. Such aspects include, but are not limited to, sur-face crusting, particle supply and intermittency. The spatial variability of model performance, both with and without tun-ing with constant coefficients, can thus likely be attributed to spatially and temporally varying accuracy of the model lower boundary conditions that are either constant, e.g. soil type, or follow a climatological cycle, e.g. vegetation cover. Surface crusting significantly affects dust emissions, but is to date not represented in any model. Meteorological processes that occur on sub-grid scales in the model, e.g. dry and moist convection, provide another source of uncertainty that can lead to model–observation biases. A conclusive determina-tion of the origins of model over- and underestimadetermina-tions of AOD for the different areas is beyond the scope of this paper. However, an assessment of the tuning required for a particu-lar parametrisation to produce reasonable results can help to determine reasons for model–observation discrepancies.
3.2 Model assessment on regional scale
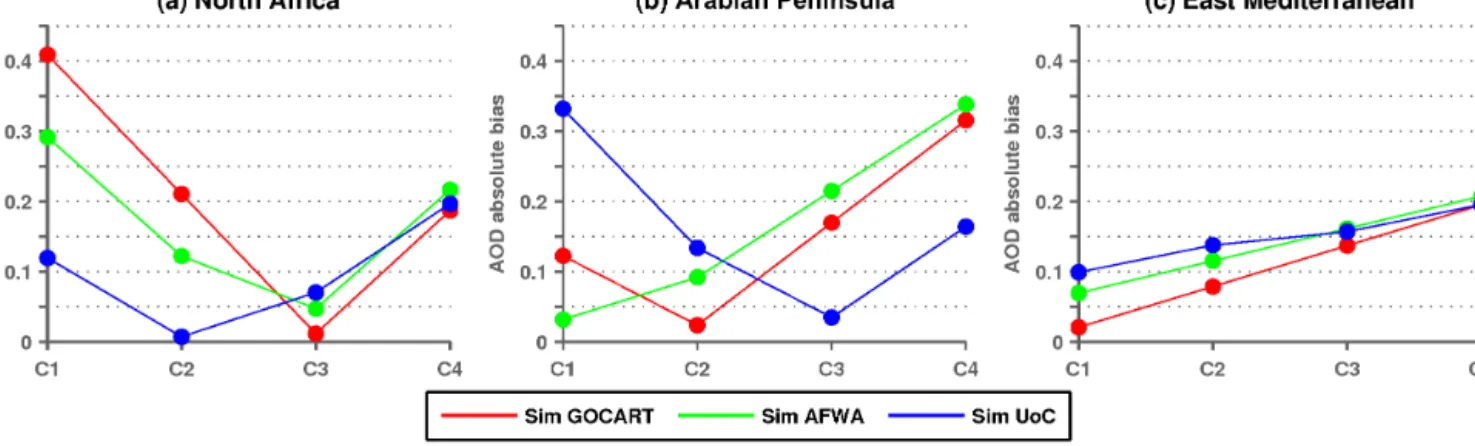
In order to evaluate the model skill in reproducing the AOD on regional scales, we focus on three sub-domains, outlined in Fig. 1a. For each simulation, Fig. 5 shows the average absolute bias of modelled AOD with respect to MODIS-derived AOD within each sub-domain and for the whole 6-month simulation period. For each dust emission parametri-sation, there is a coefficient that corresponds to a minimum absolute bias for each sub-domain. Note that the eastern Mediterranean is not specified as a dust source in the model (Fig. 1); hence, coefficients impact on dust in the Mediter-ranean through increase/decrease of dust emission and sub-sequent transport in other areas. As discussed in the previous section, all three simulation sets provide smaller biases over the eastern Mediterranean domain when the tuning coeffi-cients are large (Fig. 5c). On the other hand, smaller tuning coefficients seem to be more adequate for the North African domain. Indeed, Sim_GOCART-0.5 and Sim_AFWA-0.5 re-sult in smaller biases for the African domain (Fig. 5a), while Sim_GOCART-1 and Sim_AFWA-1 tend to produce smaller biases for the eastern Mediterranean. Sim_UoC-1.5 achieves a minimum absolute bias over the North African domain (Fig. 5a), while Sim_UoC-2 yields the minimum absolute bias for the eastern Mediterranean domain (Fig. 5c). Regard-less of the dust emission parametrisation, the North African domain and the Arabian Peninsula do not share the same tun-ing coefficients for minimistun-ing absolute errors even though they are both regions with major dust sources. Indeed, Fig. 5b shows that larger tuning coefficients in GOCART and AFWA (Sim_GOCART-0.75 and Sim-AFWA-1) tend to reproduce smaller biases in the Arabian Peninsula. There is an opposite behaviour of the simulation results obtained with UoC. In fact, Sim_UoC-1.5 produces a smaller bias for North Africa, while Sim_UoC-1 (no tuning) yields a better performance for the Arabian Peninsula. Such a different behaviour between the schemes might be attributed to the different treatment of the potential dust source areas. Overall, the use of coeffi-cients in order to tune the modelled dust emissions is shown to reduce or increase the model absolute bias of AOD over the chosen regions of interest, namely North Africa, the Ara-bian Peninsula and the eastern Mediterranean. The optimal coefficient to minimise the regional AOD absolute bias is not the same for all regions.
To gain further insight into the capacity of WRF-Chem to reproduce the regional AOD, Fig. 6 shows time series of the daily evolution of AOD from WRF-Chem and MODIS, aver-aged over each of the three domains and Fig. 7 shows Taylor diagrams that statistically assess the model using the time se-ries as shown in Fig. 6. For Africa, both model and MODIS show a strong overall variation in the domain averaged AOD, with few distinct peaks during the investigation period. All simulations qualitatively capture the timing of most periods with increased AOD; however, the double peak in late June and early July is not well reproduced by the parametrisations.
Figure 5. Average absolute bias between the simulations and MODIS observations for the whole 6-month period and for the three sub-domains, depicted in Fig. 1. The x axis values of C1, C2, C3 and C4 correspond to the coefficients applied for each simulation set. C1 equals 1, 1 and 2 for Sims_GOCART, Sims_AFWA and Sims_UoC, respectively. C2 equals 0.75, 0.75 and 1.5; C3 equals 0.5, 0.5 and 1; and C4 equals 0.25, 0.25 and 0.5.
Figure 6. Time series of the daily averaged AOD for the simulations and MODIS for the whole 6-month period, averaged over the three sub-domains depicted in Fig. 1.
In fact, Sims_AFWA show slightly better correlations com-pared to Sims_GOCART and Sims_UoC, suggesting that the simulations using AFWA applies better to North Africa for the given model set-up (for the given domain, resolution etc.). A similar result is obtained for the Arabian peninsula domain shown in Fig. 6b, except that Sims-UoC strongly overestimate dust emissions starting from July onward. Cor-relation coefficients are also slightly higher for Sims_AFWA for the Arabian Peninsula than for the two other simulation sets. When comparing the simulations in their standard set-up (tuning coefficient equals to 1), the UoC scheme achieves the smallest RMSE and SDs that are closest to MODIS for North Africa and the Mediterranean, while for the Ara-bian Peninsula AFWA and GOCART have smaller (approxi-mately equal) RMSE with GOCART producing the best SD. For the eastern Mediterranean, Fig. 6c shows that the MODIS AOD observations present an average AOD back-ground value of the order of 0.2, while several peaks are representative of major dust transport events (as for instance
on 1 May 2011; Fig. 6c). Since the atmospheric circulation is identical in all simulations and nudged to the ERA-I re-analysis, the model realistically captures the time of the dust transport events, as reflected by the high correlation coeffi-cient of about 0.7 for all simulations (Fig. 7c). On the other hand, if no dust transport takes place (as for instance dur-ing the second half of June 2011 in Fig. 6c) the WRF-Chem model AOD values are close to zero (Fig. 6c). Consequently, regardless of the dust emission scheme, the model fails to re-alistically reproduce the background dust concentration over the Mediterranean. It is thus plausible to suggest that if no major dust transport event takes place in the region, the model excessively removes dust from the atmosphere over the Mediterranean and/or that other aerosol sources are not captured by the model. Given that our motivation is to as-sess the WRF-Chem performance especially in reproducing dust transport over the eastern Mediterranean, in Fig. 8 we provide an example of the model performance in simulat-ing a dust episode that took place on 23 July of 2011. The
Figure 7. Taylor diagram comparing time series of AOD for all simulations to the MODIS observations as shown in Fig. 6. Root mean square error lines are plotted with a 0.1 interval. Symbol annotations are the same as in Fig. 4.
model is compared to AOD from the AERUS-GEO product, which only had few missing values for this date compared to MODIS. AERUS-GEO is derived by observations of the Meteosat Second Generation Spinning Enhanced Visible and Infra-Red Imager (MSG/SEVIRI; Carrer et al., 2014). Ob-servations clearly show high AOD values, ranging from 0.5 to 1, that extend from the African coast towards the central Mediterranean Sea, between Sicily and Greece (Fig. 8a). Fig-ure 8b–d show the simulations performance using a tuning coefficient of 1 which yielded better results for the eastern Mediterranean (Fig. 5). The modelled AODs vary between the simulations, with the GOCART and the AFWA schemes yielding higher values compared to the UoC scheme. Both GOCART and AFWA simulations seem to produce simi-lar spatial patterns of the dust transport episode and AODs. Since meteorology is identical to all three simulations, the similarity is caused by the AFWA and GOCART emission schemes. Indeed, the same tuning coefficients lead to a simi-lar AOD bias (e.g. Fig. 3) and fairly close correlation coeffi-cients (e.g. Figs. 4 and 7). A plausible explanation is that both schemes share the same parametrisation for dry soil threshold friction velocity and that both simulations use soil erodibil-ity to scale dust emission fluxes. Despite their differences, all simulations successfully captured the dust transport event, as a meso-scale tongue of high AOD values. In the next section we focus on smaller scales in order to assess the model per-formance in reproducing finer spatial features of dust events. 3.3 Model assessment at the local scale
AOD observations acquired from AERONET stations allow one to assess the skills of WRF-Chem in reproducing the AOD on local scale. Figure 9 shows the model simulated time series of AOD, interpolated at the locations of the six AERONET stations shown in Fig. 1. For the statistical as-sessment of WRF-Chem at the locations of the AERONET stations, we show the Taylor diagrams corresponding to the time series of Fig. 9, in Fig. 10. In North Africa, all simula-tions capture the increase of AOD in Zouerate after 15 June
(Fig. 9a), i.e. during the period of installation of the Saha-ran heat low (Todd et al., 2013) over the central Sahara af-ter the African monsoon onset took place (Cornforth et al., 2012). All simulations show equal correlation coefficients of about 0.7 regardless of the tuning coefficients applied to the dust emissions (Fig. 10a). In agreement with the model re-sults over the entire North African domain (Figs. 6a and 7a), simulations with tuning coefficients smaller than 1 tend to result in smaller RMSEs and SDs, which are close to the ob-servations. The modelled AODs at Tamanrasset and Oujda are also in good agreement with the AERONET observations (Fig. 9b and c). While at Oujda all simulations present equal correlation coefficients (Fig. 10c) as in Zouerate (but with a correlation of 0.4), the correlations at Tamanrasset depend on the dust emission parametrisation (Fig. 10b). This is due to the fact that in Tamanrasset, dust-related AODs depend on both long-range transport from remote North and East African sources and local emissions (Cuesta et al., 2008). Simulations using GOCART show larger correlations than the simulations using AFWA and UoC, suggesting a more realistic daily variability of dust concentrations over this site. At the Solar Village in the Arabian Peninsula, larger cor-relation coefficients (∼ 0.6) are obtained for the simulations using GOCART. All simulations tend to underestimate the SD and have RMSEs of more than 0.3 (Fig. 10d). Indeed, all simulations seem to underestimate the average AOD during the 6-month period (Fig. 9d). In consistency with the model results at Tamanrasset, the GOCART simulations at the So-lar Village present better correlations than both AFWA and UoC. It is rather difficult to explain the reasons for this con-sistency in the model performance. However, it seems that in both cases, convection may be largely connected with dust outbreaks (Guirado et al., 2014; Houssos et al., 2015).
For the Mediterranean, we compare the AERONET sta-tion observasta-tions in Crete and Lampedusa with the model re-sults. All simulations were able to reproduce the major dust transport events corresponding to the peaks in AOD (Fig. 9e and f). This is also reflected by correlation coefficients of the order of 0.6 (Crete) and 0.7 (Lampedusa) for all
simula-Figure 8. AOD over the eastern Mediterranean in 23 July as estimated by the AERUS-GEO product and as simulated by WRF-Chem using default dust emission parametrisations where no tuning coefficients are applied.
tions, as shown in Fig. 10f and e, respectively. It is notewor-thy that the model assessment in capturing dust transport on local scales is a delicate issue. For instance, the event shown in Fig. 8a seems to affect Lampedusa but has a limited im-pact on Crete. Indeed, Fig. 9e shows that the AERONET sta-tion captures a rise of AOD values during late July, while in Crete there is no such trend in the observations. In contrast, all simulations in Fig. 8 seem to extend the dust transport to more eastern locations (Fig. 8b–d) and hence when com-pared to AERONET over Crete they overestimate AOD in late July (Fig. 9f). Despite the high correlation coefficients, all simulations underestimate the background dust concen-tration at these stations. Indeed, all simulations show AOD values close to zero except when dust transport events take place (Fig. 9e and f). On the other hand, AERONET observa-tions from both Crete and Lampedusa present values close to 0.2, consistent with the MODIS average regional AOD val-ues shown in Fig. 6c.
3.4 Model assessment of the vertical distribution of dust over the Sahara
To gain further insight in the model’s capacity to repro-duce dust uptake and transport, Fig. 11 shows the vertical profiles of the lidar-derived extinction coefficients from five flights between 14 and 22 June 2011, as well as the corre-sponding values obtained with WRF-Chem. Airborne mea-surements have been taken over northern Mauritania and northern Mali, in the vicinity of major dust sources (Fig. 1). We present only Sim_GOCART-0.5, Sim_AFWA-0.5 and
Sim_UoC-1.5, which have the smallest biases over these lo-cations among all simulations (Fig. 3). Comparing model to observations in only five cases may not be enough to be used as a token of the model performance. On the other hand, Fig. 11 offers an insight into the model capacity to realisti-cally reproduce the vertical variability of dust concentration. Results are highly variable depending on the flight. In Fig. 11a, all experiments seem to capture the vertical pro-file shape with a decrease of dust concentrations with in-creasing height, and a sharp decrease in extinction around 5 km a.m.s.l., marking the top of the Saharan atmospheric boundary layer (SABL). Nevertheless, the model seems to overestimate the total AOD due to excessive dust concentra-tion throughout the atmospheric column. The lidar-derived extinction profile acquired on 14 June is representative of the low dust concentration over northern Mauritania and north-ern Mali when the westnorth-ern Sahara was under the influence of cold air masses from the Atlantic (Todd et al., 2013). In sub-sequent flights, lidar profiles were acquired while the west-ern Sahara was under the influence of the approaching Saha-ran heat low as well as strong low-level north-easterly wind surges from the Mediterranean (Todd et al., 2013). The wind surges were responsible for enhanced emissions in the west-ern Sahara and for the large AODs observed in Zouerate dur-ing the second half of June (Fig. 9a). As for Fig. 11a, the ob-servations in Fig. 11b show that dust concentrations tend to decrease with height, large extinction coefficient values be-ing observed near the surface as the result of dust emissions. The SABL corresponds to a deep layer (∼ 6 km a.g.l. in summer), which tends to be fully mixed no earlier than
Figure 9. Time series of AOD for the simulations and AERONET observations during the whole 6-month period. AERONET station locations are shown in Fig. 1.
around 18:00 LT. In the daytime, the SABL is composed of a convective mixing layer developing within a residual layer so that lidar and dropsonde data acquired around mid-day generally exhibit a two-layer structure (Ryder et al., 2015; Chaboureau et al., 2016). Dust concentrations within the lower half part of the SABL are representative of local emissions while the upper part is dominated by dust trans-port (Chaboureau et al., 2016). During the Saharan heat low phase, i.e. on 15, 20, 21 and 22 June, lidar data evidence essentially a two-layer structure in the SABL, with a deep well-mixed upper layer (above 1–1.5 km a.m.s.l., Fig. 11b–f) and a lower atmospheric layer of enhanced extinction (below 1–1.5 km a.m.s.l.). The model fails to capture the observed high extinctions in the lower layer, but has a fairly good per-formance at reproducing the structure of the SABL as well
as the magnitude of the extinction coefficients derived from lidar. The extinctions in the upper part of the SABL are as-sociated with the long-range transport of dust from remote north and easterly sources, a process that is well captured by the model. On the other hand, extinctions in the lower layers are related to small-scale processes that are not cap-tured by the simulations owing to the relatively coarse mesh size of the model (i.e. 22 km). A striking example of that is shown in Fig. 11d, where the low-level extinction values were observed to be the largest during the Fennec campaign. They were caused by the cold pool of a convective system having developed overnight over the Atlas Mountains, which then propagated south-westward over the Sahara (Todd et al., 2013; Ryder et al., 2015; Chaboureau et al., 2016) and was sampled by the lidar. The development of the convective
Figure 10. Taylor diagram comparing time series of AOD for all simulations to the AERONET station observations as shown in Fig. 9. Root mean square error lines are plotted with a 0.1 interval. Symbol annotations are the same as in Fig. 4.
Figure 11. Extinction coefficient vertical profiles from the airborne lidar observations (black solid line) and from the WRF-Chem simulations (see legend for colours). The AOD values corresponding to the profiles are shown within the five panels. Error bar lengths equal twice the SDs of the lidar measurements at a given altitude.
system over the Atlas and the related cold pool can only be captured by convection permitting models as shown by Chaboureau et al. (2016) with mesh size of the order of 5 km or less. Except maybe for the 21 June case, under the par-ticular circumstances detailed above, the Sim_GOCART-0.5 simulation always exhibits the largest extinction coefficients in the SABL. For most flights, the simulated extinction pro-files were seen to lie within the observed values if we account for the natural variability sampled by lidar along the Falcon legs.
4 Discussion
4.1 On the relation between dust concentration and AOD
Overall, the results of the model comparison against obser-vations showed that the modelled spatial and temporal vari-ability in AOD is rather insensitive to the coefficient ap-plied to the dust emissions. In fact, all simulations using the same dust emission scheme tend to present the same correla-tion coefficients when compared to observacorrela-tions, whether we consider local scales or the entire domain. This was expected as the applied tuning coefficients homogeneously scale the modelled dust emissions throughout the domain. In terms of the AOD level in the eastern Mediterranean, the model failed to reproduce the regional background value (of the order of 0.2). This was shown over the regional domain in Fig. 6, as well as in the local AERONET stations of Crete and Lampedusa (Fig. 9). However, the model showed good skill in capturing the dust transport events. Indeed, the mod-elled AOD time series over the eastern Mediterranean pre-sented a large correlation coefficient of 0.7, when compared to the MODIS observations (Fig. 7c). Model comparison with AERONET presents some limitations. While the model calculates only dust-related AOD, the AERONET measure-ments may be also representative of other particulate matter (e.g. sea salt). To gain more confidence in that the 0.2 value of AOD background in AERONET is due to dust, we com-pared the MODIS AOD retrievals with the AERONET mea-surements. MODIS measurements have been filtered using the criteria AE < 0.7 and AI > 1 in order to be representa-tive of dust and have been interpolated to the locations of the AERONET stations at Lampedusa and Crete. The AOD me-dian from MODIS (∼ 0.2) at these locations has indeed been found to be close to the AERONET median.
Our results derived from AOD observations compare rea-sonably well to model outputs. However, the AOD reflects the dust load within the atmosphere and provides no infor-mation on the vertical distribution of dust concentration. Fig-ure 12 shows the near-ground average dust concentration (i.e. the dust concentration at the first model level) during the whole 6-month period for each simulation. The three simulations using the larger coefficients (Fig. 12a–c) show
average dust concentrations over North Africa, which ex-ceed 1200 µg m−3in some areas. No PM10observations were
available for performing a long-term direct comparison with the model simulations; however, the near-ground modelled dust concentrations seem to be excessively overestimated, especially for GOCART and AFWA by default simulations (Sim_GOCART-1 and Sim_AFWA-1). Indeed, PM10
obser-vations along the Sahel (along ∼ 14◦N) are typically less than 100 µg m−3in spring and summer (Marticorena et al., 2010). In addition, the comparison of the order of mag-nitude of modelled dust concentrations with measurements at specific stations in the Mediterranean (Pey et al., 2013) shows that the model tends to produce dust concentrations that are 1 order of magnitude larger than observations dur-ing episodes of dust transport over the Mediterranean (not shown). Consequently, relatively small coefficients (such as the ones used at Sim_GOCART-0.25, Sim_AFWA-0.25 and Sim_UoC-0.5) seem to be more adequate for the proper rep-resentation of dust concentration over the African continent and for dust transport into the Mediterranean. On the other hand, our results in Fig. 3 suggest that these simulations lack a realistic representation of AOD within the whole simulation domain. In order to achieve overall realistic values of AOD, the WRF-Chem model configurations assessed here produce very large dust-surface concentrations. Consequently, there is a counteracting effect on the model’s performance between modelled AOD and dust concentration. More realistic values of AOD would demand unrealistically high dust concentra-tions and a realistic model reproduction of dust concentration yields too small AOD values.
On local scale, vertical profiles of extinction coefficients obtained from aircraft measurements can be used as a proxy for the vertical profile of dust concentration. Our results in Fig. 11 show that even with different dust emission parametrisations, simulations tend to reproduce similar pro-files, i.e. extinction coefficient profiles decreasing with in-creasing height. AOD is a convenient field for assessing chemistry transport models since simulations may be com-pared to observations from a network of ground stations and satellites. On the other hand, these observations might pro-vide misleading results on the model performance. Indeed, due to compensating biases in the upper and lower part of the SABL (overestimation/underestimation of the extinction co-efficients above/below 1.5 km), the AOD values derived from the simulated profiles are found to be realistic. Such an ex-ample is illustrated in Fig. 11c, where Sim_GOCART-0.5 ac-curately reproduces the observed AOD. These compensating biases were also highlighted by Chaboureau et al. (2016), even for higher-resolution simulations performed with con-vection permitting models. Here we presented only five pro-files of extinction coefficient, but averaged over several hun-dreds of kilometres along the flight legs to average observed outliers, which are thought to be fairly indicative of the model capacity in reproducing vertical profiles of dust con-centration.
Figure 12. Near ground dust concentrations for all simulations, averaged over the 6-month period.
4.2 On the model sensitivity to dust bins size and mass fraction
The effective radii of the dust particles considered by WRF-Chem, mostly refer to coarse particles of more than 1 µm. However, dust transport over the Mediterranean is also re-lated to smaller particles (Polymenakou et al., 2008). In ad-dition, the dust aerosol extinction efficiency is expected to be maximum for dust particles of sizes around 0.5 µm, which are not taken into account by the 5-bin parametrisations in WRF-Chem. To investigate the potential of improving the model performance in reproducing both realistic AOD and near-ground dust concentrations, we implemented eight
dust-size bins in WRF, following Basart et al. (2012). Two addi-tional sensitivity tests have been performed using only the dust emission parametrisation of GOCART and eight dust-size bins with effective radii 0.15, 0.25, 0.45, 0.78, 1.3, 2.2, 3.8 and 7.1 µm.
Changing the size and number of the GOCART dust bins also requires to attribute to each dust bin its fraction from the total emitted dust mass. In consistency with Ginoux et al. (2001), we considered that the first four size bins corre-spond to clay and hence to the 10 % of the total emitted mass of silt. Therefore, in our first sensitivity test (EXP1), we set the mass fraction for each of the first four size bins to 0.025
and for the other four size bins (corresponding to silt) to 0.25. Equal mass fractions per bin within the same dust-size class seems, however, to be unrealistic. To address this issue, in our second sensitivity test we applied the distribution func-tion of Kok (2011), similar to the AFWA parametrisafunc-tion. Figure 13 presents the mass fraction of the eight size bins for EXP1 and EXP2, as well as for Sims_GOCART. For all sim-ulations a tuning coefficient of 0.5 has been applied. In order to assess the model sensitivity to changes in the number, radii and mass fraction of the dust bins, our results from the addi-tional sensitivity tests are compared to Sim_GOCART-0.5.
Figure 14 shows EXP1 and EXP2 average difference in near-ground dust concentration from Sim_GOCART-0.5 (Fig. 14a and b), as well as their AOD difference from MODIS (Fig. 14c and d). Results show that dust concen-trations in EXP1 are overestimated all over the dust source areas, with respect to Sim_GOCART-0.5. On the other hand, EXP2 overestimates dust emissions mostly in north-western Africa. It is also noteworthy that in both EXP1 and EXP2, higher dust concentrations are transported to the Mediter-ranean. Consequently, the AOD bias between MODIS obser-vations and EXP1 and EXP2 are significantly different than between MODIS and Sim_GOCART-0.5 (Fig. 3h). How-ever, by repeating a statistical assessment of EXP1 and EXP2 against MODIS observations (as in Fig. 4), we found quasi-equal spatial correlations. SD and centred RMSE varied ac-cording to the simulation (not shown). Regardless of the changes in dust bin radii, number and mass fraction, our re-sults for EXP1 and EXP2 seem to have equivalent rere-sults as if tuning dust emissions with different coefficients. However, when comparing the vertical profiles of extinction coefficient between the simulations EXP1 and EXP2 with the other sim-ulations (Fig. 11), differences are observed at higher alti-tudes. For instance, in Fig. 11a the sharp decrease of dust concentration in EXP1 and EXP2 takes place at around 5.5 km with respect to 5 km in the other simulations. In fact, the addition of finer dust sizes suggests a lower rate of sed-imentation and therefore differences to the in-column trans-port of dust. Here, we followed the GOCART assumption of equal silt mass fraction but we also took into consideration a more realistic mass fraction distribution from Kok (2011). It would be interesting to adjust the dust bins mass fraction distribution per region; however, this is a rather challenging issue due to the lack of systematic observations over North Africa.
5 Summary and conclusion
In this study, we assessed the WRF-Chem model capacity to realistically reproduce the dust AOD over the broader region of northern Africa, the Middle East and the Mediterranean for the 6-month period from spring to summer 2011. We per-formed three sets of simulations, each using a different dust emission parametrisation. For each simulation set we
mul-Figure 13. Dust bins mass fraction for EXP1, EXP2 and Sim_GOCART-0.5.
tiplied different tuning coefficients to the parametrised dust emission fluxes, aiming at minimising the model’s AOD bias in different regions. Our approach resided in comparing the model results to AOD observations across different temporal and spatial scales, using satellite, ground-based and airborne observations.
The meteorological conditions and atmospheric circula-tion were identical in all simulacircula-tions. Therefore, all differ-ences in AOD originated from the different dust emission parametrisations. When compared to AOD observations, the assessment of the simulations showed that regardless of the coefficient used, the model produces similar correlation co-efficients for the simulations that use the same dust emis-sion scheme. Consequently, tuning the emisemis-sions by a coeffi-cient resulted only in reduced or increased AOD model bias. When considering regional or time averaged model outputs, all three different parametrisations that we tested seemed to present quasi-equal correlation coefficients with the obser-vations. However, when comparing model outputs to local stations, in four out of six stations (Tamanrraset, Lampedusa, Crete and Solar village), the simulations using GOCART and AFWA presented slightly larger correlation coefficients than UoC. In its default implementation (i.e. using a tuning coeffi-cient of 1), the simulation using UoC showed smaller RMSEs for four out of the six stations than those using GOCART or AFWA. Comparing the model to airplane observations – and given its spatial resolution – the model shows a fairly good skill in reproducing the vertical profiles of extinction coeffi-cients over north-western Africa. Overall, the GOCART and AFWA simulations presented similar dust emissions with re-spect to UoC simulations.
The motivation of this study is to determine an adequate model set-up in order to properly reproduce dust concentra-tions over the eastern Mediterranean. Therefore, a
simula-Figure 14. (a) Simulated near-ground dust concentration differences between EXP1 and Sim_GOCART-0.5, averaged over the 6-month period. (b) As in panel (a) but for EXP2. (c) AOD differences between EXP1 and MODIS observations, averaged over the 6-month period. (d) As in panel (c) but for EXP2.
tion presenting the smallest bias and largest correlation co-efficient would be the most adequate choice. However, our results show that there is no optimal model set-up that could minimise bias simultaneously in all three regions of interest. Consequently, the simulations with low coefficients of the order of 0.5 seem to provide a reasonable trade-off choice in order to properly reproduce major dust transport events over the eastern Mediterranean, as well as realistic levels of AOD over the desert belt of North Africa and the Arabian Penin-sula.
Empirical tuning of dust emissions has no physical ba-sis and corresponds to a model adjustment that is valid for the specific model set-up (e.g. grid spacing, number of ver-tical levels, physical parametrisation). In fact, applying tun-ing only modifies linearly the model performance. Optimisa-tion of dust emissions would demand modificaOptimisa-tions of the parametrisation (e.g. change the thresholds of surface and friction wind speeds) or the relevant surface fields (e.g. soil erodibility). Such modifications focus on modelling assump-tions and thus provide a more physics-oriented optimisation of the model performance. Given the differences in the phys-ical assumptions of the dust schemes, such sensitivity tests could only focus however on specific parametrisations yield-ing non-linear effects on the results.
Future work will be concentrated to further test the model sensitivity to realistically reproduce dust transport events us-ing both eight dust size bins and finer model resolutions. Furthermore, we will concentrate on the climatology of dust transport over the Mediterranean by performing long-term simulations also aiming at investigating the aerosols direct and indirect effect.
Code availability. The code used in this study is included in the chemistry package of the WRF model, currently available through the WRF download web page: http://www2.mmm.ucar.edu/wrf/ users/download/get_source.html. The 8-bin integration to the model is available upon request to the corresponding author.
Competing interests. The authors declare that they have no conflict of interest.
Acknowledgements. This publication was supported by the European Union Seventh Framework Programme (FP7-REGPOT-2012–2013-1), in the framework of the project BEYOND, under grant agreement no. 316210 (BEYOND-Building Capacity for a Centre of Excellence for EO-based monitoring of Natural Disasters). The authors are grateful to NASA for providing the AERONET and MODIS datasets, as well as to the PIs and
associated teams for the datasets maintenance and availability. Analyses and visualisations used in this study were produced with the Giovanni online data system, developed and maintained by the NASA GES DISC. Airborne data were obtained during the FENNEC campaign using the Falcon 20 Environment Research Aircraft operated and managed by Service des Avions Français Instrumentés pour la Recherche en Environnement (SAFIRE; www.safire.fr), which is a joint entity of CNRS, Météo-France and CNES. The Fennec-France project was funded the Agence Nationale de la Recherche (ANR 2010 BLAN 606 01), the Institut National des Sciences de l’Univers (INSU/CNRS) through the LEFE program, the Centre National d’Etudes Spatiales (CNES) through the TOSCA program, and Météo-France. Finally, we are thankful to METEO-FRANCE/CNRM/ICARE for making available the data from MSG/SEVIRI AERUSGEO through the ICARE Data Center (http://www.icare.univ-lille1.fr/).
Edited by: Samuel Remy
Reviewed by: two anonymous referees
References
Alpert, P., Kishcha, P., Shtivelman, A., Krichak, S. O., and Joseph, J. H.: Vertical distribution of Saharan dust based on 2.5 year model predictions, Atmos. Res., 70, 109–130, 2004. Basart, S., Pérez, C., Nickovic, S., Cuevas, E., and
Bal-dasano, J.: Development and evaluation of the BSC-DREAM8b dust regional model over northern Africa, the Mediterranean and the Middle East, Tellus B, 64, 18539, https://doi.org/10.3402/tellusb.v64i0.18539, 2012.
Basart, S., Vendrell, L., and Baldasano, J. M.: High-resolution mod-elling over complex terrains in West Asia, Aeolian Res., 23, 37– 50, https://doi.org/10.1016/j.aeolia.2016.09.005, 2017.
Benedetti, A., Baldasano, J., Basart, S., Benincasa, F., Boucher, O., Brooks, M., Chen, J.-P., Colarco, P., Gong, S., Huneeus, N., Jones, L., Lu, S., Menut, L., Morcrette, J.-J., Mulcahy, J., Nickovic, S., Pérez García-Pando, C., Reid, J., Sekiyama, T., Tanaka, T., Terradellas, E., Westphal, D., Zhang, X.-Y., and Zhou, C.-H.: Operational dust prediction, in: Mineral Dust – A Key Player in the Earth Systems, edited by: Knippertz, P. and Stuut, J.-B. W., Springer, the Netherlands, 223–265, 2014. Bou Karam, D., Flamant, C., Knippertz, P., Reitebuch, O., Pelon, J.,
Chong, M., and Dabas, A.: Dust emissions over the Sahel asso-ciated with the West African monsoon intertropical discontinuity region: a representative case-study, Q. J. Roy. Meteor. Soc., 134, 621–634, 2008.
Bou Karam, D., Flamant, C., Cuesta, J., Pelon, J., and Williams, E.: Dust emission and transport associated with a Saharan depres-sion: February 2007 case, J. Geophys. Res., 115, D00H27, https://doi.org/10.1029/2009JD012390, 2010.
Bristow, C. S., HudsonEdwards, K. A., and Chappell, A.: Fertilizing the Amazon and Equatorial Atlantic with West African dust, Geophys. Res. Lett., 37, L14807, https://doi.org/10.1029/2010GL043486, 2010.
Carrer, D., Ceamanos, X., Six, B., and Roujean, J. L.: AERUSGEO: a newly available satellitederived aerosol optical depth product over Europe and Africa, Geophys. Res. Lett., 41, 7731–7738, https://doi.org/10.1002/2014GL061707, 2014.
Chaboureau, J. P., Flamant, C., Dauhut, T., Kocha, C., Lafore, J. P., Lavaysse, C., Marnas, F., Mokhtari, M., Pelon, J., Reinares Martínez, I., Schepanski, K., and Tulet, P.: Fennec dust fore-cast intercomparison over the Sahara in June 2011, Atmos. Chem. Phys., 16, 6977–6995, https://doi.org/10.5194/acp-16-6977-2016, 2016.
Chauvin, F., Roehrig, R., and Lafore, J. P.: Intraseasonal variability of the Saharan heat low and its link with midlatitudes, J. Climate, 23, 2544–2561, https://doi.org/10.1175/2010jcli3093.1, 2010. Cornforth, R.: Overview of the West African Monsoon 2011,
Weather, 67, 59–65, https://doi.org/10.1002/wea.1896, 2012. Cowie, S. M., Knippertz, P., and Marsham, J. H.: A
climatol-ogy of dust emission events from northern Africa using long-term surface observations, Atmos. Chem. Phys., 14, 8579–8597, https://doi.org/10.5194/acp-14-8579-2014, 2014.
Cuesta, J., Edouart, D., Mimouni, M., Flamant, P. H., Loth, C., Gibert, F., Marnas, F., Bouklila, A., Kharef, M., Ouch-ene, B., Kadi, M., and Flamant, C. A.: Multi-platform obser-vations of the seasonal evolution of the Saharan atmospheric boundary layer in Tamanrasset, Algeria, in the framework of the African Monsoon Multidisciplinary Analysis field cam-paign conducted in 2006, J. Geophys. Res., 113, D00C07, https://doi.org/10.1029/2007JD009417, 2008.
D’Almeida, G. A.: A model for Saharan dust transport, J. Clim. Appl. Meteorol., 25, 903–916, 1986.
Dayan, U., Heffter, J., Miller, J., and Gutman, G.: Dust intrusion events into the Mediterranean basin, J. Appl. Meteorol., 30, 1185–1199, 1991.
Dee, D. P., Uppala, S. M., Simmons, A. J., Berrisford, P., Poli, P., Kobayashi, S., Andrae, U., Balmaseda, M. A., Balsamo, G., Bauer, P., Bechtold, P., Beljaars, A. C. M., van de Berg, L., Bidlot, J., Bormann, N., Delsol, C., Dragani, R., Fuentes, M., Geer, A. J., Haimberger, L., Healy, S. B., Hersbach, H., Hólm, E. V., Isaksen, L., Kållberg, P., Köhler, M., Matricardi, M., McNally, A. P., Monge-Sanz, B. M., Morcrette, J.-J., Park, B. K., Peubey, C., de Rosnay, P., Tavolato, C., Thépaut, J.-N., and Vi-tart, F.: The ERA-Interim reanalysis: configuration and perfor-mance of the data assimilation system, Q. J. Roy. Meteor. Soc., 137, 553–597, https://doi.org/10.1002/qj.828, 2011.
Engelstaedter, S., Tegen, I., and Washington, R.: North African dust emissions and transport, Earth-Sci. Rev., 79, 73–100, 2006. Evan, A. T., Fiedler, S., Zhao, C., Menut, L., Schepanski, K.,
Fla-mant, C., and Doherty, O.: Derivation of an observation-based map of North African dust emission, Aeolian Res., 16, 153–162, 2015.
Fan, S. M., Horowitz, L. W., Levy, H., and Moxim, W. J.: Impact of air pollution on wet deposition of min-eral dust aerosols, Geophys. Res. Lett., 31, L02104, https://doi.org/10.1029/2003GL018501, 2004.
Flaounas, E., Coll, I., Armengaud, A., and Schmechtig, C.: The rep-resentation of dust transport and missing urban sources as major issues for the simulation of PM episodes in a Mediterranean area, Atmos. Chem. Phys., 9, 8091–8101, https://doi.org/10.5194/acp-9-8091-2009, 2009.
Flaounas, E., Bastin, S., and Janicot, S.: Regional climate mod-elling of the 2006 West African monsoon: sensitivity to convec-tion and planetary boundary layer parameterisaconvec-tion using WRF, Clim. Dynam., 36, 1083–1105, 2011.