HAL Id: hal-00297006
https://hal.archives-ouvertes.fr/hal-00297006
Submitted on 15 Jun 2007
HAL is a multi-disciplinary open access
archive for the deposit and dissemination of
sci-entific research documents, whether they are
pub-lished or not. The documents may come from
teaching and research institutions in France or
abroad, or from public or private research centers.
L’archive ouverte pluridisciplinaire HAL, est
destinée au dépôt et à la diffusion de documents
scientifiques de niveau recherche, publiés ou non,
émanant des établissements d’enseignement et de
recherche français ou étrangers, des laboratoires
publics ou privés.
Impacts of global change on water-related sectors and
society in a trans-boundary central European river
basin ? Part 2: from eco-hydrology to water demand
management
T. Conradt, M. Kaltofen, M. Hentschel, F. F. Hattermann, F. Wechsung
To cite this version:
T. Conradt, M. Kaltofen, M. Hentschel, F. F. Hattermann, F. Wechsung. Impacts of global change
on water-related sectors and society in a trans-boundary central European river basin ? Part 2: from
eco-hydrology to water demand management. Advances in Geosciences, European Geosciences Union,
2007, 11, pp.93-99. �hal-00297006�
www.adv-geosci.net/11/93/2007/ © Author(s) 2007. This work is licensed under a Creative Commons License.
Geosciences
Impacts of global change on water-related sectors and society in a
trans-boundary central European river basin – Part 2: from
eco-hydrology to water demand management
T. Conradt1, M. Kaltofen2, M. Hentschel2, F. F. Hattermann1, and F. Wechsung11Potsdam Institute for Climate Impact Research, P.O. Box 60 12 03, 14412 Potsdam, Germany
2Institute for Water Resources Planning and Systems Research (WASY GmbH), Waltersdorfer Strasse 105, 12526 Berlin-Bohnsdorf, Germany
Received: 29 January 2007 – Revised: 20 April 2007 – Accepted: 22 May 2007 – Published: 15 June 2007
Abstract. This second part of the paper presents the details
of the eco-hydrological model SWIM simulating the natural water supply and its coupling to WBalMo, a water manage-ment model.
Based on the climate scenarios of the STAR model, SWIM simulates the natural water and matter fluxes for the entire Elbe River area. All relevant processes are modelled for hy-drotopes and the resulting discharges are accumulated in sub-basins. The output data are input for the water management model WBalMo and the quality models Moneris and QSim.
WBalMo takes storage management, inputs and with-drawals into account and analyses how demands by industry, power plants and households will be met at changing natural supply conditions. Some of the first results shall be presented here.
1 Introduction
A realistic modelling of water amounts and fluxes is of cru-cial importance for any conclusion concerning impacts of changes in water availability. To answer a question like “How many percent of the output of a certain power plant will presumably have to be cut down in August 2030 due to lack of cooling water?” a modeller needs to know
– the climate change till that year on a regional scale, – the hydrological boundary conditions like soil profiles,
land use, or groundwater recharge coefficients and their interactions, and
– the water management options like reservoir balance
plans or distribution policies.
Correspondence to: F. F. Hattermann
(fred.hattermann@pik-potsdam.de)
Each of these input variables may contribute uncertainty to the final answer, and hence it is important to include as much knowledge as possible. Comparably important is the choice of appropriate models which not only decides the validity of process representation but also implicitly determines input data quality by model requirements.
One of the objectives of the GLOWA Elbe project is to make statements on water supply problems not only for a sin-gle month or user but for hundreds of users distributed over the whole Elbe River basin for the next 45 years. The models in charge for the detailed hydrological and water manage-ment modelling, SWIM and WBalMo, are capable of pro-viding reliable water availabilty scenarios in a high spatial resolution.
In the following section, the methodology of SWIM is pre-sented in detail. SWIM calculates the “natural” water fluxes as if there were no dams or transitions, although accelerated runoff from sealed (urban) surfaces or the effects of open cast mining areas are considered.
WBalMo takes the SWIM output data to include manage-ment policies, artificial inputs and withdrawals and computes probabilities of meeting the demands separately for all users in the data base. Section 3 explains the details of the statis-tical analysis and presents some preliminary results for se-lected users.
2 SWIM
2.1 Model set up
SWIM (Soil and Water Integrated Model) was derived from the SWAT (Soil and Water Assessment Tool) model, cf. Arnold et al. (1998); Krysanova et al. (2005). SWIM is a semi-distributed model simulating water fluxes, plant growth, and nutrient cycles based on hydrotopes, areas with uniform land use, soil type, and weather conditions.
94 T. Conradt et al.: Part 2: from eco-hydrology to water demand management
ydrotope determination by overlay (left) and processes
Land cover Land use Climate: Radiation, Temperature & Precipitation
Biomass Roots L A I Plant growth Nitrate cycle Phosphorous cyc.
N-NO3 No-ac No-st Nres
Plab Pm-ac Pm-st P org Pres B C B o d e n p ro fi l A Water cycle Shallow groundwater B C S o il p ro fi le A (Krysanova et al. 2000) Deep groundwater
Fig. 1. Overview of SWIM modules and the processes modelled.
The hydrotopes were practically determined by overlay of subbasin, land use and soil type maps. Data from climate sta-tions are interpolated to the subbasins, which are also used for discharge routing according to the river system. The Elbe river basin is actually being modelled with more than 45 000 hydrotopes in 2278 subbasins. For each hydrotope the processes depicted in Fig. 1 are simulated.
Daily climate data are the driving input for the hydrologi-cal part. Soil and vegetation properties, each defined by data sets associated with the respective map units, decide on the allocation of water fluxes. The nitrate and phosporous cycle are modelled simultanuously, but are neglected in the context of this SWIM application, where solely hydrological output is required.
The water fluxes are modelled stepwise, separately for each hydrotope, and based on the daily climate data input. First, air temperature decides whether precipitation enters the system in liquid form or if a snow cover has to be modelled. The amount of rainfall and soil properties decide on the share of direct runoff. Then, the water balance is modelled for each soil layer by computing infiltration and seepage fluxes to-gether with plant water uptake. Water availability, tempera-ture, and radiation govern crop and root growth which in turn decides on plant water demand. Finally, all discharge com-ponents are calculated and aggregated for each subbasin.
In a subsequent procedure, river discharges are simulated by adding and routing the single subbasin outputs according to the river system structure on the basis of the Muskingum equations.
Because changes in land use have feedbacks on the hydro-logical properties of the landscape, the results of RAUMIS
and the LandUseScanner, a prognostic tool for the generation of land use scenarios, are iteratively reused for SWIM com-putations in the form of time period related land use maps. 2.2 Calibration
Numerous measured discharge time series from 1981–1990 served as reference to eliminate systematic errors of evapo-transpiration, soil conductivity, groundwater discharges, or wave propagation which influence all subbasins. Respective global parameters were adjusted using the Newton parameter optimization algorithm provided by the free software PEST (Parameter ESTimation, Watermark Numerical Computing and S.S. Papadopulos and Associates, Inc., 2007). Finally, Nash-Sutcliffe coefficients of 0.9 could be obtained for the basin outlet gauge Neu Darchau (MQ=714 m3s−1).
As all relevant ecosystem processes shall be modelled as exactly as possible, considerable computation efforts are needed due to their complexity. Started on a single CPU (IBM Power4, 1.1 Ghz), SWIM needs approx. 15 min to sim-ulate one year.
2.3 Output of subbasin discharges for WBalMo, Moneris, and QSim
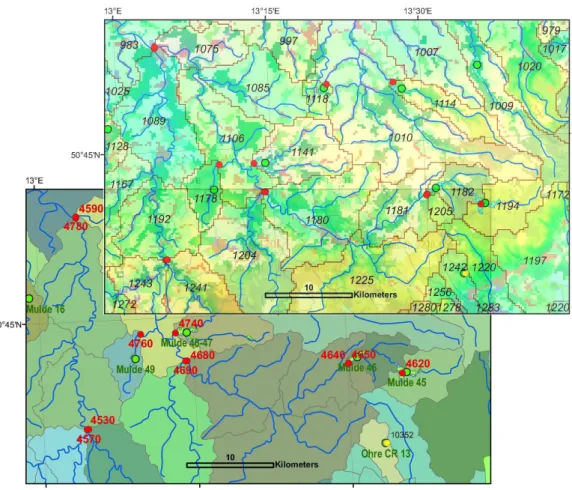
For the coupling of SWIM to the WBalMo model, the sub-basin structure of WBalMo was used without major changes. For this purpose, a raster-based GIS module translates ele-vation data in area specific river parameters. Moreover, it overlays these areas with land use and soil units to hydro-topes. Figure 2 shows in its upper part the numbered SWIM subbasins with the hydrotope structures inside.
Because the discharges are aggregated on subbasin level and routed through the subbasins, it is principally possible to obtain discharge values from each area outlet. However, in most cases WBalMo requires only that share of discharge, which accumulates below inflow area outlets (s.c. end pro-files).
Therefore, SWIM was fitted accordingly to accumulate beside the general flow dynamics also those shares of dis-charge belonging to the subbasins exclusively related to the end profiles (cf. Fig. 2, lower part). Here the flow velocity of the natural dynamics is kept despite the lower partial water quantities.
For the statistical analysis carried out by WBalMo and de-scribed below in detail, SWIM was fed with 100 realizations of future climate by the statistical downscaling model STAR (Gerstengarbe and Werner, 2005), each comprising 50 years of daily precipitation, radiation, humidity, minimum, maxi-mum, and mean temperature for 831 locations. These data were interpolated to the SWIM subbasins. For WBalMo, monthly aggregates of the required discharges were pro-vided, 60 000 values for each end profile accordingly.
Moneris is the model in charge for landscape nutrient flux modelling within the GLOWA-Elbe Project. As already
Fig. 2. upper part: Clipout of SWIM’s representation of the basin map with numbered subbasins containing hydrotopes. The red points
are positions where runoff output is made for WBalMo; at the green points precipitation and evapotranspiration output is made. lower part: The same map clipout in WBalMo’s view. The colours indicate the balance areas represented by the data transfer points which have an independent numbering system.
mentioned, the N- and P-modules of SWIM do not contribute to the modelling; only the individual subbasin discharge con-tributions are required as Moneris input. The runoff values of exemplaric years with average hydrologic conditions are delivered on monthly basis for all 2278 subbasins, separated into surface, intermediate and groundwater component.
Finally, QSim takes daily SWIM outputs of the accumu-lated discharge in the main channel of the Elbe River. The model simulates in-stream chemistry and biology focusing on algae growth and nutrient exhaustion.
3 WBalMo
3.1 Principles of modelling long term water availability and management
Long term planning of water management takes into consid-eration the balance between water yield and water use, su-perimposed by water management. Usually long term water management is analysed over planning periods of a number
of decades. Over this time span the spatio-temporal distribu-tion of water yield, i.e. discharges and their driving hydro-meteorological processes, has to be regarded as a random process.
The user demands, on the other hand, are deterministic in time and space from the planner’s point of view. For each time step of the investigated planning horizon and each cross section of the river network in the planning area the water use has to be provided by fixed or varying values or by demand functions. It has to be considered that water demand often depends on:
– time,
– meteorological conditions, and – socio-economic development.
Goals of water management are, for example, covering the water needs of the users (as municipal water supply, power plants, industry), maintaining minimum discharges
96 T. Conradt et al.: Part 2: from eco-hydrology to water demand management
Table 1. Number and kind of model objects in WBalMo Elbe.
WBalMo modules BP CM R DYN WU WET
Elbe main stream 60 35 2 13 73
Eger (CR) 96 63 16 25 218 Lower Vltava (CR) 33 33 9 9 36 Upper Vltava (CR) 28 24 5 8 42 Berounka (CR) 31 31 8 5 40 Upper/Middle Elbe(CR) 91 60 14 12 185 Spree-Schwarze Elster 170 120 15 86 336 x Wetland Spreewald 168 24 0 61 132 x Mulde 195 83 15 32 296 Saale 44 25 5 11 152 Bode 35 18 6 12 55 Weiße Elster 59 35 9 8 84 Wetland Dr¨omling 72 18 0 16 89 x Havel 192 75 8 33 172 x Wetland Rhin 139 14 0 36 113 Berlin 56 21 0 18 146 x Nuthe 70 19 0 15 88 x Buckau 25 11 0 11 27 x Plane 42 10 0 16 49 x Gr. Havell¨and. Kanal 43 15 0 11 43 Dosse-J¨aglitz 61 16 2 22 63 x Lower Elbe 188 82 0 22 148 x Total 1898 832 114 482 2587
(for ecological reasons, but also for navigation), and effec-tive protection against floods.
Starting from these key points the methodology of stochas-tic long-term management has been developed, mainly for areas characterized by a large demand for water and small available water resources. The used stochastic management models divide the management problem into three parts:
1. stochastic simulation of meteorological and hydrologi-cal processes,
2. deterministic simulation of water use processes and wa-ter management, and
3. recording of relevant system states.
If the simulation is passed over sufficiently long periods, a statistical analysis of the recorded system states will give satisfactory approximations to the probability distributions sought, for reservoir levels and discharges for certain water-balance profiles, or safety margins for water provision, for example.
Based on that, the quality of a selected management strat-egy can be assessed for the investigated river basin and a gradual improvement of this strategy, i.e. the operation of dams, can then be achieved with well-aimed scenario analy-sis.
3.2 Characteristics of the water management model
WBalMo Elbe
Stochastic simulation of meteorological and hydrological processes was described above in Sect. 2. The simulation of the water use processes and water management as well as recording of relevant system states is performed by WBalMo simulation software. It is based on the general methodology described above. The most recent simulation system, used in GLOWA Elbe, is known as WBalMo 3.1 with the possibil-ity to model even very large river basins over 100 000 km2 (Kaden et al., 2004).
Using this simulation software a water management model for the whole Elbe river basin was developed, called WBalMo Elbe. The whole model is divided into 22 modules, mainly for Elbe tributaries and major wetlands. Table 1 sum-marizes their characteristics and the WBalMo Elbe model in total. Each of the modules can be used separately. Modules are defined by the balance profiles (BP), set along the water-courses, the catchments (CM) connected to them, water users (WU), and reservoirs (R).
Water management rules not covered by standard model features are programmed within so called dynamic elements (DYN). High regard is given to wetlands as an import wa-ter user (WET). For details about modelling wawa-ter budget of wetlands see Dietrich et al. (1996).
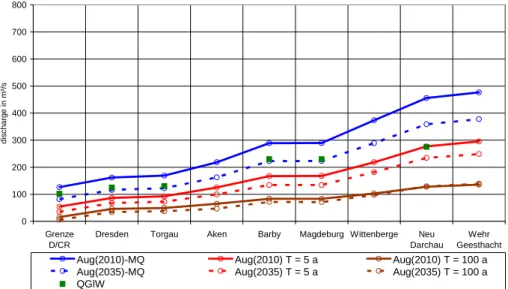
0 100 200 300 400 500 600 700 800 Grenze D/CR
Dresden Torgau Aken Barby Magdeburg Wittenberge Neu Darchau Wehr Geesthacht d is c h a rg e i n m ³/ s
Aug(2010)-MQ Aug(2010) T = 5 a Aug(2010) T = 100 a Aug(2035)-MQ Aug(2035) T = 5 a Aug(2035) T = 100 a QGlW
Fig. 3. Longitudinal profile of different discharge values along the Elbe river for the month August compared with according minimum
required flow for effective navigation QGlW.
3.3 Preliminary results of long term water availability and management
Water use conflicts exist in the Elbe main river first of all be-tween a given discharge and a minimum required flow, e.g. for effective navigation. In the tributaries the conflict arises between a given discharge and the demand for a certain with-drawal. Because of this, the water use conflict in the main river is analyzed with the help of an longitudinal profile of discharges and minimum required flows, while in the tribu-taries water demand and water supply is directly compared. For each of these water uses the main questions concerning water availability are:
– What is the extent of the water use conflict under various
degrees of drought in the near future?
– How will the water use conflict develop over the whole
simulation horizon?
Using statistical analysis of the recorded system states WBalMo Elbe calculates the supplied water on various sever-ities of water shortage as values of different annual return periods. This means that after each of these long-term av-erage number of years the amount of water supply or the discharge will fall below or will at maximum be equal the given value. This analysis can be performed on every period of interest. For each of the periods the calculated values base upon 500 years long time series, provided by SWIM.
In the following graphics for the analysis of the water use conflict the dry month August and return periods of 5, 20 and 100 years at time period 2010 have been chosen. The temporal development of the conflict is shown until 2050 for the return interval of 5 years or for the time period 2035 in comparison to 2010 and the same return intervals.
The results concerning discharges at the main river are shown in Fig. 3, beginning from border inflow to the Elbe weir Geesthacht. The figure contains longitudinal profiles of August, time periods 2010 and 2035. The different pro-files refer to: minimum required flow for effective navigation QGlW, average monthly discharges and discharges with re-turn intervals of 5 and 100 years. Comparing the required for navigation flow values with the calculated indicators one can say that the requirements can be met only in flow conditions equal or better than average ones.
In cases of more severe drought situations (increasing re-turn interval) the water use conflict is present. With devel-oping climate change the water use conflict will get worse, comparing time periods 2010 and 2035.
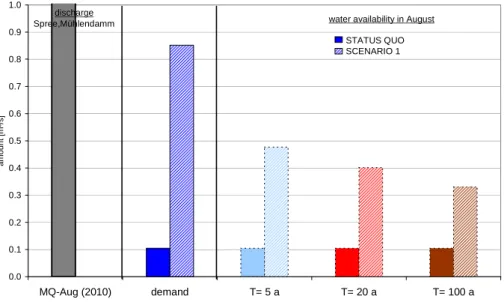
An example for a water use in the tributary Havel is shown in Fig. 4. The figure illustrates water demand and water sup-ply for two scenarios: “STATUS QUO” is based on the val-ues given by the water authority; “SCENARIO 1” assumes more environmental oriented development. The difference of water demand between these scenarios is caused by the different approach to consider the danger of “overwarming” of the river by released cooling water. In the Status-Quo-scenario the low demand values in summer already take into account the restricted amount of water, possible to release back into the river after use for cooling because of increased water temperature.
In “SCENARIO 1”, these demand estimates are replaced by the value, calculated by a demand function. This func-tion returns the demand required for energy producfunc-tion and the actual withdrawal, considering water temperature. This withdrawal is used for calculating the water resources bal-ance. It is obvious that a water use conflict between demand of cooling water for energy production and the withdrawals,
98 T. Conradt et al.: Part 2: from eco-hydrology to water demand management 0.0 0.1 0.2 0.3 0.4 0.5 0.6 0.7 0.8 0.9 1.0 MQ-Aug (2010) demand T= 5 a T= 20 a T= 100 a a m o u n t [m ³/ s ] discharge
Spree,Mühlendamm water availability in August
STATUS QUO SCENARIO 1
Fig. 4. Water demand and supply of power plant Berlin Mitte.
0.0 0.5 1.0 1.5 2.0 2.5 3.0 3.5 4.0 2010 2015 2020 2025 2030 2035 2040 2045 2050 a m ount [m ³/s ] STATUS QUO
Fig. 5. Development of water use conflict for water work Wienrode
at return period T =5 a (demand: 3.36 m3s−1).
possible from both aspects of water temperature and water availability, really takes place. Under hot summer conditions the water supply for the power plant has to be reduced for ecological reasons in order to avoid an overwarming of the river. Consequently, the energy production has to be reduced. The development of the water use conflict for that kind of water uses (withdrawals) is shown in Fig. 5. In this ex-ample the amount of water, provided by the reservoir Rapp-bode / Bode (Harz mountains, Saale catchment), is signifi-cantly decreasing with developing climate warming, while demand stays at the level of 3.36 m3s−1. At a return interval
of 5 years the water supply is shortened to less than one third of the demand, comparing time periods 2010 and 2050.
Other possible results from WBalMo Elbe are the evapora-tion from surface water bodies totalised per sub-catchments, the increase of water use of wetlands for controlled drainage and sub-irrigation systems, the failure frequency of one or of a group of reservoirs and other indicators.
4 Summary and conclusions
Capabilities of water balance models like WBalMo can be extended to investgations with regard to climate and socioe-conomic changes. Therefore a semi-distributed ecohydrolog-ical model like SWIM has to be used. This model gives the opportunity to reflect impact of changes in climate and land use on the stream flows. The latter are then used to balance water yield and water demand. First results for Elbe River catchments show various degrees of concern and vulnera-bility to climate change. Because of the fact that GLOWA Elbe is a running project, please look at www.glowa-elbe.de for further results, including the Czech part of the Elbe river catchment.
Acknowledgements. The authors would like to thank their
col-leagues H. Apel and C. Hesse who reviewed the text for their support and B. Orlowsky for providing the climate data.
Edited by: K.-E. Lindenschmidt Reviewed by: H. Apel and C. Hesse
References
Arnold, J., Srinivasan, R., Muttiah, R., and Williams, J.: Rainfall-runoff modelling for assessing impacts of climate and land-use change, J. Am. Water Resour. As., 34, 73–89, 1998.
Dietrich, O., Dannowski, R., and Quast, J.: GIS-based water bal-ance analyses for fen wetlands, in: International Conference on Application of Geographic Information Systems in Hydrology and Water Resources Management, HydroGIS’96, Vienna, Aus-tria, Vol. of Poster Papers, pp. 83–90, 1996.
Gerstengarbe, F. and Werner, P.: Simulationsergebnisse des re-gionalen Klimamodells STAR, in: GLOWA-Elbe I – Integrierte Analyse der Auswirkungen des globalen Wandels auf Wasser,
Umwelt und Gesellschaft im Elbegebiet, edited by: Wechsung, F., Becker, A., and Gr¨afe, P., Potsdam Institute for Climate Im-pact Research, Potsdam, Germany, Vol. 95 of PIK report, ISSN 1436-0179, pp. 110–118, 2005.
Kaden, S., Schramm, M., and Redetzky, M.: ArcGRM: Interactive simulation system for water resources planning and management in river basins, in: Research Basins and Hydrological Planning, edited by: Xi, R.-Z., Gu, W.-Z., and Seiler, K.-P., Taylor & Fran-cis, London, UK, ISBN 90-5809-611-4, pp. 185–192, 2004.
Krysanova, V., Hattermann, F., and Wechung, F.: Development of the ecohydrological model SWIM for regional impact studies and vulnerability assessment, Hydrol. Processes, 19, 763–783, 2005.
Watermark Numerical Computing and S.S. Papadopulos and As-sociates, Inc.: PEST online resource, http://www.sspa.com/pest/ index.htm, current user manual by Doherty, J., 5th ed., 336 pp., 2004, UNIX PEST version 11.2, 2007.