HAL Id: hal-00123927
https://hal.archives-ouvertes.fr/hal-00123927
Submitted on 5 Aug 2020HAL is a multi-disciplinary open access archive for the deposit and dissemination of sci-entific research documents, whether they are pub-lished or not. The documents may come from teaching and research institutions in France or abroad, or from public or private research centers.
L’archive ouverte pluridisciplinaire HAL, est destinée au dépôt et à la diffusion de documents scientifiques de niveau recherche, publiés ou non, émanant des établissements d’enseignement et de recherche français ou étrangers, des laboratoires publics ou privés.
Validation of MIPAS CH4 profiles by stratospheric
balloon, aircraft and ground based measurements.
C. Camy-Peyret, Sébastien Payan, G. Dufour, H. Oelhaf, G. Wetzel, G.
Stiller, N. Glatthor, Th. Blumenstock, C. Blom, C. Keim, et al.
To cite this version:
C. Camy-Peyret, Sébastien Payan, G. Dufour, H. Oelhaf, G. Wetzel, et al.. Validation of MIPAS CH4 profiles by stratospheric balloon, aircraft and ground based measurements.. Proceedings of the Second Workshop on the Atmospheric Chemistry Validation of ENVISAT (ACVE-2), May 2004, Frascati, Italy. �hal-00123927�
VALIDATION OF MIPAS CH
4PROFILES BY STRATOSPHERIC BALLOON,
AIRCRAFT, SATELLITE AND GROUND BASED MEASUREMENTS
C. Camy-Peyret(1), S. Payan(1), G. Dufour(1), H. Oelhaf(2), G. Wetzel(2), G. Stiller(2), N. Glatthor(2),
Th. Blumenstock(2), C.E. Blom(2), C. Keim(2), S. Mikuteit(2), A. Engel(3), M. Pirre(4),G. Moreau(4), V. Catoire(4),
A. Bracher(5), M. Weber(5), K. Bramstedt(5)
(1) Laboratoire de Physique Moléculaire et Applications (LPMA), Université Pierre et Marie Curie, case 76, 4 place
Jussieu, 75252 Paris Cedex 05, France, [email protected]
(2) Forschungszentrum Karlsruhe (IMK-FZK), Institut für Meteorologie und Klimaforschung, Germany,
(3) Institut für Meteorologie und Geophysik, J.W. Goethe Universität, Frankfurt, Germany,
(4) Laboratoire de Chimie Physique de l’Environnement (LPCE-CNRS), Orléans, France, [email protected] (5) Institute of Environmental Physics (IUP), University of Bremen, Bremen, Germany, [email protected]
ABSTRACT/RESUME
The ENVISAT validation programme for the atmospheric instruments MIPAS, SCIAMACHY and GOMOS included a number of balloon-borne, aircraft, other satellite and ground-based correlative measurements. In particular the activities of validation scientists were coordinated by ESA within the ENVISAT Stratospheric Aircraft and Balloon Campaign or ESABC. In parallel to the contribution of the individual validation teams, the present paper provides a synthesis of comparisons made between MIPAS CH4 profiles
produced by the current ESA operational software (Instrument Processing Facility version 4.61 i.e. IPF v4.61) or by the IMK-FZK scientific processor and correlative measurements obtained from balloon and aircraft experiments as well as from satellite sensors or from ground-based instruments.
1. INTRODUCTION
As recommended by ESA, validation results presented and discussed during the second Atmospheric
Chemistry Validation of ENVISAT (ACVE-2) workshop in May 2004 at ESRIN, Frascati had to be compared with products generated by the latest version of the operational processing software. For the MIPAS CH4 profiles discussed here, the corresponding products
were generated by the Instrument Processor Facility or IPF v4.61, but due to the late release and/or incomplete space/time coverage of the corresponding validation dataset, several correlative measurements had to be compared with non-official products. Fortunately, methane profiles generated by the IMK-FZK scientific processor have been provided to several validation teams for comparing their own correlative measurements with MIPAS derived profiles. This is specially true for 2003 validation campaigns for which the ESA IPF v4.61 products were not yet available by the time of ACVE-2. The correlative measurements for MIPAS CH4 profiles
considered here (see Table 1) have been obtained by balloon experiments (section 2) and by aircraft experiments (section 3) participating in the ENVISAT Stratospheric Aircraft and Balloon Campaign (ESABC) coordinated by P. Wursteisen [1].
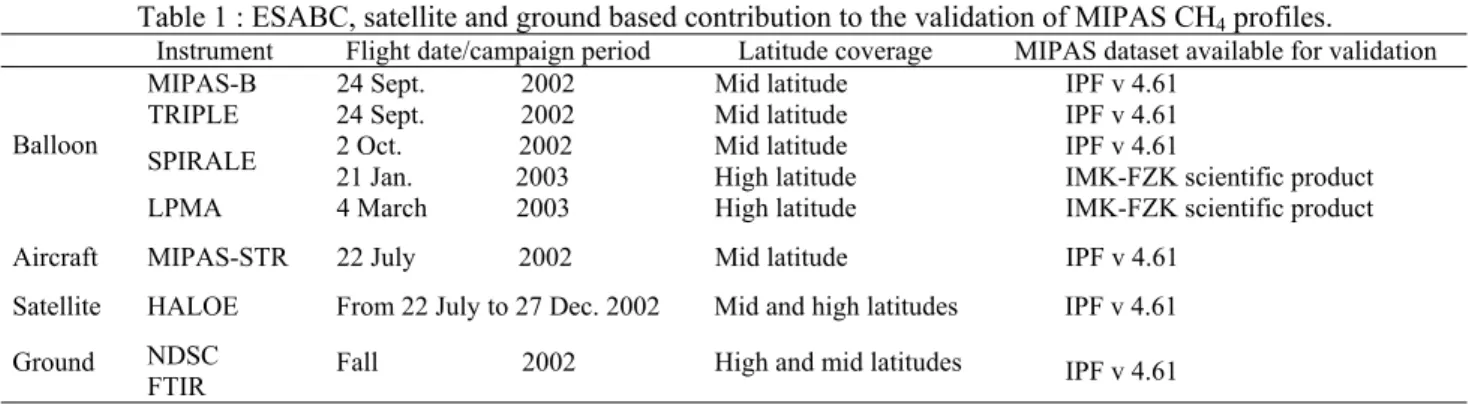
Table 1 : ESABC, satellite and ground based contribution to the validation of MIPAS CH4 profiles.
Instrument Flight date/campaign period Latitude coverage MIPAS dataset available for validation
MIPAS-B 24 Sept. 2002 Mid latitude IPF v 4.61
TRIPLE 24 Sept. 2002 Mid latitude IPF v 4.61
2 Oct. 2002 Mid latitude IPF v 4.61
SPIRALE 21 Jan. 2003 High latitude IMK-FZK scientific product
Balloon
LPMA 4 March 2003 High latitude IMK-FZK scientific product
Aircraft MIPAS-STR 22 July 2002 Mid latitude IPF v 4.61
Satellite HALOE From 22 July to 27 Dec. 2002 Mid and high latitudes IPF v 4.61
Ground NDSC
FTIR Fall 2002 High and mid latitudes IPF v 4.61
Balloon measurements provide high vertical resolution profiles in most of the stratosphere, which are suitable for very detailed comparisons with MIPAS products, but these data have only a limited horizontal sampling. Aircrafts
provide observations with a wider geophysical coverage and can be optimised for a tighter space and time coincidence with MIPAS measurements, but in the lower stratosphere only. Even if a very significant effort from the
_______________________________________________________
Proceedings of the Second Workshop on the Atmospheric Chemistry Validation of ENVISAT (ACVE-2) ESA-ESRIN, Frascati, Italy, 3-7 May 2004 (ESA SP-562, August 2004) EMI02CC2
validation scientists and balloon or aircraft operation teams has been put into the acquisition of CH4 profiles
in good space and time coincidence with MIPAS, the number of such correlative data is not yet high enough for a fully significant statistical analysis.
An interesting complementary dataset with more global coverage and allowing higher statistics is provided by the satellite observations of HALOE (section 4).
In the same type of approach, ground-based profiles of CH4 derived by inversion of atmospheric solar
absorption spectra recorded using Fourier transform infrared spectroscopy (FTIR) can be used for increasing the statistics of MIPAS comparisons (section 5), but with a much coarser vertical resolution of the ground-based data in the stratosphere (∼ 8 km).
Finally, in section 6, with the caveat that the amount of data available for comparisons is still limited, some preliminary conclusions and recommendations are given.
2. BALLOON-BORNE MEASUREMENTS
The balloon experiments for which CH4 profiles (as well
as the corresponding MIPAS data) were available at the time of ACVE-2, include FTIR remote sensing instruments operating in limb thermal emission such as MIPAS-B [2] or in solar occultation such as LPMA [3] as well as in situ samplers such as the Bonbon cryosampler [4] and in situ diode laser spectrometers such as SPIRALE [5]. They are discussed in sequence, a priority being given to the balloon experiments of the 2002 campaigns for which IPF v4.61 MIPAS CH4 profiles are
available. In the case of the balloon flights of the 2003 campaigns, only IMK-FZK scientific products were available for comparison. In this latter case the IMK products are based on level 1b data version v4.55 for the respective time periods.
2.1 MIPAS-B results
The MIPAS balloon-borne instrument of Institut für Meteorologie und Klimaforschung, Karlsruhe-Forschungzentrum (IMK-FZK), Karlsruhe, Germany called MIPAS-B [2] is covering exactly the same spectral region as MIPAS-E (the ENVISAT instrument) and is operating in the same mode (limb thermal emission). The MIPAS-B flight of 24 Sept. 2002 from Aire-sur-l’Adour (43 N, 0 E) allowed an extremely good space and time coincidence with a night-time MIPAS-E limb scan. In Fig. 1, the vertical mixing ratio profiles of CH4 and the
corresponding errors are plotted as a function of pressure for the two MIPAS versions IPF v4.55 and v4.61 together with the MIPAS-B balloon profile. The “oscillations” observed in v4.55 are significantly reduced in v4.61 (but still present in the lower stratosphere), which confirms that the latter version is indeed the one to consider for comparison. The differences MIPAS-B minus MIPAS-E v4.61 have to be compared with the combined (root sum squares) error and seem to indicate a small positive bias of
MIPAS-E in the lower stratosphere. The overall agreement between the two profiles is quite good (maximum relative difference smaller than 17 %).
0.1 1 10 100 -0.4 -0.2 0.0 0.2 0.4 0.6 0.8 1.0 1.2 1.4 1.6 1.8 2.0 2.2 2.4 0.1 1 10 100 -0.4 -0.2 0.0 0.2 0.4 0.6 0.8 1.0 1.2 1.4 1.6 1.8 2.0 2.2 2.4 Absolute difference (ppmv) CH4 VMR (ppmv) Rec.16 - North Press ure (hPa)
Aire: 24 September 2002 Seq. N3 MIPAS-E (E): 24-Sep-2002 22:07:50 V4.61 MIPAS-E : 24-Sep-2002 22:07:50 V4.55 MIPAS-B (B): 24-Sep-2002 22:21:42 Absolute Diff. (B-E)
Combined errors
Fig.1. Validation of MIPAS CH4 v4.55 and v4.61 profiles by
B on 24 Sept. 2002 with B minus MIPAS-E v4.61 differences and combined error bars on the left. Note that MIPAS-B error bars show 1-σ accuracy while MIPAS-E errors only take into account spectral noise
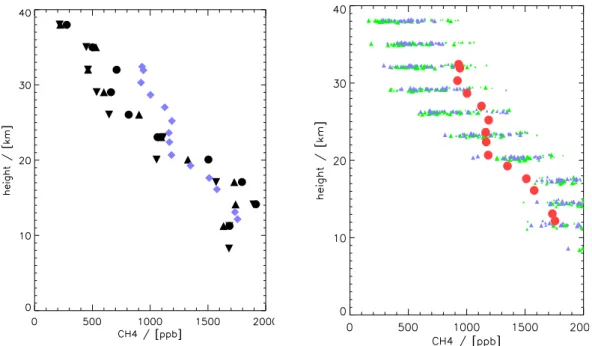
2.2. Cryosampler results
The flight of the cryosampler Bonbon [4] of Institut für Meteorologie und Geophysik, J.W. Goethe Universität, Frankfurt, Germany, took place the same day as the MIPAS-B flight on 24 Sept. 2002, also from Aire-sur-l’Adour. The v4.61 MIPAS-E CH4 mixing ratio profiles
from 3 limb scans are plotted as a function of altitude on the left panel of Fig. 2, whereas a larger statistics is achieved by combining five-days forward and backward trajectories “MIPAS-E transported” profiles (shown on the right panel) matching the cryosampler profile. The picture emerging from this comparison is slightly different from the previous comparison in the mid stratosphere, where MIPAS-E results appear to have a negative bias. The overestimation of CH4 by MIPAS-E
in the very low stratosphere seems to be confirmed.
2.3. SPIRALE results
The SPIRALE instrument [5] from Laboratoire de Physique et Chimie de l’Environnement (LPCE, Orléans, France) also took place in the mid latitude fall 2002 ESABC campaign from Aire-sur-l’Adour. Since MIPAS-E was not operating on 2 Oct. 2002 when SPIRALMIPAS-E was launched, the comparison is only possible with backward trajectories starting from MIPAS-E measurements on 26, 27 and 28 Sept. and ending at the SPIRALE location on 2 Oct. SPIRALE being an in situ diode laser spectrometer with a fast measurement rate, the correlative mixing ratio profile of Fig. 3 (plotted as a function of potential temperature for consistency with Lagrangian modelling) exhibits a fine structure, which is not captured by the trajectory mapping.
Fig. 2. Validation of MIPAS CH4 v4.61 profiles by the Bonbon cryosampler on 24 Sept. 2002.
The left panel is a direct comparison with 3 nearest MIPAS profiles for the same day.
The right panel displays 5 days backward and forward trajectory transported profiles for a larger statistics
SPIRALE/MIPAS_200209 300 400 500 600 700 800 900 1000 0 0,5 1 1,5 2 2,5 CH4(ppm) Te ta (K) SPIRALE/MIPAS 20030121_195233 10 15 20 25 30 35 0 0,5 1 1,5 2 2,5 CH4 (ppm) h(k m )
Fig. 3. Validation of MIPAS CH4 v4.61 profiles by
SPIRALE during the fall 2002 ESABC campaign from Aire-sur-l’Adour
The SPIRALE instrument was also flown during the winter 2002/2003 ESABC campaign from Esrange (Kiruna, Sweden) on 21 Jan. 2003. The MIPAS v4.61 CH4 profile is not available for that period, but the
IMK-FZK scientific processor profile for 21 Jan. 2003 was available and is presented together with the SPIRALE profile as a function of altitude in Fig. 4. The IMK-FZK profile is quite smooth (a difference with IPF profiles due to regularization [6,7]) and is in reasonable agreement with the SPIRALE profile, which is exhibiting much finer scale structure.
Fig. 4. Validation of the MIPAS CH4 profile derived
with the IMK-FZK scientific processor (purple squares) by the 21 Jan. 2003 flight of SPIRALE (dark blue
diamonds) during the winter 2002/2003 ESABC campaign from Esrange
2.4. LPMA results
The balloon-borne FTIR instrument of LPMA [3] was operating in solar absorption and in its long wave infrared optical configuration (LWIR) during a flight dedicated to the MIPAS validation on 4 March 2003 from Esrange (Kiruna, Sweden) in the Arctic. The IPF v4.61 data was not available for this date and the IMK-FZK scientific product was used for comparison. As can be seen in Fig. 5 the agreement between the 2 profiles in the altitude range 19-27 km is quite good
(within the respective error bars). In the upper part of the profile some differences do exist and may be real due to the approximate geographical co-location in the upper region of the vortex.
Fig. 5. Validation of the MIPAS CH4 profile derived
with the IMK-FZK scientific processor by the 4 March 2003 flight of LPMA during the ESABC
campaign from Esrange
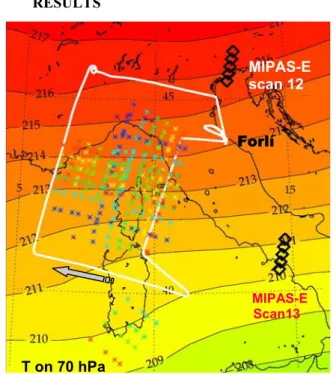
3. AIRCRAFT OBSERVATIONS: MIPAS-STR
RESULTS
Fig. 6. Flight pattern of the M-55 Geophysica, MIPAS-STR line-of-sight and MIPAS-E tangent points colour coded as a function of tangent altitude (6 km = dark
blue, 20 km = red)
The number of aircraft observations and/or the available MIPAS data for CH4 profiles validation is quite limited
at this time. The FTIR instrument MIPAS-STR [8] is operated by Forschungzentrum Karlsruhe, IMK-FZK on the M-55 Geophysica aircraft. MIPAS-STR is recording thermal emission limb spectral from float in the same
altitude coverage (∼ 6 to 21 km). But because of its capability to optimise its flight pattern as a function of the predicted MIPAS-E measurement points, the space and time geolocation can be quite good as seen in Fig. 6 for the MIPAS-STR flight of 22 July 2002 and the corresponding ENVISAT measurements. The corresponding vertical mixing ratio profiles of CH4 are
plotted as a function of tangent pressure (Fig. 7). The vertical resolution of MIPAS-STR in the upper troposphere lower stratosphere (UT/LS) is quite interesting for a detailed comparison with MIPAS-E. The problems of the IPF profiles are observed in these conditions: MIPAS-E profiles of CH4 (both for v4.55
and v4.61) do indeed present “oscillations” which are not observed in the MIPAS-STR profiles in this UT/LS region, leading to relative differences which can reach ∼ 30 % in this altitude range difficult for satellite measurements. 15 16 17 18 19 20 21 22 23 24 25 26 27 28 29 30 31 32 0,0 0,5 1,0 1,5 2,0 66.2°N 15.9°E 16:10 UT 66.8°N 23.2°E 15:38 UT LPMA 66.2 °N 17.8 °E 16:01 UT MIPAS (IMK) : 65.7°N 13.4°E 21:13 UT CH4 VMR (ppmv) alt itude ( km)
spectral domain as MIPAS-E, but with a reduced
Fig. 7. Validation of MIPAS CH4 v4.55 and v4.61
pro
. SATELLITE MEASUREMENTS: HALOE
atellite-satellite intercomparisons are another method
for the satellite-satellite comparison.
MIPAS-E scan 12
Forlí
files by MIPAS-STR on 22 July 2002 during a M-55 Geophysica flight from Forli, Italy
4
RESULTS
S
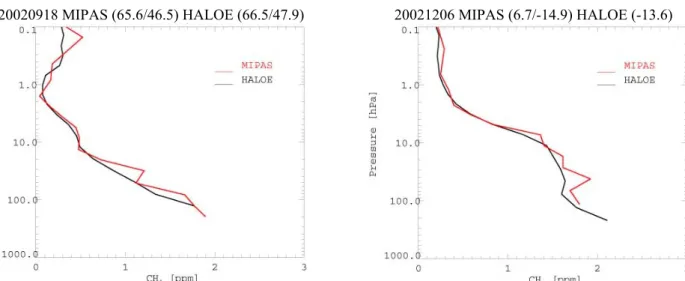
to assess the quality of a new space instrument, once another one, considered to be already validated by independent measurements, is stable and is producing reliable profiles. This is the case for the Halogen occultation Experiment (HALOE on board UARS) providing since 1991 vertical mixing ratio profiles of CH4 [9] (and several other species) in the full
stratospheric range using solar absorption gas correlation radiometry. The Institute of Environmental Physics (IUP) of University of Bremen has been using HALOE version v19 data for comparison with coincident MIPAS-E measurements [10]. Figure 8 displays comparisons for a high latitude profile and a tropical profile in good coincidence (same day, distance between HALOE and MIPAS tangent point less than 250 km). This choice of two quite different profiles is made to demonstrate the possibility of global coverage
MIPAS-E Scan13
20020918 MIPAS (65.6/46.5) HALOE (66.5/47.9) 20021206 MIPAS (6.7/-14.9) HALOE (-13.6)
Fig. 8. Comparison between individual HALOE and MIPAS profiles in two different geographical regions (high
A statistical comparison is then feasible as shown in
latitude and tropics)
Fig. 9 for a set of 110 coincident CH4 profiles obtained
by HALOE and MIPAS. A small positive bias (∼ 5 % at 1 hPa) of MIPAS with respect to HALOE is observed increasing at lower altitudes (∼ 15 % at 100 hPa) as seen with other correlative measurements. But the consistency between the two satellite sensors (within their respective error bars) is quite satisfactory.
Fig. 9. Statistical comparison of 110 coincident
m n
5. GROUND-BASED
he validation of MIPAS CH4 profiles by ground-based
of the Network for Detection of Stratospheric Change
ofile w
A more statisticall ison is presented Fig. 11, where the mean mixing ratio difference and
1
easurements of HALOE (in black) and MIPAS (i red) with the corresponding average and average ±
standard deviation profiles
RESULTS
T
measurements is difficult but possible using atmospheric absorption spectra recorded at high spectral resolution (0.002 cm-1) by the Bruker FTIR instruments
(NDSC). The inversion of the corresponding spectra which can be recorded at each ENVISAT overpass of the station when the sky is clear and the sun is present is providing mixing ratio profiles with a vertical resolution of about 8 km is the stratosphere [11]. The continuity of the ground-based FTIR observations at the NDSC sites is ensuring a larger number of coincidences with ENVISAT than for balloon or aircraft measurement, but comparison has to account for the proper averaging kernels of the FTIR measurements. This effect can be seen in Fig. 10 for a single MIPAS profile (with possibly an outlier at the lowest tangent altitude).
CH4 with the corresponding coincident MIPAS pr
Fig. 10. Comparison of a retrieved NDSC profile of
100 10 0 1 -0,2 -0,12 0,0 0,1 0,2 CH4 Kiruna, 20020719 MIPAS Orbit 2008 13:04, FTIR
09:08, MIPAS 4.61 in FTIR resolution 09:08, MIPAS 4.61, original
Volume mixing ratio [ppmv]
pressure
[hPa]
FTIR-MIPAS [ppmv]
ith and without applying the averaging kernel of the ground-based FTIR to the higher vertical resolution of
the MIPAS profile y significant compar in
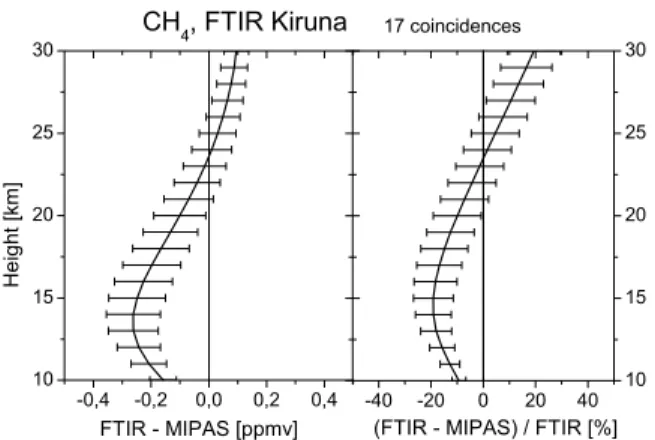
the relative difference with the corresponding MIPAS data are plotted as a function of altitude for a set of 17 CH4 coincident measurements. A positive bias of
MIPAS data with respect to FTIR values is observed in the lower atmosphere. The difference is quite small in the range 21 to 27 km where the sensitivity of the FTIR measurements is still reasonably good.
17 coincid
CH4, FTIR Kiruna
Fig. 11. Mean difference and relative difference
10 15 20 25 -0,4 -0,2 0,0 0,2 0,4 -40 -20 0 20 40 10 15 20 25 FTIR - MIPAS [ppmv] H e ig ht [km ]
(FTIR - MIPAS) / FTIR [%]
between 17 ground-based FTIR CH4 profiles and the
6. CON
lidation exercise presented ere is resulting from comparisons of the IPF v4.61 or
l of precision better than 15 %
ents is present
-
ency of the current IPF
-
-
7. REFERENCES
ion of ENVISAT chemistry struments by use of stratospheric balloon and aircraft,
balloon-borne Michelson Interferometer for
ensing of atmospheric
evidence of
ments of stratospheric trace species
n spectra TR, this issue located y at WLEDGEMENTS sity, especially M. Russell III), is acknowledged for providing us with
30
corresponding MIPAS profiles
CLUSION
The MIPAS CH4 profile va
h
IMK-FZK datasets available at the time of the ACVE-2 meeting with correlative profiles obtained from balloon-borne, aircraft, satellite and ground-based instruments. Even if the data for comparison are already significant in number, a firm conclusion is still awaiting further analysis. The following interim observations apply however
- overall MIPAS is indeed measuring CH4 reliably at
a leve
- a systematic positive bias of MIPAS with respect to several types of correlative measurem
in the lower stratosphere/upper troposphere (for pressure above 100 hPa)
the comparisons in the UT/LS are somehow complicated by the tend
v4.61 MIPAS algorithm to generate “oscillating” or zigzag profiles in the UT/LS. This is seen as a larger rms difference between MIPAS and correlative measurements when a statistics can be made as for the HALOE-MIPAS comparison the accuracy is difficult to assess before a better control of the quality of the MIPAS profiles is available. Systematic biases can still be masked by large rms differences due to spurious values or “oscillations”. The profiles produced by the IMK-FZK scientific processor (using regularization) may help solving these comparison issues as they are smoother than the corresponding IPF v4.61 profiles ground-based FTIR profiles have demonstrated their potential for higher statistics and mid-term
trends in the MIPAS-correlative data comparison. But care has to be applied in this case because of the reduced intrinsic vertical resolution of the FTIR profiles: the proper averaging kernels have to be used to smooth the corresponding MIPAS profiles before comparison
ences
30
1. Wursteisen P., The validat in
Proceedings of ENVISAT validation Workshop, Frascati, 9-13 December 2002, ESA SP-531, August 2003.
2. Friedl-Vallon F., et al., Design and characterisation of the
Passive Atmospheric Sounding (MIPAS-B2), Appl.
Opt., Vol. 43, 3335-3355, 2004.
3. Camy-Peyret C., et al., The LPMA balloon-borne FTIR spectrometer for remote s
constituents, ESA SP-370, 323-328, 1995.
4. Engel A., et al., Stratospheric trends of CFC-12 over the past two decades: recent observational
declining growth rates, Geophys. Res. Lett., Vol. 25, 3319-3322, 1998.
5. Moreau G., et al., A new balloon-borne instrument for in situ measure
using infrared laser diodes, ESA SP-397, 421-426, 1997. 6. Glatthor N., et al., Mixing processes during the Antarctic vortex split in September/October 2002 as inferred from source gas and ozone distributions from MIPAS/ENVISAT, J. Atm. Sciences, Special issue on
Antarctic Vortex 2002, accepted 7 Jan. 2004.
7. Von Clarmann T., et al., Retrieval of temperature and tangent altitude pointing from limb emissio
recorded from space by the Michelson Interferometer for Passive Atmospheric Sounding (MIPAS), J.
Geophys. Res., Vol. 108, 4736, 2003.
6. Keim C., et al., Validation of MIPAS-ENVISAT by correlative measurements of MIPAS-S
7. Park J.H., et al., HALOE CH4 Validation, J. Geophys. Res., Vol. 101, 10183-10204, 1996.
8. Bracher A., et al., Validation of MIPAS O3, NO2,
H2O and CH4 profiles (v4.61) with col
measurements of HALOE and SAGE II, this issue 9. Blumenstock T., et al., Validation of MIPAS and SCIAMACHY data by ground-based spectroscop Kiruna, Sweden, and Izana, Tenerife Island (AOID-191), this issue
8. ACKNO
The HALOE group (at Hampton Univer J.
the HALOE CH4 data used for comparison with
MIPAS. The corresponding work was funded by the BMBF (FKZ 012SF9994) and ESA (AO651).