VALIDATION OF MIPAS N2O PROFILES BY STRATOSPHERIC BALLOON,
AIRCRAFT AND GROUND BASED MEASUREMENTS
C. Camy-Peyret(1), G. Dufour(1), S. Payan(1), H. Oelhaf(2), G. Wetzel(2), G. Stiller(2),
Th. Blumenstock(2), C.E. Blom(2), T. Gulde(2), N. Glatthor(2), A. Engel(3), M. Pirre(4),V. Catoire(4),G. Moreau(4),
M. De Mazière(5), C. Vigouroux(5), E. Mahieu(6), U. Cortesi(7), F. Mencaraglia(7)
(1) Laboratoire de Physique Moléculaire et Applications (LPMA), Université Pierre et Marie Curie, case 76, 4 place
Jussieu, 75252 Paris Cedex 05, France, [email protected]
(2) Forschungszentrum Karlsruhe (IMK-FZK), Institut für Meteorologie und Klimaforschung, Germany,
(3) Institut für Meteorologie und Geophysik, J.W. Goethe Universität, Frankfurt, Germany,
(4) Laboratoire de Chimie Physique de l’Environnement (LPCE-CNRS), Orléans, France, [email protected] (5) BIRA-IASB, Belgian Institute for Space Aeronomy, Brussels Belgium, [email protected]
(6) Institute of Astrophysics and Geophysics, University of Liège, Belgium, [email protected] (7) Institute for Applied Physics “Nello Carrara”, IFAC-CNR, Florence, Italy, [email protected]
ABSTRACT/RESUME
The ENVISAT validation programme for the atmospheric instruments MIPAS, SCIAMACHY and GOMOS is based on a number of balloon-bone, aircraft and ground-based correlative measurements. In particular the activities of validation scientists were coordinated by ESA within the ENVISAT Stratospheric Aircraft and Balloon Campaign or ESABC. As a companion to a
similar paper on CH4 and in parallel to the contribution of
the individual validation teams, the present paper provides a synthesis of comparisons performed between
MIPAS N2O profiles produced by the current ESA
operational software (Instrument Processing Facility version 4.61 or IPF v4.61) or by the IMK-FZK scientific processor and correlative measurements obtained from balloon and aircraft experiments as well as from ground-based instruments.
1. INTRODUCTION
As recommended by ESA, validation results presented and discussed during the second Atmospheric Chemistry
Validation of ENVISAT (ACVE-2) workshop in May 2004 at ESRIN, Frascati had to be compared with products generated by the latest version of the operational
processing software. For the MIPAS N2O profiles
discussed here, the corresponding products were generated by the Instrument Processor Facility or IPF v4.61, but due to the late release and/or incomplete space/time coverage of the corresponding validation dataset, several correlative measurements had to be compared with non-official products. Fortunately, nitrous oxide profiles generated by the IMK-FZK scientific processor have been provided to several validation teams for comparing their own correlative measurements with MIPAS derived profiles. This is especially true for 2003 validation campaigns for which some of the ESA IPF v4.61 products were not yet available by the time of ACVE-2.
The correlative measurements for MIPAS N2O profiles
considered here (see Table 1) have been obtained by balloon experiments (section 2) and by aircraft experiments (section 3) participating in the ENVISAT Stratospheric Aircraft and Balloon Campaign (ESABC) coordinated by P. Wursteisen [1].
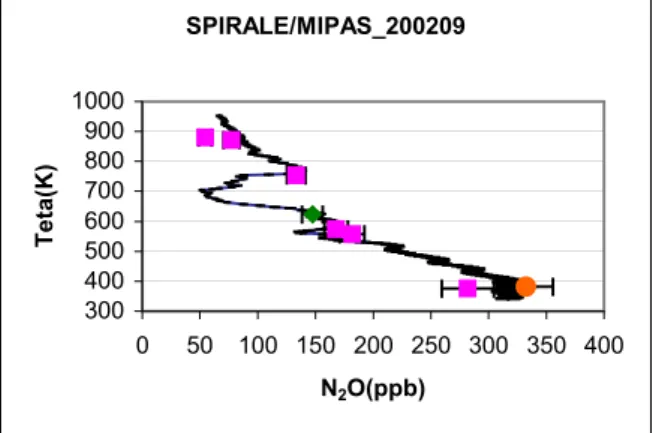
Table 1 : ESABC, satellite and ground based contribution to the validation of MIPAS N2O profiles.
Instrument Flight date/campaign period Latitude coverage MIPAS dataset available for validation
IBEX 28-29 July 2002 Mid latitude IPF v 4.61
MIPAS-B 24 Sept. 2002 Mid latitude IPF v 4.61
TRIPLE 24 Sept. 2002 Mid latitude IPF v 4.61
2 Oct. 2003 Mid latitude IPF v 4.61
SPIRALE
21 Jan. 2003 High latitude IMK-FZK scientific product
4 March 2003 High latitude IPF v4.61 & IMK-FZK scientific product Balloon
LPMA
23 March 2003 High latitude IPF v4.61 & IMK-FZK scientific product
MIPAS-STR 22 July 2002 Mid latitude IPF v 4.61
Aircraft SAFIRE-A 24 Oct. 2002 Mid latitudes IPF v 4.61
Ground NDSC
FTIR Fall 2002 High and mid latitudes IPF v 4.61
_______________________________________________________
Proceedings of the Second Workshop on the Atmospheric Chemistry Validation of ENVISAT (ACVE-2) ESA-ESRIN, Frascati, Italy, 3-7 May 2004 (ESA SP-562, August 2004) EMI02CC1Whereas balloon measurements provide high vertical resolution trace species profiles in most of the stratosphere, their specific constraints and limited geographical coverage make aircraft measurements interesting especially for optimising the coincidence or “rendez-vous” possibilities with MIPAS measurements from orbit, but with a smaller vertical coverage of the stratosphere. Since nitrous oxide and methane are passive tracers in the low stratosphere, the availability of simultaneous profiles of these 2 species affords the possibility of internal consistency checks by examining the
corresponding CH4/N2O correlation plots, which will be
discussed in this paper for some of the correlative balloon dataset. Even if a significant effort from the validation scientists and balloon or aircraft operation teams was devoted to reach good space and time coincidence with MIPAS, the number of such correlative data is not yet high enough for a fully significant statistical analysis.
An interesting complementary dataset allowing higher
statistics is provided by ground-based profiles of N2O
derived by inversion of atmospheric solar absorption spectra recorded using Fourier transform infrared spectroscopy (FTIR). The vertical resolution of the ground-based data (section 4) is, however, coarser than MIPAS data and averaging kernels have to be used for the comparison. Finally, in section 5, with the caveat that the amount of data available for comparisons is still limited, some preliminary conclusions and recommendations are given.
2. BALLOON-BORNE MEASUREMENTS
The balloon experiments for which N2O profiles (as well
as the corresponding MIPAS data) were available at the time of ACVE-2, include FTIR remote sensing instruments operating in limb thermal emission such as IBEX [2] in the far-infrared and MIPAS-B [3] in the mid-infrared or in solar occultation such as LPMA [4] as well as in situ samplers such as the Bonbon cryosampler [5] and in situ diode laser spectrometers such as SPIRALE [6]. They are discussed in sequence, a priority being given to the balloon experiments of the 2002 campaigns for
which IPF v4.61 MIPAS N2O profiles are available. In the
case of the balloon flights of the 2003 campaigns, some IMK-FZK scientific products (see [7] for a description of the corresponding processor) have been used for comparison when IPF v4.61 data were not available.
2.1 IBEX results
The IBEX (Infrared Balloon Experiment, Istituto di Fisica Applicata “Nello Carrara”, IFAC-CNR, Firenze, Italy) [2] is a far-infrared Fourier transform spectrometer, which was flown during the first campaign of ESABC
from Sicily (Trapani-Milo; 38 N, 12 E) over the
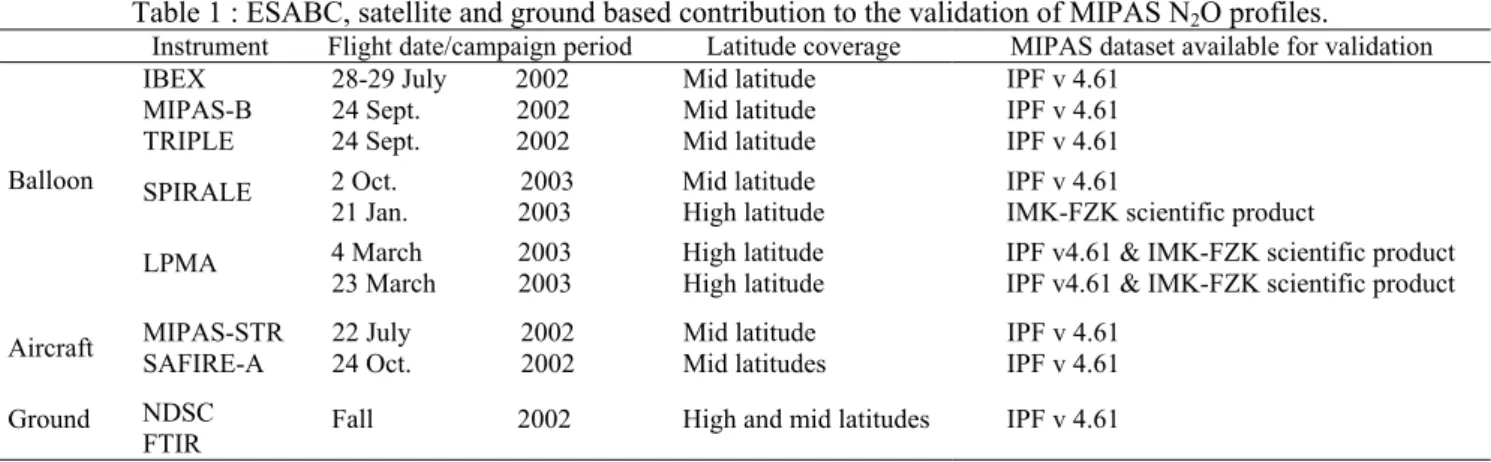
Mediterranean to Spain on 28-29 July 2002. Because there was no coincidence between the period when IBEX was at float and an overpass of ENVISAT, the data used
for comparison was taken from MIPAS-E limb scans performed over the Mediterranean within a ± 1 day window covering the IBEX measurements. The corresponding data are plotted in Fig. 1, which shows a reasonable agreement in the mid stratosphere with some dispersion of the balloon data. The MIPAS-E values in the very low stratosphere present a positive bias with respect to IBEX values, a situation which is also seen in other correlative measurements (see below).
Fig. 1. Comparison of the average of 8 IBEX N2O
profiles (green crosses with error bars) with the average of 2 MIPAS profiles recorded over the Mediterranean within a ± 1 day window covering the float period of the
balloon measurements 2.2 MIPAS-B results 0,1 1 10 100 -100 -50 0 50 100 150 200 250 300 350 400 450 -100 -50 0 50 100 150 200 250 300 350 400 450 Aire: 24 September 2002 Seq. N3
MIPAS-E (E): 24-Sep-2002 22:07:50 V4.61 MIPAS-E : 24-Sep-2002 22:07:50 V4.55 MIPAS-B (B): 24-Sep-2002 22:21:42 Absolute Diff. (B-E)
Combined errors MIPAS-B error bars: 1σ accuracy MIPAS-E error bars: only noise error
Absolute difference (ppbv) N2O(ppbv)
Rec.16 - North Pr essur e( h Pa)
Fig. 2. Validation of MIPAS N2O v4.55 and v4.61 profiles by
MIPAS-B on 24 Sept. 2002 with MIPAS-B minus MIPAS-E v4.61 differences and combined error bars on the left The MIPAS balloon-borne instrument of Institut für Meteorologie und Klimaforschung, Forschungszentrum Karlsruhe (IMK-FZK), Karlsruhe, Germany, called MIPAS-B [3] is covering exactly the same spectral region as MIPAS-E (the ENVISAT instrument) and is operating in the same observing mode (limb thermal emission). An extremely good space and time coincidence was achieved during the MIPAS-B flight of 24 Sept. 2002 from
Aire-sur-l’Adour (43 N, 0 E). The vertical mixing ratio
profiles of N2O and the corresponding errors are plotted
as a function of pressure for the MIPAS versions v4.55
and v4.61 together with the balloon profile. As for CH4
[8], the “oscillations” observed in v4.55 are significantly reduced in v4.61 (but still present in the lower stratosphere). The differences B minus MIPAS-E v4.61 have to be compared with the combined (root sum squares) error and demonstrate the impact of the
remaining “oscillations”: the mixing ratio values of MIPAS-E around 300 and 100 hPa are clearly overestimated.
2.3. Cryosampler results
The flight of the cryosampler Bonbon [5] of Institut für Meteorologie und Geophysik, J.W. Goethe Universität, Frankfurt, Germany, took place the same day as the MIPAS-B flight on 24 Sept. 2002, also from Aire-sur-l’Adour.
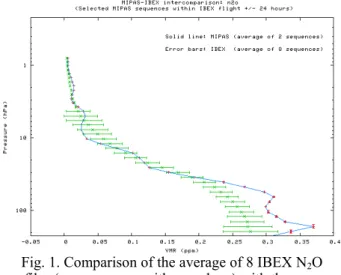
Fig. 3. Validation of MIPAS N2O v4.61 profiles by the Bonbon cryosampler on 24 Sept. 2002. The left panel is a direct
comparison with 3 nearest MIPAS profiles for the same day. The right panel displays 5 days backward and forward trajectory transported profiles for increasing the statistics
Fig. 4. Trajectory mapping between MIPAS and cryosampler flight data on 24 Sep. 2002. A number of 125 matches (1h, 500 km) is achieved for MIPAS data of 49 orbits within ± 5 days
The v4.61 MIPAS N2O mixing ratio profiles for 3 limb
scans are plotted together with the cryosampler results as a function of altitude on the left panel of Fig. 3. In this comparison and in the following figures care must be taken when MIPAS profiles are plotted as a function of geometric altitude since pointing errors may still affect level 2 IPF v4.61 products. To have a larger statistics five-days forward and backward trajectories shown in Fig. 4 were used to generate the data of the right panel of Fig. 3. In this manner 125 matches involving data acquired by MIPAS over 49 orbits can be “transported” by trajectory mapping to the space and time of the cryosampler measurements. The picture emerging from this comparison is quite satisfactory, with apparently a small negative bias of MIPAS-E in the mid-stratosphere with respect to the cryosampler results. Since simultaneous profiles of the long-lived
tracers N2O and CH4 (see [8] for the discussion on the
validation of the MIPAS profiles for this latter species) are obtained from MIPAS as well as from the cryosampler, it is interesting to check the consistency of
the N2O/CH4 correlation in both cases. This is shown in
Fig. 5 combining the cryosampler results for
24 Sept. 2002 with the MIPAS v4.61 results obtained by trajectory mapping as discussed above. The correlation plot looks reasonable but is confirming the tendency of
MIPAS to produce too high N2O and CH4 values in the
lowest stratosphere.
Fig. 5. Comparison of the CH4/N2O correlation derived by
the Bonbon cryosampler on 24 Sept. 2002 with the MIPAS derived correlation with ± 5 days trajectory mapping
2.4. SPIRALE results
The SPIRALE instrument [6] from Laboratoire de Physique et Chimie de l’Environnement (LPCE,
Orléans, France) took place at mid-latitude in the fall 2002 during the ESABC campaign from Aire-sur-l’Adour. Since MIPAS was not operating on
2 Oct. 2002 when SPIRALE was launched, the
comparison is only possible with backward trajectories starting from MIPAS measurements on 26, 27 and 28 Sept. and ending at the SPIRALE location on 2 Oct.
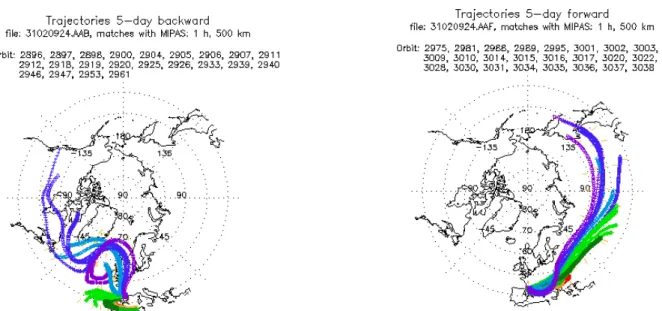
The N2O mixing ratio profile of Fig. 6 plotted as a
function of potential temperature is demonstrating the capacity of SPIRALE, a fast measurement rate in situ diode laser spectrometer, to resolve atmospheric fine structures during ascent (or descent) of the payload. The comparison with the MIPAS values transported by trajectory mapping to the SPIRALE geolocation is reasonable. As for the cryosampler, the simultaneous
measurements of N2O and CH4 are providing another
consistency test when the correlation CH4/N2O is
plotted (Fig. 7) for the SPIRALE values, for the MIPAS “transported” values and for the reference mid-latitude correlation of ATMOS [9]. Again the high bias of
MIPAS for N2O and CH4 is observed in the lowest
stratosphere. SPIRALE/MIPAS_200209 300 400 500 600 700 800 900 1000 0 50 100 150 200 250 300 350 400 N2O(ppb) Teta(K)
Fig. 6. MIPAS v4.61 and SPIRALE N2O profiles for
the 2 Oct. 2002 ESABC flight from Aire-sur-l’Adour CH4-N2O correlations (Michelsen et al. , GRL, 98)
0,00 0,20 0,40 0,60 0,80 1,00 1,20 1,40 1,60 1,80 2,00 2,20 0 50 100 150 200 250 300 350 400 N2O (ppb) CH4 (p p m )
Fig. 7. Comparison of the CH4/N2O correlation derived
from SPIRALE (black symbols) with the MIPAS correlation (same symbols as in Fig. 6) and with the
The SPIRALE instrument was also flown during the winter 2002/2003 ESABC campaign from Esrange (Kiruna, Sweden) on 21 Jan. 2003. The MIPAS v4.61
N2O profile is not available for that period, but the
IMK-FZK scientific processor profile is available and is presented together with the SPIRALE profile as a function of altitude in Fig. 8. The IMK-FZK profile is quite smooth (a difference with IPF profiles due to regularization) and is in good agreement with the SPIRALE profile except in the
lower stratosphere where MIPAS N2O mixing ratios reach
unrealistic values (> 350 ppbv).
Fig. 8. MIPAS N2O profile derived with the IMK-FZK
scientific processor (purple squares) and SPIRALE data (dark blue diamonds) for the 21 Jan. 2003 flight from
Esrange (68 N, 20 E)
2.6. LPMA results
The LPMA balloon-borne FTIR instrument [4] was operating in solar absorption during two flights of the spring 2003 ESABC campaign from Esrange (Kiruna, Sweden). The longwave infrared (LWIR) optical configuration was used on 4 March 2003 (LPMA19) and the shortwave infrared (SWIR) configuration was used on 23 March 2003 (LPMA20). The IPF v4.61 profiles are now available for these dates, but the IMK-FZK scientific products (see [10] for the use of these products in the case of Antarctic ozone hole analyses)
were also used for comparing the various N2O profiles.
18 20 22 24 26 28 30 32 0,00 0,02 0,04 0,06 0,08 0,10 0,12 0,14 0,16 0,18 0,20 16:10 UT (66.1N,15.6E) 16:00 UT (66.3N,17.9E) 15:40 UT
(66.7N,22.8E) LPMA sunset
MIPAS (65.7N,13.4E), 21:13 UT
operational IPF v4.61 (ESA) scientific (IMK-FZK processor)
N2O vmr (ppmv) al tit ude ( km )
Fig. 9. MIPAS N2O profiles derived from IPF v4.61 and
from the IMK-FZK scientific processor and LPMA
1,6 LPMA sunset 0,00 0,02 0,04 0,06 0,08 0,10 0,12 0,14 0,16 0,18 0,20 0,2 0,4 0,6 0,8 1,0 1,2
1,4 MIPAS (IMK-FZK product)
ATMOS (calculated) CH 4 V M R (ppm v) N2O vmr (ppmv)
Fig. 10. Comparison of the CH4/N2O correlation plots
for LPMA (4 March 2003 flight), MIPAS-E (IMK-FZK
SPIRALE/MIPAS 20032101_195233 10 15 20 25 30 35 -50 0 50 100 150 200 250 300 350 400 N2O(ppb) h(k m )
product) and ATMOS (calculated, outside vortex)
30 10 12 14 16 18 20 22 24 26 28 0,00 0,05 0,10 0,15 0,20 0,25 0,30 0,35 0,40 16:28 UT (66.8N,23.8E) 15:51 UT (67.3N,23.7E) 15:13 UT (67.7N,22.6E) N2O vmr (ppmv) al tit u de ( km) LPMA ascent MIPAS (65.7N,12.7E), 21:16 UT
operational IPF v4.61 (ESA) scientific (IMK-FZK processor)
Fig. 11. MIPAS N2O profiles derived from the IPF v4.61
and from the IMK-FZK scientific processor and LPMA
As can be tween the
profiles (LPMA, MIPAS-E from IPF v4.61 and from
scientific product) balloon measurements obtained on 23 March 2003 during
the ESABC campaign from Esrange seen in Fig. 9, the agreement be 3
IMK-FZK scientific processor) is quite good (within the respective error bars) for the measurements of 4 March 2003 in the altitude range 19-31 km.
The correlation plots between CH4 and N2O measured
by LPMA and MIPAS-E (IMK-FZK
for 4 March 2003 are compared in Fig. 10 with the calculated correlation [9] derived from ATMOS
(outside vortex). The CH4/N2O correlation (Fig. 10) is
consistent with ATMOS results above 19 km (i.e. for
N2O mixing ratios < 0.1 ppmv), but LPMA and MIPAS
values differ from the ATMOS correlation below. The
N2O profiles for the LPMA flight of 23 March 2003 are
plotted in Fig. 11 together with the MIPAS-E profiles (IPF v4.61 and IMK-FZK scientific product). The
corresponding CH4/N2O correlation plots are shown in
Fig. 12. A very good agreement is obtained between the
LPMA (measured on 23 March 2003) and ATMOS
(calculated, outside vortex) curves. The MIPAS results (IPF v4.61 and IMK-FZK products) are clearly departing from the standard correlation curve, however. The
structure of the MIPAS-E profile around 26 km
(0.17 ppmv for IPF v4.61) does not seem realistic. The
shark fin-like structure in the IMK N2O-CH4 correlation
balloon measurements obtained on 4 March 2003 during the ESABC campaign from Esrange
(Fig. 12) is caused by different altitude resolutions of these profiles in this particular case. Different response to small-scale structures shows up as an unphysical notch in the correlation curve.
1,8 2,0
Fig. 12. Comparison of the CH4/N2O correlation plots
for LPMA (23 March 2003 flight), MIPAS-E (IPF v4.61
0,00 0,05 0,10 0,15 0,20 0,25 0,30 0,35 0,40 0,0 0,2 0,4 0,6 0,8 1,0 1,2 1,4 1,6 CH 4 v m r (p pm v) N2O vmr (ppmv) LPMA ascent MIPAS (IMK) MIPAS V4.61 (ESA) ATMOS (calculated)
and IMK-FZK products) and ATMOS (calculated, outside vortex)
OBSERVATIO
3. AIRCRAFT NS
e sensing
easurements of N2O have been used within ESABC
22 July 2002 from the M-55
Forsc -55
Geophysica ai ra are
stratosphere (UT/LS) is SAFIRE-A [12, 13]
MIPAS-E limb scan 15 and for the corresponding Two aircraft instruments providing remot
m
during different phases of the deployment of the M-55 Geophysica. The first instrument is MIPAS-STR operating in the mid-infrared, the second one is SAFIRE-A operating in the far-infrared. Both instruments are FTIR spectrometers scanning the limb in the thermal emission geometry. As compared to balloon platforms accommodating similar instruments, the flight pattern of the M-55 aircraft can be optimised for good space and time geolocation with MIPAS-E measurements, but the vertical coverage of the aircraft FTIR instruments is reduced (∼ 6 to 21 km).
3.1. MIPAS-STR results
Fig. 13. MIPAS-E N
The FTIR Instrument MIPAS-STR [11] is operated by hungszentrum Karlsruhe, IMK-FZK on the M
rcraft. Thermal emission limb spect recorded from cruise altitude in the same spectral domain
as MIPAS-E onboard ENVISAT. The N2O profiles of
MIPAS-STR (two viewing directions, see [11] for more details) are plotted in Fig. 13, together with the coinciding
profiles of MIPAS-E. Clearly the high mixing ratio of N2O
for MIPAS-E in the lower stratosphere at ∼ 180 hPa is unrealistic and is possibly resulting from the lack of regularization in the IPF v4.61 retrieval algorithm.
3.2. SAFIRE-A result
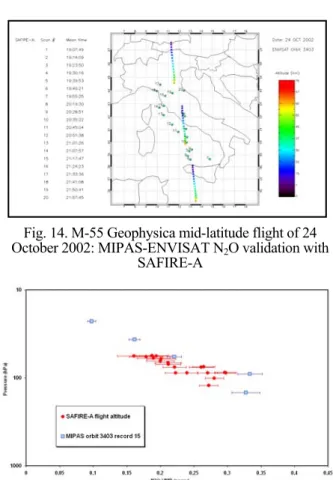
Fig. 14. M-55 Geophysica mid-latitude flight of 24
October 2002: MIPAS-ENVISAT N2O validation with
SAFIRE-A
g. 15. Comparison of ENVISAT orbit 3403, MIPAS
2O vmr measurem
October 2002
2O profiles produced by IPR v4.61
and MIPAS-STR measurements acquired on
Fi
scan 15 N ents with SAFIRE-A for 24
The other FTIR instrument measuring N2O profiles
from aircraft in the upper troposphere/lower (Spectroscopy of the Atmosphere by using Far-Infrared Emission) of Institute of Applied Physics, “Nello Carrara”, IFAC-CNR, Firenze, Italy. The geolocation of the SAFIRE-A limb scans and of the corresponding MIPAS-E tangent points is presented in Fig. 14 for the M-55 flight of 24 Oct. 2002, demonstrating the high degree of coincidence between aircraft and satellite measurements.
SAFIRE-A data. Clearly around the 100 hPa level, MIPAS-E presents a positive bias with respect to correlative measurements as already noticed for other comparisons in the UT/LS.
4. GROUND-BASED RESULTS
1
N O
Fig. 16. Comparison of N2O profiles derived from FTIR
ground-based spectra recorded at Kiruna with MIPAS v4.61 profiles (raw = green dots; smoothed = green line) T
100 10
0,0 0,1 0,2 0,3 0,4 0,5-0,04 0,00 0,04
13:04, FTIR
09:08, MIPAS 4.61 in FTIR resolution 09:08, MIPAS 4.61, original
Volume mixing ratio [ppmv]
p
resuur
e [hPa]
FTIR-MIPAS [ppmv]
he validation of MIPAS N2O profiles with
ground-ased measurements is difficult but feasible using tmospheric absorption spectra recorded at high spectral
-1
b a
resolution (∼ 0.002 cm ) by the Bruker FTIR
FTIR measu 2O profile
g. 18. Comparison of N2O profiles derived from FTIR ground-based spectra recorded at Jungfraujoch (ISSJ, Switzerland)
with MIPAS IPF v4.61 profiles (circle = a priori profiles; continuous lines = FTIR in red, MIPAS in blue) Fig. 17. Mean difference and relative difference
between 17 ground-based FTIR N2O profiles and the
corresponding MIPAS profiles
profile suitable for comparison with the ground-based
10 15 20 -0,04 -0,02 0,00 0,02 0,04 -20 0 20 10 15 20 FTIR - MIPAS [ppmv] He ig ht [km ]
(FTIR - MIPAS) / FTIR [%]
instruments of the Network for Detection of Stratospheric Change (NDSC). The inversion of the corresponding spectra, which can be recorded for each ENVISAT overpass of the station with the sun as a source in clear sky conditions, is producing mixing ratio profiles with a vertical resolution of about 8 km in the stratosphere [14]. For a rigorous comparison of the ground-based profiles with MIPAS, the smoothing due to the lower vertical resolution of the NDSC FTIR instruments is accounted for using the ground-based averaging kernels (matrix A):
xsmoothed = x
a + A (xraw – xa)
In this equation xa represents the a priori profile used in
the retrievals, whereas xraw and xsmoothed represent
respectively the MIPAS profile and the corresponding
Blue: MIPAS Blue: MIPAS
Blue: MIPAS
Red: FTIR Blue: MIPAS smoothed
rements. An example of single N
25 25
comparison is shown in Fig . 1 6 fo r measurements acquired from Kiruna and processed at IMK [14]. A comparison with better statistical significance is presented in Fig. 17 for a set of 17 FTIR profiles in
coincidence with MIPAS v4.61 N2O profiles during the
period 18 July 2002 to 1 November 2002. A similar type of processing has been done for FTIR spectra recorded at Jungfraujoch [15] and the results are presented in Fig. 18 for 2 cases in the fall 2002. The raw and smoothed MIPAS profiles appear respectively in the left and right panel together with the FTIR profiles and the a priori profiles used in the analyses. A consistency check is also provided when vertical columns are compared (see [15] for a more extensive discussion). This is shown in Fig. 19 where the “stratosphere” columns derived from FTIR spectra in the fall 2002 (the horizontal scale is in modified Julian day MJD 2000) are plotted together with the corresponding MIPAS derived column. The positive bias of MIPAS in the UT/LS is found again here in the higher values of the MIPAS columns as compared to FTIR. But one has to be careful with the exact lower limit for integrating the stratospheric columns.
Fi 2 Kiruna, 20020719 MIPAS Orbit 2008 30 17 coincidences 30 N2O, FTIR Kiruna smoothed Red: FTIR Circles: a priori Circles: a priori
6. REFERENCES
Fi
MIPAS derived colum s. Integration over the
5.
he MIPAS N2Oprofile validation exercise presented
parison of IPF v4.61 or K-FZK datasets available at the time of the ACVE-2
- a positive bias of MIPAS with respect to several .e. for -
ed IPF v4.61 algorithm or by oscillations -
should be
-
monstrated their potential for
1. Wursteisen P., The validation of ENVISAT
chem and
Wo 02, ESA
SP-. Bianchini et alSP-., Correlative measurements of
et al., Design and characterisation
spectrometer for remote sensing of atmospheric
. Res. Lett., Vol. 25, race species
de pointing from limb emission
y-Peyret C., et al., Validation of MIPAS CH4
77-ctober 2002 as
et al., Validation of MIPAS-ENVISAT by
e MIPAS
ID-191), this issue
15. De Mazière M., et al., this issue
g. 19. N2O vertical colum s from ground-based FTIR
(ISSJ-Jungfraujoch) com ared to the corresponding np
n
profiles is performed within the given altitude limits. The horizontal scale is MJD2000
CONCLUSION T
here is resulting from com IM
meeting with correlative profiles obtained from balloon-borne, aircraft and ground-based instruments. Even if the data for comparison are already significant in number, a firm conclusion is still awaiting further analyses. However, the following findings apply:
- overall MIPAS is indeed measuring N2O reliably
at the 10 % level of precision
types of correlative measurements is present in the lower stratosphere/upper troposphere (i
pressure greater than 100 hPa) for N2O (and CH4,
see [8])
the comparisons in the lower part of the MIPAS
N2O profiles is often hindered by the weakly
constrain
generated in the overall MIPAS system
the CH4/N2O correlation is useful to detect
spurious MIPAS values in one or the other profile of these long-lived tracers. This check
done systematically by ESA to flag (and examine later) profiles where the observed correlation is far from expectation
ground-based FTIR profiles of N2O, when
compared with the appropriately smoothed MIPAS profiles, have de
higher statistics and mid-term trends in the MIPAS/correlative data comparison.
istry instruments by use of stratospheric balloon aircraft, Proceedings of ENVISAT validation rkshop, Frascati, 9-13 December 20
531, August 2003. 2
selected molecules over the Mediterranean region, Proceedings of ENVISAT validation Workshop, Frascati, 9-13 December 2002, ESA SP-531, August 2003
3. Friedl-Vallon F.,
of the balloon-borne Michelson Interferometer for Passive Atmospheric Sounding (MIPAS-B2), Appl. Opt., Vol. 43, 3335-3355, 2004.
4. Camy-Peyret C., et al., The LPMA balloon-borne FTIR
constituents, ESA SP-370, 323-328, 1995.
5. Engel A., et al., Stratospheric trends of CFC-12 over the past two decades: recent observational evidence of declining growth rates, Geophys
3319-3322, 1998.
6. Moreau G., et al., A new balloon-borne instrument for in situ measurements of stratospheric t
using infrared laser diodes, ESA SP-397, 421-426, 1997.
7. Von Clarmann T., et al., Retrieval of temperature and tangent altitu
spectra recorded from space by the Michelson Interferometer for Passive Atmospheric Sounding (MIPAS), J. Geophys. Res., Vol. 108, 4736, 2003. 8. Cam
profiles by stratospheric balloon aircraft, satellite and ground-based measurements, this issue
9. Michelsen H.A., et al., Correlations of stratospheric
abundances of CH4 and N2O derived from ATMOS
measurements, Geophys. Res. Lett., Vol. 25, 27 2780, 1998.
10. Glatthor N., et al., Mixing processes during the Antarctic vortex split in September/O
inferred from source gas and ozone distributions from MIPAS/ENVISAT, J. Atm. Sciences, Special issue on Antarctic Vortex 2002, accepted 7 Jan. 2004.
11. Keim C.,
correlative measurements of MIPAS-STR, this issue 12. Bianchini G., et al., SAFIRE-A optimised instrument configuration and new assessment of spectroscopic performances, Appl. Opt., Vol. 43, 2962-2977, 2004 13. Cortesi U., et al., Results of mid-latitud
validation measurements obtained by the SAFIRE-A airborne spectrometer, this issue.
14. Blumenstock T., et al., Validation of MIPAS and SCIAMACHY data by ground-based spectroscopy at Kiruna, Sweden, and Izana, Tenerife Island (AO
7. ACKNOWLEDGEMENTS
This synthesis paper on the validation of MIPAS N2O
reparation o f th e in stru men ts and
the operation of the different balloon or ircraft flights within the various ESABC campaigns uring which the data presented here has been cquired. The same is true for the personnel involved
the operation of the ground-based FTIR struments. The contribution of all of them is ratefully acknowledged.
profiles is owing much to the dedication of many scientists, engineers, launching team memb ers, pilots and technicians. They have been involved in the p in a d a in in g