HAL Id: hal-03001596
https://hal.archives-ouvertes.fr/hal-03001596
Submitted on 12 Nov 2020HAL is a multi-disciplinary open access
archive for the deposit and dissemination of sci-entific research documents, whether they are pub-lished or not. The documents may come from teaching and research institutions in France or abroad, or from public or private research centers.
L’archive ouverte pluridisciplinaire HAL, est destinée au dépôt et à la diffusion de documents scientifiques de niveau recherche, publiés ou non, émanant des établissements d’enseignement et de recherche français ou étrangers, des laboratoires publics ou privés.
Adsorption of CO and N2 Molecules at the Surface of
Solid Water. A Grand Canonical Monte Carlo Study
Antoine Patt, Jean-Marc Simon, J Salazar, Sylvain Picaud
To cite this version:
Antoine Patt, Jean-Marc Simon, J Salazar, Sylvain Picaud. Adsorption of CO and N2 Molecules at the Surface of Solid Water. A Grand Canonical Monte Carlo Study. Journal of Chemical Physics, American Institute of Physics, In press, 153 (20), �10.1063/5.0031254�. �hal-03001596�
Adsorption of CO and N2 Molecules at the Surface of Solid Water. A Grand Canonical Monte Carlo Study
Antoine Patt,1, a) Jean-Marc Simon,2 J. Marcos Salazar,2 and Sylvain Picaud1, b)
1)Institut UTINAM UMR 6213, CNRS/Université de Bourgogne Franche-Comté,
Besançon, France
2)Laboratoire Interdisciplinaire Carnot de Bourgogne (ICB) UMR 6303,
CNRS, Université de Bourgogne Franche-Comté, F-21078 Dijon Cedex, France
(Dated: 27 October 2020)
The adsorption of carbon monoxide and nitrogen molecules at the surface of four forms of solid water is investigated by means of grand canonical Monte Carlo simulations. The trapping ability of crystalline Ih and low-density amorphous ices, along with clathrate hy-drates of structures I and II, are compared at temperatures relevant for astrophysics. It is shown that, when considering a gas phase that contains mixtures of carbon monoxide and nitrogen, the trapping of carbon monoxide is favored with respect to that of nitrogen at the surface of all solids, irrespective of the temperature. The results of the calculations also indicate that some amounts of molecules can be incorporated in the bulk of the water structures and the molecular selectivity of the incorporation process is investigated. Again, it is shown that the incorporation of carbon monoxide is favored with respect to that of ni-trogen in most of the situations considered here. In addition, the conclusions of the present simulations emphasize the importance of the strength of the interactions between the guest molecules and the water network. They indicate that the accuracy of the corresponding interaction potentials is a key point, especially for simulating clathrate selectivity. This highlights the necessity of having interaction potential models that are transferable to dif-ferent water environments.
a)Electronic mail: [email protected] b)Electronic mail: [email protected]
I. INTRODUCTION
Water is one of the most abundant molecules in the Universe. It is found everywhere, in the most distant galaxies, among the stars, on planets and their moons and ring systems, in asteroids,
in comets.1Water has also been discovered in interstellar clouds and on dust grains at the surface
of which water is located, among other molecules, in what is called "ice mantles".2Although water
is widely present in the Universe, elsewhere than Earth, water found so far is mainly in the gaseous
or solid states.3,4. Indeed, liquid water seems to be extraordinarily rare, although the presence of
liquid water has been, for instance, inferred in the interior of Saturn’s moon Enceladus5and, very
recently, suspected just below the surface of the polar regions of Mars6.
Solid water in the Universe can be found as crystalline or amorphous ices, according to the local thermodynamic conditions. Besides, solid water can also exist in the form of clathrates hydrates when water molecules are mixed with other gases. Clathrate hydrates, also known as gas hydrates,
are crystalline solids consisting of a water network encaging small guest molecules.7These
com-pounds are ubiquitous on Earth with methane being the most frequently encaged species, and they
have also been suspected to be widely present in various astrophysical environments.8,9
More than 15 different solid forms have been experimentally identified in the water’s phase diagram, differentiated by the range of pressure and temperature at which they are stable or
metastable, and by the way water molecules are arranged at the atomic scale.10 Some of them are
crystalline structures corresponding to fully connected tetrahedral networks of water molecules, in which each molecule donates hydrogen bonds to two neighbors and accepts two hydrogen
bonds from two others.11 Among these structures, ice Ih is the normally experienced form of
crystalline ice on Earth. Moreover, some other solid forms of water exhibit non-crystalline struc-tures, although they are also essentially made-up of four-coordinated water molecules. These non-crystalline arrangements of water molecules are known as amorphous ices, and they may ex-hibit different densities, leading to the formation of low density (LDA), high density (HDA) and
very high density (VHDA) amorphous ices.11 Finally, emptying clathrate hydrates by removing
the guest species recently allowed the stabilization of new ice polymorphs10.
The relevance of solid water in astrophysics research is associated with the role that ice may play in interstellar chemistry. Interstellar chemistry has been recognized for several decades as an
important pathway for the synthesis of molecules in space, indeed12. However, most often, only
organic molecules, cannot be efficiently produced without invoking surface reactions.2Given that water is abundant at the surface of dust grains, heterogeneous chemical processes due to ice
sur-faces seem to play a major role in producing molecular species.13 Namely, an important question
linked to astrophysical ices is the origin of the prebiotic materials and, henceforth, the origin of
life.14 Water may organize molecules using its structure, the structure of its ices and the structure
of the interfaces between its different solid phases and various solids and gases. As an example,
following the initial formation of methane (from H2 and CO2) clathrate hydrates under pressure,
reactions within the clathrate shells with phosphate and nitrate can, under certain circumstances,
form ribonucleic acids.15
Henceforth, a thorough characterization of the surface processes on interstellar ices appears to be of fundamental interest for enhancing our understanding of the interstellar formation of prebiotic molecules, in connection with their possible delivery to early Earth, and with the possible
emergence of Earth-like life elsewhere in the Universe16.
In this astrophysical context, interactions of gaseous compounds with solid water surfaces have
been widely studied in the laboratory during the past decades.17,18To gain more insights regarding
the details of the adsorption processes, such as the sites where the molecules are trapped at the sur-face, how do they bind to water molecules, and how strong is the corresponding adsorption energy,
numerical simulations can well complement the results of the experimental investigations.19 The
grand canonical Monte Carlo (GCMC) method20, which is particularly suitable for studying
ad-sorption phenomena, has thus been successfully applied in the past two decades for characterizing the behavior of various small molecules at the surface of crystalline and amorphous ices (see the
recent review by Picaud and Jedlovzky19), as well as for studying the trapping of various species
in clathrate hydrates.21–30
Among the various molecules of astrophysical relevance, CO and N2are of particular interest.
In circumstelllar and interstellar environments, these molecules are major gas-phase reservoirs of nitrogen and carbon, respectively. These atoms are essential ingredients for building prebiotic organic molecules via chemical reactions. Such chemistry is, however, hardly possible if nitrogen
and carbon are locked up in stable N2 and CO molecules. While photodissociation is a primary
destruction route of these molecules in any region where UV photons are present,31,32the trapping
of N2 and CO on ice may hamper the photodissociation processes and preserve the molecular
forms for a while. On the other hand, direct hydrogenation of CO via surface-tunneling reaction has been proven to be the main route for the formation of formaldehyde and methanol molecules
on the ice mantles covering dust grains, at very low temperature.33
Another particularity of N2 and CO molecules, is their relative abundance in comets,
imply-ing strong constraints on the formation conditions of comets.34 Surprisingly, N2 has never been
detected in comets before the recent direct in situ measurement in the Jupiter family comet 67P/Churyumov-Gerasimenko made by the ROSINA mass spectrometer aboard the Rosetta
spacecraft.34 On this comet, a small N2/CO ratio of (5.70 ± 0.66)10−3 was measured,
corre-sponding to depletion by a factor of ∼ 25.4 ± 8.9 compared to the protosolar value.34 A possible
interpretation of this low N2 abundance in 67P is that the comet agglomerated from grains
con-sisting of clathrates, that preferentially incorporate the CO with respect to the N2 molecule, at
very low temperature and for CO/N2 ratios typical of the protosolar nebula.27. This ansatz was
developed in recent GCMC simulations performed between 52 and 100 K and complemented by
thermodynamic extrapolation below 52 K27.
Because of its strong astrophysical interest, here we characterize, at the molecular scale, the
trapping of CO and N2 molecules by solid water at various pressures and temperatures.
Specif-ically, we use the GCMC simulation method to compare the adsorption properties of these two molecules at the surface of four water ices typical of astrophysical environments, namely the Ih crystalline ice, the LDA amorphous ice, and the two structures I and II of clathrate hydrate. Thus, we simulate the corresponding adsorption isotherms at three temperatures, 50, 100 and 150 K, that fall into the temperature range corresponding to various astrophysical contexts, including
cold regions of the interstellar medium, comets and some planets of the Solar System11, and we
investigate exhaustively the adsorption geometries and binding energies in large pressure ranges. As fas as clathrate is concerned, we also characterize the competition between trapping at the surface and incorporation in the bulk of the system.
II. SIMULATIONS DETAILS
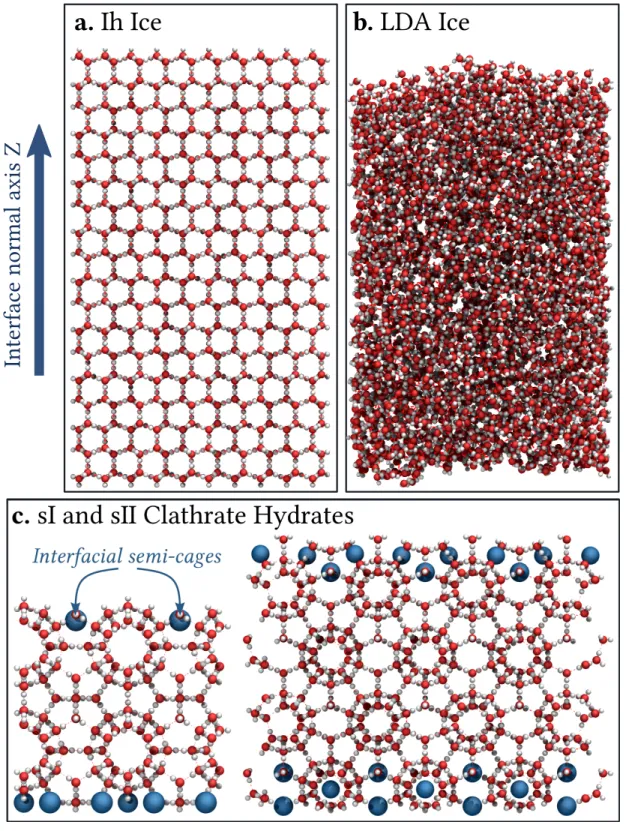
Four different surfaces of solid water relevant for astrophysical environments are considered here (Figure 1).
In preparing the Ih phase of ice (Figure 1a), the algorithm of Buch et al.35has been used which
yields a proton disordered hexagonal structure with the overall dipole moment close to zero and
that fulfills the Bernal-Fowler rules36. The water molecules in this structure have been arranged in
a. Ih Ice
b. LDA Ice
Interface normal axis Z
FIG. 1. Visualization of the four molecular structures of solid water used in the present work. Oxygen and hydrogen atoms are represented as red and white balls, respectively. Panel (a) displays the structure of type Ih crystalline ice, while the amorphous structure of the LDA ice is shown on panel (b). The two clathrate hydrates structures are given on panel (c), with sI on the left and sII on the right hand sides of the figure. Note that big blue spheres show the positions of the incomplete interfacial cages, the so-called semi-cages.
adsorption on the (0001) surface of crystalline ice is considered. The LDA phase (Figure 1b) has
been created as described in Refs.37,38, i.e., by thermalizing first the Ih phase at 300 K with 108
Monte Carlo (MC) steps long followed by a 2 × 10⁸MC steps at 350 K, and another 108MC steps
again at 300 K. Finally, the system has been quenched to 200 K, and equilibrated for another 108
MC steps at this temperature.
To simulate a clathrate surface, both structures I (sI) and II (sII) of clathrate hydrate have been considered, their unit cells being formed by 6 large and 2 small cages, containing 46 water molecules, and by 16 large and 8 small cages, containing 136 water molecules, for the structures sI and sII, respectively. The water positions and orientations in these unit cells have been taken from
Takeuchi et al.39 and 2 × 2 × 2 unit cells have been considered for filling the simulation box along
the x and y directions, only. Hence, these clathrate structures form a finite slab, the two interfaces of which being located along the z axis and containing incomplete (semi-)cages (Figure 1c).
For Ih and LDA ices, the edges of the rectangular basic simulation box are 35.926 Å and 38.891 Å along the x and y axes, respectively, whereas for the clathrate system, these values are 24.06 Å and 34.62 Å for sI and sII clathrates, respectively. Thus, the basic simulation box contains 1880 water molecules when simulating both crystalline and amorphous ices, whereas it contains 368 and 1088 water molecules when characterizing adsorption on sI and sII clathrates, respec-tively.
For each system, periodic boundary conditions have been applied to the simulation box in the (x, y) directions, and a large vacuum above the surface along the z direction has been created, with three-dimensional periodicity. Thus, the simulated systems are made of a stack of non-interacting slabs of infinite surface area. For both Ih and LDA ices, the edges of the rectangular basic simu-lation box are 100 Å along the z axis, whereas for the clathrate systems, the corresponding values are 60.15 Å and 86.55 Å for structures I and II, respectively.
The trapping of CO and N2 molecules by these solid water systems has been investigated by
performing Monte-Carlo simulations in the grand canonical (µ,V, T ) ensemble (GCMC) at three temperatures of astrophysical interest, namely, 50, 100 and 150 K. In these simulations, while
the number of water molecules in the simulation box is kept constant, the number of CO and N2
molecules fluctuates in function of the chemical potential, µ, of the gas phase in contact with the solid water surface. These molecules have been subjected to grand canonical MC moves, i.e., not only translation and rotation but also insertion and deletion in the system have been permitted.
the system or an extra CO (N2) molecule has been added. The probabilities of the different MC moves have been set to 10% for translation, 10% for rotation, 40% for insertion and another
40% for deletion, when dealing with CO or N2 adsorbates. However, when considering a mixed
gas phase containing both CO and N2 molecules together, these probabilities have been changed
to 10 % for translation, 10 % for rotation, 40 % for insertion/deletion with equal probabilities, and 40 % for identity change move, wich consists in substituting a molecule of a certain type by a molecule of another type, at the same position. Note that no bias has been considered to increase the acceptance ratio of insertion/deletion moves. Meanwhile, the water substrates have been treated as flexible systems in the MC simulations, where rotational and translational degrees of freedom of the water molecules have been taken into account. As a result of these simulations, trapping isotherms have been calculated, giving the average number of molecules interacting with the solid water systems in the simulation box as a function of the chemical potential values.
The interactions between water and the CO and N2molecules have been represented by
classi-cal potential models, as the sum of pairwise dispersion-repulsion and Coulomb contributions of all pairs of various interaction sites located on the interacting molecules, which have been considered as rigid bodies.
On the basis of previous works devoted to trapping of CO and N2 in clathrates,44,45, the water
molecules have been modeled by the TIP4P-Ew model,40 whereas the model proposed by Potoff
and Siepmann on the basis of the TraPPE force field,41 has been used for N2. When considering
the CO molecules, two different force fields have been considered, on the basis of their ability for describing CO-water interactions in various contexts. They are both based on a combination of Lennard-Jones and coulombic charge-charge contributions. The first model (hereafter named
model A) has been proposed by Piper et al.42. It has been recently used in combination to the
Potoff’s model for N2,41 to investigate the trapping of CO and N2molecules inside the small and
large cages of sI ans sII clathrates at 150 K, and it has been proven to represent qualitatively
well the experimental observations.44The second force field (hereafter named model B) has been
developped by Straub and Karplus,43 in their molecular dynamics simulations of biomolecular
systems, in which the interaction between CO and water molecules needs to be explicitely taken into account. The parameters of the aforementioned models are given in Table I.
The Ewald summation technique has been used to calculate the Coulomb interactions whereas the dispersion-repulsion contributions to the interaction potential have been computed by using a
cut-off equal to half the simulation box and by taking into account long-range corrections20. The
usual Lorentz-Berthelot mixing rules have been used to derive the cross-interactions between two different LJ sites.
Our simulations have been performed by using the GIBBS general purpose simulation code46.
In the GCMC simulation results, the chemical potential has been expressed in terms of the fugacity. In most part of the pressure range considered here, one can assume that the fugacity is equal to the
pressure for the CO and N2molecules which behave as ideal phases30.
When considering clathrates, equilibration has been performed during 2.5 × 10⁷ and 7 × 10⁷
MC steps, for sI and sII clathrates, respectively, whereas for crystalline and amorphous ices,
the systems have been equilibrated during 1 × 10⁸ MC steps due to the larger number of water
molecules in the simulation box. These considerable numbers of simulation steps have been re-quired to ensure that both the number of the trapped molecules in the simulation box and the total energy of the system stopped showing any significant deviation from their average value. The
equilibration phase has been followed by a production stage of 108 steps during which data have
been collected, at given values of the fugacity, for statistical analysis. No bias has been introduced
in the choice of the insertion sites for the CO and N2molecules and, as a consequence, uniform
probability of insertion has been used for the gas and solid regions.
Note that, because LDA ice and clathrate hydrates exhibit porosity that can favor trapping of the gas species, not only at the surface but also inside the solid water substrate, we calculated three different types of isotherms to characterize the trapping of gaseous species by solid water. Thus, the total isotherm represents the average number of molecules found in the simulation box as a function of the fugacity, whereas the surface adsorption and the incorporation isotherms accounts for the molecules that are directly attached to the surface water molecules or that are incorporated into the water substrate, respectively.
Whereas the determination of the incorporation isotherm is an easy task, the calculation of the surface adsorption isotherm requires to discriminate molecules that are in contact with the water surface. In other words, it requires a careful determination of the truly interfacial water molecules. This is particularly crucial when considering the corrugated surfaces of the LDA and clathrate
phases for which the z position of the CO or N2molecules cannot be used as the unique criterion
to determine the location of the molecule with respect to the water surface. For this, we used
the ITIM method47 to analyse the sample configurations. In these analyses, a probe sphere of
radius Rsphere between 1.0 and 2.0 Å (depending on the system) and a grid lines spacing of 0.5 Å
water layers if it is located at less than 5 Å from the interfacial water molecules, a distance that corresponds to the first minimum of the pair radial distribution functions between the centers of mass of the adsorbed molecules and the water molecules.
0 0.2 0.4 0.6 0.8 1 yCO 0.0 0.5 1.0 1.5 2.0 2.5 3.0 3.5 4.0 α CO/N 2 Model A - sI Model A - sII Raman data Model B - sI Model B - sII T = 150 K FugTot = 60.0 bar
FIG. 2. Comparison of the molecular selectivities αCO/N2 obtained by GCMC simulations for both models, and for both hydrate structures, with data from Raman spectroscopy. This comparison is made at the temperature of 150 K and at the total fugacity of 60 bar. The Raman spectroscopy data as well as the selectivities for model A, were reproduced from our previous work.44
III. RESULTS AND DISCUSSION
A. Preliminary tests of the interaction models for CO
First, the accuracy of the two models selected to represent the interactions between CO and H2O
molecules has been checked, in the context of bulk clathrates, for which recent experimental results
are available in the literature.44,48 Two series of GCMC calculations have thus been performed,
both of them considering the competitive trapping of CO with respect to N2when the gas phase in
contact with clathrates contains mixtures of CO and N2molecules.
In the first test, the molecular selectivity parameter αCO/N2 inside the cages of sI and sII
clathrates has been calculated as a function of the gas phase composition, in the experimental conditions, i.e., for a total fugacity of 60 bar and a temperature of 150 K. As in our previous work,
the selectivity parameter αCO/N2 is defined as the molar fraction ratio of the CO and N2molecules
in the gaseous and hydrate phases :44
αCO/N2 = xCO xN2 yCO yN2 (1)
where xAand yAare the molar fractions of A in the hydrate and gaseous phase, respectively.
Worthwhile to point out, is that the higher the value of αCO/N2 is, the more the system favors
the incorporation of CO at the expense of N2. Note that, at the fugacity value of 60 bar, the gas
phase actually does not behave as an ideal mixture, and the molar fractions cannot be determined from the partial fugacities. Rather, the real composition of the gas phase is determined directly
from GCMC simulations of the CO-N2 mixture at conditions imposed to the clathrate.44 The
corresponding variations of αCO/N2 values as a function of the CO molar fraction in the gas phase
(yCO) are given on Figure 2, together with the experimental data for comparison. As it can be
seen on this figure, the selectivity calculated by using model A seems more accurate than the
one calculated with model B, when yCO< 0.2, i.e., in the range of CO molar fraction where the
clathrate is supposed to form a sII structure.44By contrast, for values of yCOgreater than 0.2, where
the clathrate is supposed to from a sI structure in the experimental conditions,44 both models A
and B appear to perform quite well, with respect to the experimentally determined values of the selectivity.
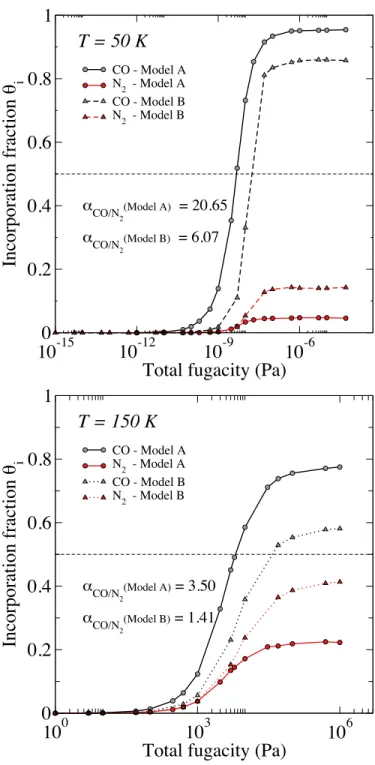
The second test has been specifically focused on bulk sI clathrate, for which we have calcu-lated the corresponding incorporation isotherms from GCMC simulations, in a situation where the
gas phase contains an equimolar mixing of CO and N2 molecules at both 50 and 150 K, in a
fu-gacity range corresponding always to an ideal CO–N2 gas mixture, in constrast with the situation
evaluated in the first test. It can be seen on Figure 3, that models A and B give rather similar results, especially at 50 K, exhibiting thus a preferential trapping of CO inside the clathrate, at the
expense of N2, although the difference between N2 and CO molecules is less pronounced when
using model B at 150 K. These conclusions are enlighted when calculating the selectivity αCO/N2
inside the clathrate, at the saturation of the cages (i.e., at a total fugacity value corresponding to the plateaus of the isotherms). Indeed, in this situation, the results indicate that the selectivity ob-tained with both models A and B is always greater than 1, showing a preferential trapping of CO
10
010
310
6Total fugacity (Pa)
0
0.2
0.4
0.6
0.8
1
Incorporation fraction
θ
i CO - Model A N2 - Model A CO - Model B N 2 - Model BT = 150 K
α CO/N2(Model A)= 3.50 α CO/N2(Model B)= 1.4110
-1510
-1210
-910
-6Total fugacity (Pa)
0
0.2
0.4
0.6
0.8
1
Incorporation fraction
θ
i CO - Model A N 2 - Model A CO - Model B N 2 - Model BT = 50 K
α CO/N2(Model A) = 20.65 αCO/N 2 (Model B) = 6.07FIG. 3. Comparison of the incorporation isotherms of CO (in grey) and N2(in red) in the case of a sI mixed
clathrate hydrate (3D bulk clathrate without interface) obtained with the two different interaction potentials used for CO (see text): model A (circles and full lines), and model B (triangles and dotted lines). These comparisons are made at two temperatures : 50 K and 150 K. We recall that a value of 0 in an incorporation isotherm means that the hydrate is empty while a value of 1 indicates that the hydrate hosts as many guest molecules as the number of cages composing its structure. The molecular selectivities α, displayed for each model in the bottom left corners, have been determined at the saturation of the clathrate hydrates. The gaseous phase corresponds to a equimolar mixture of CO and N11 2.
by the larger values of αCO/N2 . To conclude, the results of the two tests show that both models A
and B tend to favor the preferential enclathration of CO at the expense of N2, in accordance with
the experimental conclusions regarding the clathrate selectivity in various conditions.44,48 Thus, it
appears that these two models of interaction potentials can, a priori, be used to characterize the trapping of CO by solid water systems.
B. Trapping isotherms of CO at the surface of solid water with the model of Piper et al.42
(model A)
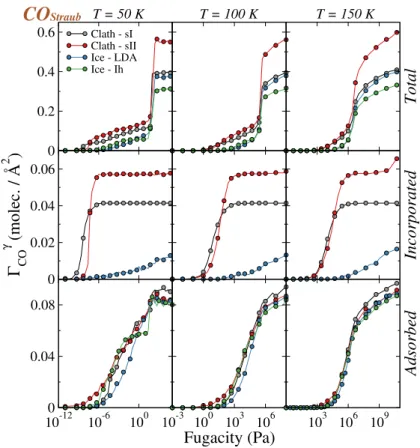
The various trapping isotherms for CO, obtained from the GCMC simulations at 50, 100 and 150 K performed with model A, are shown in Figure 4.
In this Figure, we have normalized the number of CO molecules created in the simulation box, by the geometrical section of the box (perpendicular to the z axis). The isotherms give the surface
concentration ΓCOγ of the CO molecules trapped by the γ solid phase of water (γ = Ih ice, LDA
ice, clathrates) as a function of the fugacity, rather than the average number < NCO> of molecules
in the simulation box :
ΓCOγ =< NCO> 2LγxLγy
(2)
where Lγx and Lγy are the edge sizes, along the x and y directions of the simulation box used to
model the γ solid phase of water. The factor two in the denominator accounts for the two surfaces of the solid water slab. Notice that this normalization has been chosen to directly compare the surface adsorption isotherms. This approach has been used since the main purpose of this study is determining the adsorption properties of different solid water surfaces. Notice however, that such a normalization does not allow a direct comparison between the other types of isotherms since incorporation isotherm also depends on the thickness of the solid water phase.
In the case of CO, irrespective of the temperature, the total isotherms (top row of Figure 4) gradually increase with the fugacity up to a certain value, at which they exhibit an abrupt jump, and above which they remain approximatly constant at 50 K, but are increasing at 100 and 150 K. Moreover, an increase of the temperature leads to a significant shift of the isotherms towards higher
values of the fugacity. The sudden jump of the ΓCOγ curves indicates the condensation of the CO
molecules and, above the corresponding fugacity value, the basic box is filled with CO molecules.
0.2 0.4
0.6 Clath - sIClath - sII Ice - LDA Ice - Ih Total 0.02 0.04 0.06 0.08 Γ CO γ (moléc. / Å 2 ) Incorporated 100-1810-12 10-6 100 0.04 0.08 0.12 10-3 100 103 106 Fugacity (Pa) 10 3 106 109 Adsorbed T = 50 K T = 100 K T = 150 K
CO
PiperFIG. 4. Trapping isotherms obtained in the GCMC simulations when using model A (COPiper). These
isotherms are represented as the surface density, ΓγCO, in the simulation box as a function of the imposed CO fugacity. The results for the four systems considered are represented: sI clathrate in grey, sII clathrate in red, LDA ice in blue, and Ih ice in green. The isotherms are calculated at three temperatures: 50, 100, and 150 K. Note that the top row shows the total isotherms whereas the middle and the bottom rows give the incorporation and surface adsorption isotherms, respectively (see text for the definition of these isotherms).
related to the accessible volume between two periodically replicated water slabs in the simulated systems. At lower fugacity values (i.e., before the jump in the isotherms), which corresponds to the most interesting part of the isotherm when dealing with adsorption, the CO molecules are progressively trapped by the solid water systems. In other words, they are either adsorbed at the surface, or incorporated inside the bulk of the water substrates (with the exception of Ih ice, see below).
The corresponding incorporation isotherms, given in the middle row of Figure 4, show that incorporation into the clathrate is always higher than on LDA ice, irrespective of the fugacity and temperature, as expected. However, whereas the number of CO molecules that are incorporated within the LDA phase gradually increases with the fugacity value, i.e., with the total number of
10-12 10-9 10-6 Fugacity (Pa) 0 0.2 0.4 0.6 0.8 1 Incorporation fraction θ CO Interfaces - sI Interfaces - sII Bulk case - sI Bulk case - sII
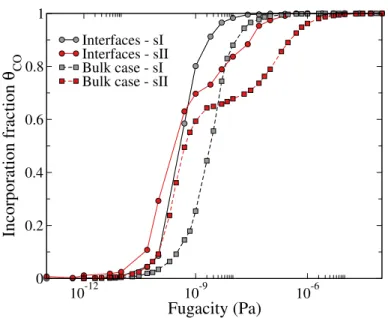
FIG. 5. Comparison of the incorporation isotherms of CO molecules inside the sI and sII clathrate hydrates presenting interfaces, with those simulated for bulk clathrate hydrates, at 50 K and when using model A for calculating the CO-H2O interactions.
CO molecules that are created in the simulation box, it clearly appears limited to a maximum value inside the clathrate, as indicated by the presence of a plateau in the corresponding isotherms. This plateau can be related to the complete filling of all the cages in the corresponding clathrates. Interestingly, note that for sII clathrates, a double plateau is obtained, which is clearly associated to the double occupancy of the large cages of sII as observed and explained in previous experimental
and simulation studies49,50. It is worth mentioning that the number of CO molecules that are
incorporated inside Ih ice remains always vanishingly small, irrespective of the fugacity.
For better understanding the behavior of CO with respect to enclathration, the corresponding incorporation isotherms simulated at 50 K for both hydrate structures (sI and sII) are compared
with those simulated for the bulk clathrate (data taken from Ref.30) and depicted in Figure 5. For
sake of simplicity, in this comparison, the isotherms are given on the form of the incorporation fraction as a function of the fugacity. First, it is worth noticing that, when considering finite systems with interfaces, the corresponding isotherms are shifted towards lower fugacity values when compared to bulk clathrates. This suggests that the interface favors the enclathration of the CO molecules. This interesting result can be associated with the dilation of the hydrate structures along the direction z perpendicular to the interface. Indeed, compared to the bulk case, relaxation of the clathrate structure when creating the interface leads to a size increase of about 17 % and
11 % , along the z axis, for sI and sII, respectively. Moreover, when considering the sII clathrate, the shape of the incorporation isotherms exhibits an inflection, characteristics of an adsorption process with two different energetic sites corresponding to a preferential loading of the small cages
first, then followed by the enclathration into the large cages at higher fugacities.30 Hence, for sII
clathrates, a change of the incorporation fraction corresponding to the inflection, between systems with and without interfaces is also related to the fact that creating the interface increases the ratio between small and large cages in the bulk part of the clathrate, from 66 % for a 3D clathrate to about 70.5 % for the clathrate of finite size.
The surface adsorption isotherms for CO are given on the bottom row of Figure 4. They show the surface concentration of CO molecules that are located at a distance less than 5 Å from the interfacial water molecules at the surface of the four types of solid water considered here, as a function of the fugacity. As it can be seen, the isotherm obtained on Ih ice (green circles) at 50 K rises continuously up to a given value of the fugacity. Above this value, a plateau is obtained in a large fugacity range and corresponds to the formation of a stable adsorption layer. This plateau is followed by a steep rising part of the isotherm, and again by a smoothly rising part before the isotherm ends by a sudden jump corresponding to the condensation. Increasing the temperature leads to a gradual disappearance of the plateau, disappearing almost at 150 K. The isotherm obtained on LDA ice (blue circles) is quite different, because the plateau observed on Ih ice is only evidenced at 50 K and is, so to speak, almost missing at higher temperatures. Instead, the isotherm on LDA ice rises more or less continuously up to the condensation point.
At the gas/clathrate interfaces, the adsorption isotherms for CO start to rise in the same range of very low fugacity values than on Ih and LDA ices, and then continuously rises up to the con-densation point, without any noticeable plateau at 100 and 150 K. However, such a plateau can be
observed in a narrow range of fugacity values around 10−9Pa at 50 K and only for the sI clathrate.
Moreover, the amount of adsorbed CO is always larger at the surface of sII than at the surface of sI clathrates, irrespective of the temperature. An interesting feature observed when comparing incor-poration and surface adsorption isotherms on clathrates is that, at 50 and 100 K, and low fugacity values, the CO molecules start to be adsorbed at the surface before than being incorporated inside the clathrate systems considered, whereas the inverse situation is obtained at 150 K. Moreover, at large fugacity values, the CO molecules are concomitantly adsorbed at the surface and trapped inside the bulk (i.e., incorporated) of the clathrates. Finally, it is worth mentioning that up to the condensation point, negligible fraction of the CO molecules stay isolated from the water sytems
in the vapor phase.
To understand the behavior of the CO molecules adsorbed at the surface of solid water, as
re-vealed by the adsorption isotherms decribed above, we have analysed 104 sample configurations
of the system simulated at 50 K and at two fugacity values, namely 10−9 and 5 × 10⁻² Pa,
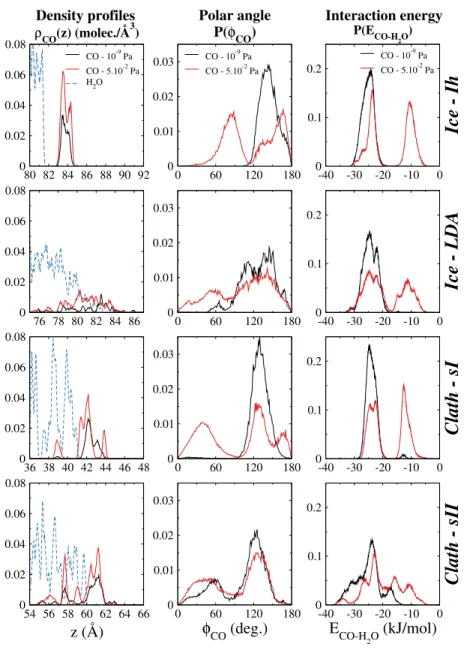
corre-sponding to very different amounts of adsorbed CO molecules. These results are given in Figure 6. For analyzing the arrangement of the CO molecules, their number density profile along the surface normal axis z has been calculated and shown in the left panels of Figure 6. For reference, the density profile of the interfacial water molecules is also indicated on this figure. In addition, the orientation of the adsorbed CO molecules has been characterized by the analysis of the polar
angle φCOformed between the surface normal and the molecular axis, in such a way that the value
φCO= 0 corresponds to an orientation of the CO axis parallel to the surface normal axis, the O
atom being closer to the water surface than the C atom. Finally, we have also calculated the
ad-sorption energy of the CO molecules, defined as the energy ECO−H2Oof their interaction with the
water molecules. The corresponding angular and energy distributions P(φCO) and P(ECO−H2O)
are given in the middle and right panels of Figure 6, respectively.
At the surface of Ih ice, and for a fugacity value of 10−9 Pa corresponding to the plateau of
the CO adsorption isotherm at 50 K, the number density profile of the CO molecules exhibits one main peak. It indicates that most of the CO molecules are located at about 2 Å above the water molecules of the surface. For this fugacity value, all the CO molecules point their C atoms toward the water surface, the CO molecular axis being tilted with respect to the surface normal axis, as shown by the single peak of the corresponding angular distribution function obtained at the value
φCO∼ 140◦. Similarly, the single peak calculated in the energy distribution function indicates that
the adsorption energy in this configuration of the CO molecules is equal to about −25 kJ/mol. At
the higher fugacity value of 5 × 10⁻²Pa corresponding to the rising part of the adsorption isotherm
observed after the plateau, a second peak is observed in the number density profile, located ap-proximately 1 Å higher than the first one, that can be related to the peaks observed at the values
φCO = 90◦ and ECO−H2O= −10 kJ/mol in the corresponding angular and energy distributions,
respectively. Worthwile to emphasize is that, at this fugacity value, two adsorption sites are then clearly evidenced, the first one being closer to the surface than the second one. In this second adsorption site, the CO molecules are adsorbed perpendicular whereas in the first adsorption site, they are adsorbed nearly parallel to the surface normal axis, respectively, as indicated by the shift
the surface a slight reorientation of the CO molecules is observed with respect to the situation obtained at lower fugacity values, the corresponding adsorption energy does not change by more
than 1 kJ/mol (see P(ECO−H2O)).
The situation appears somewhat more complex at the surface of LDA ice, at least when analysing the number density profiles. Indeed, for the two fugacity values considered here, the CO number density profiles are characterized by a wide distribution of peaks, even located in the z range where the water density does not drop to zero. This could be related to the strong corrugation of the LDA ice surface. The wide peak obtained in the angular distribution function
at the fugacity value of 10−9 Pa indicates that, although many orientations are calculated, most of
the CO molecules are adsorbed with their C atom preferentially located closer to the water surface than their O atom. These configurations correspond to an adsorption energy value of about −25
kJ/mol. At the higher fugacity value of 5 × 10⁻²Pa (corresponding to a larger number of adsorbed
CO molecules), the additional CO molecules are characterized by a higher value of the adsorption
energy of around −12 kJ/mol, with orientations corresponding to φCO∼ 50◦ as indicated by the
second, wide peak evidenced in P(φCO).
At the surface of sI clathrate at 50 K, and for the fugacity value of 10−9Pa corresponding to the
region where a plateau is calculated in the adsorption isotherm of CO, the analysis of the configu-rations issued from the simulations show that all the CO molecules have a similar tilted orientation
(around φCO= 130◦, see middle panel of Figure 6) corresponding to an adsorption energy of about
−25 kJ/mol (right panel of Figure 6). These configurations look like those observed at the surface of Ih and LDA ices. Moreover, the number density profile given in the left panel of Figure 6 shows that most of the CO molecules are located outside the region where the water density drops to zero. Taking into account that the surface of the clathrate contains full and semi-cages (see Figure 1), this indicate that, at low fugacity values, the CO molecules preferentially adsorb on top of the full cages of the sI clathrate, where they can form a layer before other sites at the surface are
occupied. Then, at the higher fugacity value of 5 × 10⁻² Pa for which much more molecules are
adsorbed, the additional CO also bind to the surface of the semi-cages, as indicated by the grow-ing peak obtained at around 39 Å in the number density profile of CO. In these new positions, the
CO molecular axis is now tilted by φCO∼ 40◦, with a corresponding adsorption energy of ∼ −12
kJ/mol. The situation is different at the surface of sII clathrate where, for the two fugacity val-ues considered here, the CO molecules can adsorb on full and semi-cages, without any noticeable preference, as shown by the multiple peaks in the number density profile of CO, that are located
both outside and inside the range where the water density drops to zero. In these positions, the CO
molecules exhibit two preferential orientations (φCO∼ 60◦ and φCO∼ 120◦), corresponding to a
wide range of adsorption energies, as shown by P(ECO−H2O). Indeed, three main peaks located at
around −30, −25 and −17 kJ/mol, and five peaks at around −35, −27, −22, −15 and −10 kJ/mol
are evidenced in the energy distribution functions of CO, for the fugacity values of 10−9 Pa and
5 × 10⁻²Pa, respectively.
Interestingly, whereas the CO behavior seems quite similar at the surface of sI clathrate and Ih ice, it is rather different at the surface of sII clathrate where the binding energy with the water environment appears stronger and the number of possible adsorption sites larger. This can explain the larger amount of CO molecules adsorbed at the surface of sII clathrate, irrespective of the fugacity value, as exhibited by the corresponding isotherm (Figure 4).
C. Trapping isotherms of CO at the surface of solid water with the model proposed by
Straub and Karplus43 (model B)
The total, incorporation and surface adsorption isotherms simulated by the GCMC method
when the CO - H2O interactions are represented by model B are given in Figure 7. Although these
isotherms exhibit shapes roughly similar to those calculated with model A, noticeable differences are however obtained. First, both the fugacity values at which the isotherms depart from zero and at which condensation is observed are shifted to higher values when using model B irrespective of the temperature. This is particularly true when considering Ih and LDA ices. Moreover, the incorporation into LDA ice appears less favored with this model than with model A, because as the fugacity increases, the number of CO molecules that are trapped into the bulk of LDA ice is smaller. In addition, model B leads to a preferential incorporation of CO into sI clathrate, as indicated by the smaller value of the fugacity at which the corresponding isotherm starts to rise in this case, with respect to what is calculated for the isotherm of sII clathrate (this is specifically observed at 50 and 100 K). Note that the inverse situation is observed when model A is used. Simi-larly, the values of the fugacity at which the incorporation isotherms for clathrates depart from zero are in the same range than those at which the corresponding isotherm start to show CO adsorp-tion at the clathrate surfaces. This indicates that bulk incorporaadsorp-tion and surface adsorpadsorp-tion may be competitive processes for clathrates when the CO-water interaction is described with model B. Furthermore, in the case of the sII clathrate at 50 K, the lack of any inflection at intermediate
values of the fugacity indicates that there is no difference between incorporation into small and large cages when model B model is used in the simulations, in contrast to what is calculated with model A. Finally, it is interesting to focus on the adsorption behavior at the surface of the four solid water systems considered here. The corresponding adsorption isotherms are thus much more similar when model B is used than when the CO-water interactions are represented by model A, with the noticeable exception of the adsorption isotherm on Ih ice at 50 K. Indeed, this isotherm still exhibits a well-defined plateau before condensation is obtained, indicating the formation of a stable monolayer at the ice surface. Notice however that the corresponding isotherm is charac-terized by two plateaus at intermediate and high values of the fugacity when using model A (see Fig. 4), a feature which has been related to two different values of the adsorption energy (i.e., two different adsorption sites) at the surface of ice with this model.
As in the previous paragraph, we have thus analysed the adsorption configurations of the CO molecules that are adsorbed at the surface of solid water, by calculating their number density pro-file and the distributions of both their polar angle and interaction energy with the water molecules (Figure 8). These analyses have been performed at 50 K and at only one fugacity value of 1 Pa, i.e., in the fugacity range where the plateau is observed in the adsorption isotherm, that could correspond to the formation of one stable, adsorbed layer of CO molecules on Ih ice. For this fugacity, the number density profile of the CO molecules exhibits one single peak, only, indicating that the CO molecules are located at about 2 Å above the water molecules of the surface of Ih ice. At this distance from the ice surface, two peaks are obtained in the corresponding angular
distribution function, indicating that the CO molecules point either their C atom (φCO= 120◦) or
their O atom (φCO= 60◦) toward the water molecules, this second orientation being less favored.
The corresponding adsorption energy for these two configurations appears similar, as shown by the single broad peak calculated in the energy distribution function at around −12.5 kJ/mol. Similar conclusions are obtained at the surface of the other solid water systems, where only one adsorption site is also evidenced (at least, from an energetic point of view), characterized by similar adsorp-tion energy when considering clathrates, and by slightly weaker CO–water interacadsorp-tions (around −8.0 kJ/mol) on LDA ice. Notice that this feature can explain why the isotherms for these four solid water systems are similar when model B is used. These results are very different from those obtained with model A, for which different adsorption sites are obtained, corresponding to a large range of adsorption energies (as detailed above).
D. Trapping isotherms of N2at the surface of solid water
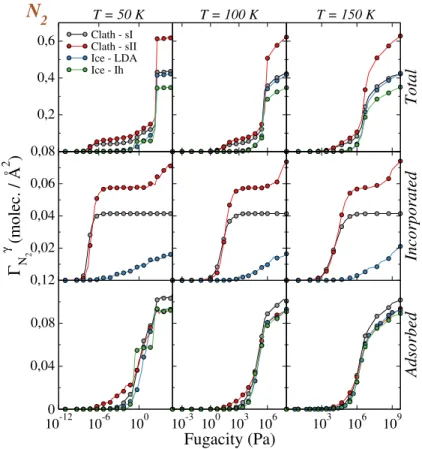
When considering the situation of N2 in contact with the various solid water sytems studied
here, the corresponding isotherms (Figure 9) show that the trapping of this molecule starts at higher fugacity values than for CO, especially when considering the results obtained with model A for the CO-water interaction (Figure 4). Moreover, the comparison between the incorporation
and surface adsorption isotherms indicates that the N2 molecules are preferentially incorporated
inside the bulk of the sI and sII clathrates rather than being adsorbed at their surface, irrespective
of the temperature. In addition, non-negligible amount of N2 can be dissolved inside LDA and
this dissolution becomes even more pronounced with increasing temperature. When focusing on the adsorption process at the surface of solid water, only the adsorption isotherm on Ih ice at 50 K exhibits a plateau in a very narrow range of fugacity values. This indicates that the formation of a
stable layer of N2at the surface of solid water is a rather unfavorable phenomenon.
Nevertheless, we have performed a detailed analysis of the N2adsorption at a fugacity value of
10 Pa corresponding to the region of this plateau in the adsorption isotherm of Ih ice at 50 K. The
corresponding number density profile, angular (P(φN2), and energy (P(EN2−H2O)) distributions
are given in Figure 10. For this fugactiy value of 10 Pa, the N2 molecules form a single layer at
the surface of Ih ice, as indicated by the single peak observed in the number density profile of
N2, at about 2.25 Å above the water molecules of the surface, indeed. Within this layer, the N2
molecules are oriented in such a way that their molecular axis is tilted by about 70◦ with respect
to the surface normal axis (in fact, P(φN2) exhibits two peaks at 70
◦ and 110◦, that correspond to
the same tilt angle due to the symmetry of the molecule), and this configuration is characterized by an adsorption energy value of about −8 kJ/mol. Similar weak values of the adsorption energy are calculated at the surface of LDA ice (around −7 kJ/mol) and of sI clathrate (between −5 and
−11 kJ/mol) . Nonetheless, above sII clathrate, the corresponding energy distribution for N2 is
rather characterized by a wide peak ranging between −5 and −15 kJ/mol. This indicates that stronger adsorption sites, probably located at the surface of semi-cages, may exist on sII clathrate.
However, the adsorption of N2 at the surface of solid water appears less favorable than for CO on
E. Competitive trapping between CO and N2when considering a mixed gas phase
The adsorption phenomenon at the surface of solid water systems in contact with a gas phase
containing an equimolar mixture of CO and N2has also been investigated by using GCMC
simula-tions. Note that for these simulations, we have restricted the explored fugacity range to values that
are below those for which 3D condensation is obtained. Thus, in this fugacity range, the CO-N2
mixture behaves as an ideal mixture,30allowing to fix the composition of the mixture by imposing
given partial fugacities. Let us first comment the adsorption isotherms, simulated at 50, 100, and 150 K and that are given on Figures 11 and 12, for the models proposed by Piper et al. (model
A)42 and by Straub and Karplus (model B),43 respectively. A general feature for the four solid
water surfaces considered is the clear preferential adsorption of CO, with respect to N2, for both
models, irrespective of the fugacity value and temperature. Only a small, although non negligible,
amount of N2can be adsorbed at the highest fugacity values and at 150 K, when model A is used,
and from 100 K with the other model. In addition, the maximum amount of N2molecules that can
be adsorbed does not depend on the model used to describe the CO-water interactions. The main differences between the two CO-water models are observed when looking at the surface adsorp-tion isotherms of CO, as expected. These isotherms are in fact very close to those calculated when
the gas phase contains only CO molecules, due to the negligible adsorption of N2molecules, and
thus, the corresponding outcomes are similar to that has been already discussed in the preceding paragraphs. Anyway, the main conclusion of these analyses is that the adsorption phenomenon at the surface of solid water is highly selective, and strongly favors the trapping of CO at the expense of N2.
When considering now the competitive incorporation inside the bulk of solid water, neither
CO or N2 molecules are significantly incorporated into ice Ih, irrespective of the model used to
calculate the CO-water interactions. In the same way, only a vanishingly small number of N2
molecules are dissolved inside the bulk phase of LDA ice. However, when using model A (results not shown), LDA ice can incorporate a small number of CO molecules. On the contrary, when
using model B, LDA ice can incorporate rather significant, and similar, numbers of CO and N2
molecules, even at 50 K, a temperature at which no N2molecule is adsorbed at the surface of LDA
ice. Moreover, increasing the temperature strongly favors the dissolution of N2 into LDA ice at
the expense of CO, at 150 K. Thus, with model B, LDA ice appears selective for CO at its surface,
at the expense of N2, and selective for N2in its bulk, at the expense of CO.
Finally, the incorporation into the clathrates has been simulated and the corresponding isotherms are shown on Figure 13 for GCMC calculations performed with the two models used to described
the CO-water interactions. The corresponding molecular selectivities αCO-N2
44 are also given in
Table II.
In general, the incorporation into both sI and sII clathrates appears as a selective process that favors the CO molecule, irrespective of the fugacity and of the temperature, when model A is
used. Indeed, in this case, the number of N2molecules that can be incorporated into the clathrate
cages remains always much smaller than the corresponding number of CO molecules. This is also observed with model B, for the sI clathrate, although the values of the selectivity are much lower in this case. In addition, when using this model, the selectivity value for sII clathrate at 100 and 150 K becomes less than one, indicating in this situation, a (slighlty) preferential incorporation of
N2with respect to CO (at least, in the conditions of the present simulations).
To quantify the influence of the cage relaxation processes on the competitive adsorption of CO
with respect to N2, we have also performed similar GCMC simulations by considering rigid slabs
of clathrates. The results are given here in terms of selectivity (see Table II), the values of which showing that the influence of flexibility on the results appears much stronger when using model A, than when using model B to calculate the CO-water interactions. Thus, rigid slabs of clathrates are much less selective with respect to CO than the corresponding flexible systems, when using the former model, whereas no significant difference is observed when using the latter one. Note that when using model B to calculate the CO-water interactions, the selectivity values for rigid sI clathrates are however slightly higher than for the flexible ones. They also remain less than one
for sII clathrates at 100 and 150 K, indicating a favored incorporation of N2in these cases.
For enhancing our understanding of these processes, we have also performed simulations with
infinite, 3D, bulk clathrate systems with model A, as in our previous works.30,44The corresponding
selectivity values (see Table II) are then very similar to those obtained with rigid 2D systems. Moreover, considering thicker slabs of clathrates in the simulations (namely, 2 × 2 × 3, 2 × 2 × 4 and 2 × 2 × 5 unit cells, instead of the original 2 × 2 × 2 one) does not have any significant influence on the clathrate selectivity in this case. These features confirm than the main influence of the gas/clathrate interface on the clathrate selectivity comes from the cage relaxation following the creation of the interface. Indeed, as already mentioned above, the size of the clathrate cages is larger in the relaxed 2D than in infinite 3D systems, a difference that reinforces the selectivity for
F. Discussions
Adsorption of N2 and CO molecules on crystalline and amorphous ices, in particular in low
temperature conditions, has been investigated, especially at the beginning of the 2000s, using both
experimental and theoretical approaches51–59. In these studies, N2 was found to weakly adsorb
at the surface of ice with adsorption energy values ranging between 8 and 9.5 kJ/mol2,53,55,59, in
good agreement with the GCMC results reported here.
By contrast, when considering adsorption of CO on ice, some differences are evidenced be-tween the present simulation results and previous conclusions, especially when using the model
proposed by Piper et al (model A).42 Indeed, it has been experimentally shown that the CO
molecules can form a stable monolayer at the surface of crystalline ice, corresponding to an
en-thalpy of about 10 kJ/mol.2,54,58 Similar results were also evidenced at the surface of amorphous
ice, with an adsorption energy of 11.3 kJ/mol.2,52,54,55,58These conclusions are supported by
quan-tum calculations which showed, in addition, that although the CO molecules can exhibit different adsorbed configurations at the surface of ice, the corresponding calculated adsorption energies
always remain around 10 kJ/mol.51,52,54 Therefore, we can conclude that the present GCMC
re-sults support the existence of adsorption sites corresponding to an adsorption energy of about 10 kJ/mol, at the surface of both Ih and LDA ices. However, the second, much more attractive site around 25 kJ/mol evidenced by our GCMC simulations when using model A, has neither been observed by experiments nor in the results of quantum calculations. Undoubtedly, GCMC results, as for any sort of simulation calculations, are model dependent and, this second adsorption site is related to the tendency of model A to favor strong electrostatic binding between CO and the dangling H atoms at the ice surface. Then, model A certainly leads to an overestimation of the
CO-H2O interactions at the surface of ice, especially of the electrostatic contribution, due to the
charge distribution of the model. However, it is worth noticing that this model has been shown to
accurately represent experimental results when used to simulate CO clathrate hydrates30,44. More
specially, it has been proven to always favor the enclathration of CO at the expense of N2 when
considering a gas phase that contains mixtures of these two gases, in accordance with experimental
conclusions.44,48 An explanation could be that, inside the clathrate cages, water H atoms are
in-volved in the H-bonding network of the water molecules and thus, not directly available for pairing with the CO molecules. In this situation, the enclathrated CO molecules remain farther from the water molecules than at the ice surface, thus likely lowering the interaction. These features seem
thus to indicate that, although well-suited for modeling CO incorporation into clathrates, model A may not be transferable to accurate simulations of the CO adsorption at the surface of solid water.
On the contrary, when using the model proposed by Straub and Karplus (model B)43 for
cal-culating the CO-water interactions at the surface of ice, only one adsorption site is evidenced, with adsorption energy values of about −12.5 kJ/mol and −8 kJ/mol, on Ih and LDA ices, respec-tively. These values agree quite well with those determined from both experiments and quantum
calculations.2,54,58 Moreover, the prefered configurations for the adsorbed CO molecules on ice
determined in the present GCMC calculations with this model are also in accordance with the
re-sults of quantum calculations.54 Thus, model B appears well-suited for an accurate description of
the CO adsorption at the surface of solid water systems. The situation is a little bit more compli-cated when considering the incorporation into clathrates in the case where the gas phase contains
a mixture of CO and N2 molecules. Indeed, although model B43 performs qualitatively well for
clathrates forming sI structures, it does not reproduce the experimentaly measured selectivity at 150 K at low CO molar fractions, i.e., when the corresponding clathrates are supposed to form a
sII structure.44
We can thus conclude that whereas one of the model used in the present simulations seems
accurate enough to characterize the incorporation of CO into clathrates (model A)42, it fails at
reproducing the previously measured and calculated adsorption energies at the surface of ice (un-fortunately, no experimental measurements nor quantum calculations are available for the
adsorp-tion energy of CO and N2 at the surface of clathrates). The inverse situation is obtained with the
other model (model B)43which gives accurate results when considering adsorption at the surface,
and more controversial conclusions inside clathrates. This could be related to the subtle balance between the attractive and repulsive parts of these interaction potential models. Indeed, when in-corporated into the clathrate cages, the CO molecule is located at larger distances from the water molecules than when being adsorbed at the surface of solid water. Thus, this molecule explores rather the long-range attractive part of the interaction potential in the former situation, whereas it is very sensitive to the short-range, repulsive part of the potential in the second one.
IV. CONCLUDING REMARKS
In the present paper, we make use of GCMC simulations to characterize the adsorption of CO
and sI and sII clathrates, at temperatures relevant for astrophysics.
The present GCMC calculations evidence the influence of the CO-water interaction model on
the results, as already previously shown for N2.45Indeed, whereas the model of Piper et al. (model
A)42appears well-suited for characterizing incorporation of CO molecules into clathrates, the one
proposed by Straub and Karplus43 (model B) seems more accurate for characterizing adsorption
at the surface of solid water. This enlightens the need for an interaction potential model between carbon monoxide and water molecules that could be transferable to different water environments. Such a model should take explicitely into account the polarizability of the interacting molecules. More generally, an in-depth evaluation of the force field model for CO and N2, ombined with the selected water model, could be based on the reproduction of the experimental hydration free energy.
Anyway, the results of the simulations show that the adsorption of CO on solid water surfaces
is energetically more favorable than that of N2, in accordance with previous experimental
conclu-sions. Also, in general, adsorption at the surface appears more likely than incorporation into the bulk of these systems, although for clathrates the situation may depend on the temperature. As a
consequence, when considering a gas phase that contains mixtures of CO and N2 molecules, the
water substrate appears strongly selective for CO at the expense of N2. This information could be
useful to complement our understanding of the formation conditions of some comets, for which
the N2/CO ratio has been used to infer the temperature at which they have been built from
ag-glomeration of icy grains.34,60It is noteworthy to mention that in real environment, incorporation
of CO and N2molecules should also be considered in cages of clathrate structures that have been
stabilized by some other guest molecules.61 Further works in that direction are thus currently in
progress .
V. ACKNOWLEDGMENTS
This project is supported by the French National Research Agency (ANR) in the framework of the MI2C project (ANR-15CE29-0016). Calculations have been performed thanks to the com-putational resources of the Centre de Calcul from the UBFC (Dijon-France). Prof. Jedlovszky (Department of Chemistry, Eszterházy Károly University, Eger, Hungary) is gratefully acknowl-edged for sending us the initial coordinate files of water molecules in LDA ice.
REFERENCES
1V. Kotwicki, Hydrolog. Sci. J. 36, 49 (1991).
2T. Hama and N. Watanabe, Chem. Rev. 113, 8783 (2013).
3T. Encrenaz, Searching for Water in the Universe (Spinger-Verlag, New York, USA, 2007).
4T. Encrenaz, Annu. Rev. Astron. Astrophys. 46, 57 (2008).
5F. Postberg, J. Schmidt, J. Hillier, S. Kempf, and R. Srama, Nature 474, 620 (2011).
6R. Orosei, S. Lauro, E. Pettinelli, A. Cicchetti, M. Coradini, B. Cosciotti, F. Di Paolo, E. Flamini,
E. Mattei, M. Pajola, F. Soldovieri, M. Cartacci, F. Cassenti, A. Frigeri, S. Giuppi, R. Martufi, A. Masdea, G. Mitri, C. Nenna, R. Noschese, M. Restano, and R. Seu, Science 361, 490 (2018).
7E. Sloan and C. Koh, Clathrate Hydrates of Natural Gases, Third Edition (CRC Press, Boca
Raton, USA, 2008).
8E. Dartois and D. Deboffle, Astron. Astrophys. 490, L19 (2008).
9O. Mousis, E. Chassefière, N. Holm, A. Bouquet, J. Waite, W. Geppert, S. Picaud, Y. Aikawa,
M. Ali-Dib, P. Rousselot, and L. Ziurys, Astrobiology 15, 308 (2015).
10C. Salzmann, J. Chem. Phys. 150, 060901 (2019).
11T. Bartels-Rausch, V. Bergeron, J. Cartwright, R. Escribano, J. Finney, H. Grothe, P.
Gutiér-rez, J. Haapala, W. Kuhs, J. Pettersson, S. Price, C. Sainz-Diaz, D. Stokes, G. Strazulla, and E. Thomson, Rev. Mod. Phys. 84, 885 (2012).
12D. Williams and E. Herbst, Surf. Sci. 500, 823 (2002).
13H. Cuppen, C. Walsh, T. Lamberts, D. Semenov, R. T. Garrod, E. Penteado, and S. Ioppolo,
Space Sci. Rev. 212, 1 (2017).
14U. Meierhenrich, Amino Acids and the Asymmetry of Life (Spinger-Verlag, Berlin/Heidelberg,
2008).
15E. Kadyshevich and V. Ostrovskii, J. Therm. Anal. Calorim. 95, 571 (2009).
16A. Brack, Adv. Space Res. 24, 417 (1999).
17W. Schutte, Book Series: IAU Symposia 178, 331 (1997).
18E. Dartois, Book Series: Astronomical Society of the Pacific Conference Series 414, 411 (1999).
19S. Picaud and P. Jedlovszky, Mol. Sim. 45, 403 (2019).
20M. Allen and D. Tildesley, Computer simulation of liquids (Oxford science publications, Oxford,
1987).
22H. Tanaka, Fluid Phase Equilib. 144, 361 (1998).
23V. V. Sizov and E. M. Piotrovskaya, J. Phys. Chem. B 111, 2886 (2007).
24S. J. Wierzchowski and P. A. Monson, J. Phys. Chem. B 111, 7274 (2007).
25K. Katsumasa, K. Koga, and H. Tanaka, J. Chem. Phys. 127, 044509 (2007).
26N. I. Papadimitriou, I. N. Tsimpanogiannis, A. Papaioannou, and A. K. Stubos, J. Phys. Chem.
C 112, 10294 (2008).
27S. Lectez, J.-M. Simon, O. Mousis, S. Picaud, K. Altwegg, M. Rubin, and J. M. Salazar, ApJ
805, L1 (2015).
28D. Jin and B. Coasne, Langmuir 33, 11217 (2017).
29B. Fàbiàn, S. Picaud, P. Jedlovszky, A. Guilbert-Lepoutre, and O. Mousis, ACS Earth Space
Chem. 2, 521 (2018).
30A. Patt, J.-M. Simon, S. Picaud, and J. M. Salazar, J. Phys. Chem. C 122, 18432 (2018).
31X. Li, A. Heays, R. Visser, W. Ubachs, B. Lewis, S. Gibson, and E. van Dishoeck, Astron.
Astrophys. 555, A14 (2013).
32X. Li, T. Millar, C. Walsh, A. Heays, and E. van Dishoeck, Astron. Astrophys. 568, A111
(2014).
33G. W. Fuchs, H. M. Cuppen, S. Ioppolo, C. Romanzin, S. E. Bisschop, S. Andersson, E. van
Dishoeck, and H. Linnartz, Astron. Astrophys. 505, 629 (2009).
34M. Rubin, K. Altwegg, H. Balsiger, A. Bar-Nun, J. Berthelier, A. Bieler, P. Bochsler, C. Briois,
U. Calmonte, M. Combi, J. De Keyser, F. Dhooghe, P. Eberhardt, B. Fiethe, S. Fuselier, S. Gasc, T. Gombosi, K. Hansen, M. Hässig, A. Jäckel, E. Kopp, A. Korth, L. Le Roy, U. Mall, B. Marty, O. Mousis, T. Owen, H. Rème, T. Sémon, C. Tzou, J. Waite, and P. Wurz, Science 348, 232 (2015).
35J. S. V. Buch, P. Sandler, The Journal of Physical Chemistry B 102, 8641 (1998).
36R. F. J.D. Bernal, The Journal of Chemical Physics 1, 515 (1933).
37R. Horvàth, G. Hantal, S. Picaud, M. Szöri, and P. Jedlovszky, J. Phys. Chem. A 122, 3398
(2018).
38B. Kiss, S. Picaud, M. Szöri, and P. Jedlovszky, J. Phys. Chem. A (2019).
39F. Takeuchi, M. Hiratsuka, R. Ohmura, S. Alavi, A. K. Sum, and K. Yasuoka, J. Chem. Phys.
138 (2013), 10.1063/1.4795499.
40H. W. Horn, W. C. Swope, J. W. Pitera, J. D. Madura, T. J. Dick, G. L. Hura, and T.
Head-Gordon, J. Chem. Phys. 120, 9665 (2004). 27
41J. J. Potoff and J. I. Siepmann, AIChE J. 47, 1676 (2001).
42J. Piper, J. Morrison, and C. Peters, Mol. Phys. 53, 1463 (1984).
43J. Straub and M. Karplus, Chem. Phys. 158, 221 (1991).
44C. Petuya, A. Patt, J.-M. Simon, S. Picaud, J. M. Salazar, and A. Desmedt, J. Phys. Chem. C
124, 11886 (2020).
45V. Ballenegger, J. Phys. Chem. C 123, 16757 (2019).
46P. Ungerer, B. Tavitian, and A. Boutin, Applications of Molecular Simulation in the Oil and Gas
Industry : Monte Carlo Methods(Editions Technip - IFP Publications, Paris, France, 2005).
47L. Pàrtay, G. Hantal, P. Jedlovszky, A. Vincze, and G. Horvai, J. Comp. Chem. 29, 945 (2008).
48C. Petuya and A. Desmedt, J. Phys. Chem. C 123, 4871 (2019).
49C. Petuya, F. Damay, D. Talaga, and A. Desmedt, J. Phys. Chem. C 121, 13798 (2017).
50A. Patt, Simulation moléculaire d’hydrates de gaz mixtes en conditions astrophysiques, Ph.D.
thesis, Université Bourgogne Franche-Comté (2020).
51A. Allouche, P. Verlaque, and J. Pourcin, J. Phys. Chem. B 102, 89 (1998).
52C. Manca, P. Roubin, and C. Martin, Chem. Phys. Lett. 330, 21 (2000).
53C. Manca and A. A, J. Chem. Phys. 114, 4226 (2001).
54C. Manca, C. Martin, A. Allouche, and P. Roubin, J. Phys. Chem. B 105, 12861 (2001).
55C. Martin, C. Manca, and P. Roubin, Surf. Sci. 502-503, 275 (2002).
56C. Martin, C. Manca, and P. Roubin, Surf. Sci. 502-503, 280 (2002).
57A. Al-Halabi, A. Kleyn, E. van Dishoeck, M. van Hemert, and G. Kroes, J. Phys. Chem. A 107,
10615 (2003).
58J. Noble, E. Congiu, F. Dulieu, and H. Fraser, Mont. Not. R. Astron. Soc. 421, 768 (2012).
59E. Fayolle, J. Balfe, R. Loomis, J. Bergner, D. Graninger, M. Rajappan, and K. Öberg,
Astro-phys. J. Lett. 816, L28 (2016).
60T. O. A. Bar-Nun, G. Notesco, Icarus 190, 655 (2007).
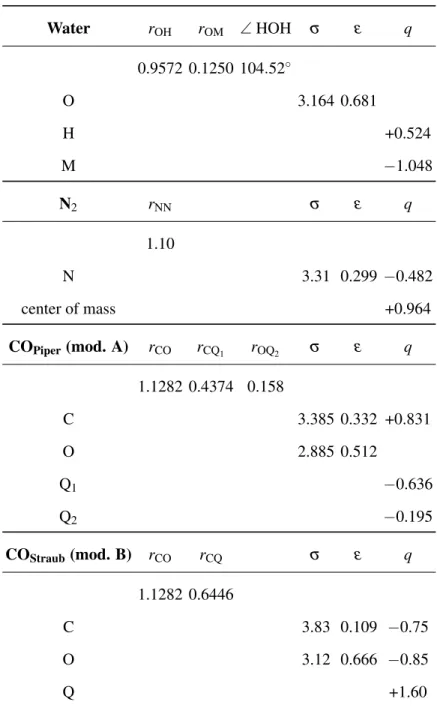
Water rOH rOM ∠ HOH σ ε q 0.9572 0.1250 104.52◦ O 3.164 0.681 H +0.524 M −1.048 N2 rNN σ ε q 1.10 N 3.31 0.299 −0.482 center of mass +0.964 COPiper(mod. A) rCO rCQ1 rOQ2 σ ε q 1.1282 0.4374 0.158 C 3.385 0.332 +0.831 O 2.885 0.512 Q1 −0.636 Q2 −0.195 COStraub(mod. B) rCO rCQ σ ε q 1.1282 0.6446 C 3.83 0.109 −0.75 O 3.12 0.666 −0.85 Q +1.60
TABLE I. Parameters of the interaction potentials used in the GCMC simulations, for the water40, N241,
and CO42,43molecules. Note that, besides O and H atoms, the water model involves a fourth interaction site (M) displaced from the O position, along the molecular axis. Models A and B for CO involves the C and O atoms and one (model B)43or two (model A)42additional sites Qi, located along the molecular axis.
Distances and σ are given in Å, ε in kJ/mol and charges in atomic units.
80 82 84 86 88 90 92 0 0.02 0.04 0.06 0.08 CO - 10-9 Pa CO - 5.10-2 Pa H2O 0 60 120 180 0 0.01 0.02 0.03 CO - 10-9 Pa CO - 5.10-2 Pa -40 -30 -20 -10 0 0 0.1 0.2
Ice - Ih
CO - 10-9 Pa CO - 5.10-2 Pa 76 78 80 82 84 86 0 0.02 0.04 0.06 0.08 0 60 120 180 0 0.01 0.02 0.03 -40 -30 -20 -10 0 0 0.1 0.2Ice - LDA
36 38 40 42 44 46 48 0 0.02 0.04 0.06 0.08 0 60 120 180 0 0.01 0.02 0.03 -40 -30 -20 -10 0 0 0.1 0.2Clath - sI
54 56 58 60 62 64 66 z (Å) 0 0.02 0.04 0.06 0.08 0 60 120 180 φCO (deg.) 0 0.01 0.02 0.03 -40 -30 -20 -10 0 ECO-H 2O (kJ/mol) 0 0.1 0.2Clath - sII
Density profiles Polar angle Interaction energy
ρCO(z) (molec./Å3) P(φCO) P(ECO-H2O)
FIG. 6. Results of the statistical analyses performed on the CO molecules (model A) adsorbed at the four different surfaces of solid water, at 50 K. The left column shows the number density profiles, ρCO(z), along
the interface normal axis (for reference, the number density profiles of H2O are also displayed, in blue). The
middle column gives the distributions of the polar angle, φCO, formed between the molecular axis and the
surface normal. The right column displays the distributions of the interaction energy between CO and H2O,
ECO-H2O. From top to bottom, the results are shown for Ih ice, LDA ice, sI and sII clathrates, respectively, and for two CO fugacity values: 10−9Pa in black, and 5 × 10⁻²Pa in red.