HAL Id: hal-01865249
https://hal.archives-ouvertes.fr/hal-01865249
Submitted on 31 Aug 2018
HAL is a multi-disciplinary open access
archive for the deposit and dissemination of
sci-entific research documents, whether they are
pub-lished or not. The documents may come from
teaching and research institutions in France or
abroad, or from public or private research centers.
L’archive ouverte pluridisciplinaire HAL, est
destinée au dépôt et à la diffusion de documents
scientifiques de niveau recherche, publiés ou non,
émanant des établissements d’enseignement et de
recherche français ou étrangers, des laboratoires
publics ou privés.
Summarizing Large Scale 3D Mesh
Imeen Salah, Sebastien Kramm, Cédric Demonceaux, Pascal Vasseur
To cite this version:
Imeen Salah, Sebastien Kramm, Cédric Demonceaux, Pascal Vasseur. Summarizing Large Scale 3D
Mesh. IEEE/RSJ Int. Conf. on Intelligent Robots and Systems - IROS, Oct 2018, Madrid, Spain.
�hal-01865249�
Summarizing Large Scale 3D Mesh
Imeen Ben Salah
1, S´ebastien Kramm
1, C´edric Demonceaux
2and Pascal Vasseur
2,11
Laboratoire d’Informatique, de Traitement de l’Information et des Syst`emes
Normandie Univ, UNIROUEN, UNIHAVRE, INSA Rouen, LITIS, 76000 Rouen, France
2
Laboratoire Le2i, ERL VIBOT CNRS 6000, Universit´e Bourgogne Franche-Comt´e
Abstract— Recent progress in 3D sensor devices and in semantic mapping allows to build very rich HD 3D maps very useful for autonomous navigation and localization. How-ever, these maps are particularly huge and require important memory capabilities as well computational resources. In this paper, we propose a new method for summarizing a 3D map (Mesh) as a set of compact spheres in order to facilitate its use by systems with limited resources (smartphones, robots, UAVs, ...). This vision-based summarizing process is applied in a fully automatic way using jointly photometric, geometric and semantic information of the studied environment. The main contribution of this research is to provide a very compact map that maximizes the significance of its content while maintaining the full visibility of the environment. Experimental results in summarizing large-scale 3D map demonstrate the feasibility of our approach and evaluate the performance of the algorithm.
I. INTRODUCTION
Environment mapping is a challenging and important question that has been widely discussed in mobile robotics research. Most of the early vision-based navigation systems need a map that contains a sufficient level of detail for an ac-curate navigation. Over the last few years, the introduction of High-Definition (HD) [20] and semantic maps have greatly participated in the large commercial success of navigation and mapping products and also in the enhancement of data fusion based localization algorithms. Several digital map suppliers like TomTom and HERE are now providing HD maps with very high navigation accuracy, especially in challenging urban environments. These HD maps provide a detailed representation of the environment thus they require a high processing capacity with severe time constraints as well as a large storage requirements. In order to use this type of maps by navigation systems with limited resources (computation / memory), the size of these maps must be reduced. Hence, we need to summarize such maps while preserving the essential information for navigation.
II. PREVIOUS WORKS
High quality maps are required for a wide range of applications, particularly for applications where constant lo-calization or feature tracking is crucial. Hence understanding a maps structure and evaluating map quality is very useful for accurate navigation [15], [23]. Furthermore, in some navigation tasks, setting a full-size map on a mobile device (car, robot, etc.) poses several difficulties in time and memory consumption. To solve this problem there are two possible approaches: map compression or map summarizing using
only significant information. Over the past decade, several compression approaches have been proposed in literature. Some of them employ special data structures such as octree [6] for progressive encoding of point clouds. Schnabel et al. [19] proposed a prediction scheme to achieve the compres-sion using the octree approach. A novel comprescompres-sion method has been proposed in [11] to code only the spatial and temporal differences within an octree structure. Jae-Kyun et al.[1] proposed a geometry compression algorithm for large scale point cloud to encode radial distances in a range image. Compression algorithms are essential for efficient storage and transmission but they are not sufficient for navigation indeed a step of decompression is necessary to process the data. Several approaches based on feature selection to summarize a map for localization purposes were presented in [8], [17], [21]. They propose some scoring functions to order the map landmarks according to their significance while guaranteeing a maximum coverage of the scene. An approach to map reduction was proposed in [22]. It aims to select only the places that are particularly suitable for localization using the location utility metric. To simplify the process of appearance-based navigation, a selection process is applied to choose the key/reference features in the environment. For instance, in visual memory based approaches, a set of relevant and distinctive areas (images) are acquired and used during navigation for comparison with the current position. In the work of Cobzas [5], a panoramic memory of images is created by combining acquired images with depth information extracted from a laser scanner. In this image database, only the salient information will be retained [3] without degrading the performance during navigation. In order to build this image database, some techniques have been developed to guarantee the maximum efficiency in the choice of useful information. A spherical representation has been proposed by M. Meilland et al. [14]. This spherical representation is built by merging different images acquired by a set of cameras with the depth information extracted from a laser scanner. Methods based on Bag of Words (BoW) are widely used for localization. BoW methods can efficiently represent a huge amount of data using the occurrences of sev-eral visual vocabulary. By applying hierarchical dictionary to the visual navigation problem [9], BoW methods proved a high scalability and accuracy in vision-based localization and mapping processes. All existing methods for summarizing maps are based mainly on geometric or photometric char-acteristics to select the most salient information. However,
these characteristics are insufficient for good perception and understanding of the environment. A combination of geometric, photometric and semantic characteristics when selecting information allows us to have a compact, precise and useful summary. Our work aims to perform several navigation tasks using only a map summary of the envi-ronment. This map should be not only compact but also coherent with the perception of the agent. To provide this map summary, we propose a new method dealing with large-scale 3D meshs. The output of our summarizing method is a set of spherical images. the spherical images are constructed using the technique of ray tracing. For each pixel of the image, a ray is launched and the intersections of this ray with the faces of the mesh are calculated. Ray tracing is a rendering technique for generating an image by tracing the path of light as pixels in an image plane and simulating the effects of its encounters with virtual objects. In our case, for each pixel, we launch a ray, and we look for the triangles of the mesh intersected by the ray. We keep the nearest triangle. We have proposed to use the Mller-Trumbore [16] algorithm to determine if a ray intersects a given triangle or not while keeping track of the nearest intersected object. Our main contributions are:
∙ We propose an efficient algorithm for summarizing maps based on geometric, photometric and semantic characteristics.
∙ We formulate map summarizing process as a multi-objective optimization problem.
∙ We propose a new scalable representation of summa-rized map using augmented and labelled RGB-D-L spherical images. Where RGB is the color information, D is the depth information and L is the semantic information
The remainder of this paper is organized as follows. Section III is dedicated to the problem formulation and presents an overview of our approach. The complete map summarization process is described in Sections IV and V. Before conclusion and perspectives, experimental results and discussions are presented in Section VI.
III. PROBLEMMODELING
In this article, we aim at summarizing a 3D mesh to a compact set of spherical images. Our objective is to reduce the number of spheres while maintening a high level of significant information for navigation and localization. To modelize this problem, we introduce some notations. Let us suppose that the 3D map is a 3D mesh with color and semantic information. In this 3D mesh we define the navigable areas Γ as the 2D polygon whose edges represent the borders of the navigable areas. We define the visible areas Σ as the 2D polygon whose edges represent the borders of the visible areas. To reduce the data, we propose to represent the different information into some augmented spherical images. The goal of this paper is to minimize the number 𝑛 of augmented spheres 𝑋 = {𝑋𝑖, 𝑖 = 1..𝑛} needed to describe the 3D maps. The final set of spheres must guarantee a compromise between two objectives:
∙ Maximize the Visibility ∙ Maximize the Entropy .
The first goal is to maximize the visibility 𝑉 of the studied environment. We define the visibility of a 3D point 𝑐 in the navigable areas Γ as the number of all vertices of Σ visible from this point. Geometrically, the point 𝑝 is said to be visible from 𝑐 if the segment 𝑝𝑐 does not intersect any obstacle or any edge of Σ. We define the visibility 𝑉 as:
𝑉 (𝑐) = #{𝑝 ∈ vertices of Σ/𝑝 is visible from 𝑐} (1) where #𝐴 is the cardinality of the set 𝐴. The second objective is the entropy 𝐸 which expresses the quantity of visible salient information from a viewpoint. We define the entropy of a sphere as the amount of significant information projected onto it. Using this entropy we are able to select the optimal viewpoint which represents as best as possible a 3D map. The idea is to compute the number of salient points in the spherical image. To decide the saliency of 3D point on the sphere, we propose to define two levels of saliency. The level saliency that is based on low-level characteristics (photometric and geometric) of a 3D point. The high-level saliency is based on the semantic information of each 3D point. In our summarizing process, points labelled ”buildings”, are considered among the most salient points for localization. Using these two types of saliency, we calculate the number of points of interest on the sphere according to their relevance. Therefore, we have four possible combinations as following.
∙ 𝑛00: number of non relevant points semantically, pho-tometrically and geometrically.
∙ 𝑛10: number of points relevant only photometrically and geometrically.
∙ 𝑛01: number of points relevant only semantically. ∙ 𝑛11: number of points relevant semantically,
photomet-rically and geometphotomet-rically.
The entropy of a sphere will be characterized by the entropy of its center 𝐶. The entropy is given by the equation: 𝐸(𝐶) = −𝑛00 ℎ log 𝑛00 ℎ − 𝑛01 ℎ log 𝑛01 ℎ − 𝑛10 ℎ log 𝑛10 ℎ − 𝑛11 ℎ log 𝑛11 ℎ where ℎ is the number of 3D points on the sphere. We then propose to formulate this summary process of 3D mesh as a multi-objective optimization problem using a simultaneous optimization strategy. Thus we propose to optimise the visibility and the entropy in the same time. Algorithm 1 finds the optimal set of spherical images 𝑋 = {𝑋𝑖, 𝑖 = 1..𝑛} which allows to describe efficiently a 3D mesh. Here we represent each sphere by its center 𝑋𝑖.
A. Barycenters graph
The first goal of our summarizing process is to reduce the size of a 3D map while maintaining a global view of the entire scene. Thus, the optimal set of spherical images must guarantee maximum visibility. All spheres must be placed on the navigable areas (street). To simplify the search space
Algorithm 1 Compute the sphere graph 𝑋 = {𝑋𝑖, 𝑖 = 1..𝑛} Require: 𝑇 = (𝐶, 𝛾) Barycenters graph Σ = {𝑉𝑗, 𝑗 = 1..𝑘}𝑉𝑖 vertices of Σ Starting point 𝐶𝑠∈ 𝐶 End point 𝐶𝑒∈ 𝐶 Ensure:
Mark all vertices in Σ as uncovered
Mark all vertices in Σ visible from 𝐶𝑠and 𝐶𝑒as covered 𝑋 ← {𝐶𝑠, 𝐶𝑒}
𝑞 ← 𝐶𝑠
𝛾𝑘← the edge in 𝛾 whose starting point is 𝑞 while ∃𝑥 an uncovered point in Σ do
Π(𝛾𝑘) =Discretization of the edge 𝛾𝑘
𝑝 ← first point in Π(𝛾𝑘) to the right of 𝑞 such that 𝑝 cover some uncovered 𝑥 ∈ Σ and 𝐸(𝑝) ≥ 𝛼
𝑋 ← 𝑋 ∪ {𝑞}
Mark all points ∈ 𝑥 as covered 𝑞 ← 𝑝
if(𝑞 ∈ 𝐶)
𝛾𝑘← the edge in 𝛾 whose starting point is 𝑞 end while
return 𝑋
we will look for these spheres on a starting graph called Barycenters graph. On this graph 𝑇 = (𝐶, 𝛾) we will place our spherical images. The nodes of this graph will be a set of points of view allowing to visualize the totality of the scene. All these points of view will be placed on the navigable area. In the literature several methods have been proposed to treat visibility in a polygon. The art gallery problem was presented as a question by the German painter Paul Klee: how much guards do we need to guard a room? This problem consists in finding in a polygon the optimal number of guards required to view the totality of the polygon. A variety of this problem is known as the ”Watchman route”. This problem consists in finding a path inside a polygon Γ so that each point in Γ will be visible from a certain point of this path. Several algorithms have been proposed to calculate the watchman route by taking as input a group of target points to visit [4], [7], [18]. Another method known as Zookeeper’s problem was proposed [10]. Given a simple polygon (the zoo) with a set of 𝑘 convex disjointed polygons (the cages) inside, this solution consists in finding the shortest path inside the zoo that touches every cage without getting inside it. The majority of all these algorithms looks for the optimal path that minimizes the total distance traveled while guarding a polygon. In our case, we need to find a path in the navigability polygon that ensures the guard of the visibility polygon. With this intention, we propose to find a graph inside the navigability polygon which guarantees the total oversight of the visibility polygon. To visualize the totality of a convex area, only one point of view (the center) is sufficient. From this statement, the graph will be built from the points of view 𝐶𝑘 selected in each convex area. Thus
Fig. 1: Polygons Intersection
we propose to decompose the visibility polygon into several convex zones. Since the navigability polygon is included in the visibility polygon, we will calculate the inter-polygons between each convex polygon of Σ and the navigability polygon. Fig 1 shows the decomposition of the visibility polygon into several convex polygons and the intersections with the navigability polygon. Several algorithms have been proposed to decompose a polygon in multiple areas. Keil's algorithm [12], [13]] consists in splitting a polygon into many convex sub-polygons by eliminating all reflex vertices. We suggest the use of Mark Bayasit's algorithm [2] which is an optimized version of the Keil's algorithm. Therefore we connect all the nodes of 𝑇 by a set of arcs 𝛾 so that these arcs do not intersect the navigability polygon.
B. Optimization Process
We intend to find out on the previous graph 𝑇 = (𝐶, 𝛾) a set of viewpoints which maximizes the entropy 𝐸 while ensuring that the majority of the environment areas are still visible. As shown previously in Algorithm 1 the final spheres can belong to the vertices of the starting graph 𝑇 or on its edges. While browsing the initial graph, we will select the best viewpoints satisfying the criteria of entropy and visibility. The optimization algorithm consists in selecting a start point and an end point on the initial graph 𝑇 . Starting from the start point, we will select points of view with entropy greater than a threshold 𝛼 and covering all vertices in visibility polygon. To select the next point on the graph we propose a bijection function Π between each two linked nodes. This function allows to split each edge into 𝑁 points. For each edge 𝛾𝑘connecting two nodes 𝐶𝑘 and 𝐶𝑘+1. Π the bijection between 𝛾𝑘 and the interval [0 1]
Π : ⃒ ⃒ ⃒ ⃒ [01] −→ 𝛾𝑘 𝑟 ↦−→ Π(𝑟)
Fig. 2: Edge Discretization
Π(0) is the start point and Π(1) is the end point of 𝛾𝑘. Discretize 𝛾𝑘 consist in splitting it in 𝑁 points such as :
𝑟𝑖= 𝑖
𝑁 − 1, 𝑖 = 0 to 𝑁 − 1 (2) Fig 2 shows an example of edge discretization. The op-timization process will be repeated until cover the entire visibility area. At the end of this process we will obtain an optimal graph of spheres. In the next section we will detail the process of evaluating the obtained results.
IV. EXPERIMENTALRESULTS
A. Evaluation
To evaluate the quality of a map and estimate its perfor-mances during the localization, several solutions have been proposed. In [15], the authors propose to predict perfor-mances of localization in context of the visual cartography thanks to a score that is estimated for each position 𝑣 according to the map structure. This score is calculated by counting the number of points of interest visible from 𝑣 and its closest neighbors. The authors showed that the score provided by their method is strongly correlated with the true performance of localization. The solution suggested by Zhen et al. [23] consists in calculating a criterion called localizability. This criterion is calculated from the geometric characteristics in each direction for each point in the map. To estimate the localizability of a given position first, they determine the set of visible points from this position. Then they estimate the surface normals for each visible point. After that they accumulate the normals in one matrix 𝑁 which describes the set of observable constraints of the given position. 𝑁 = ⎡ ⎢ ⎢ ⎢ ⎢ ⎢ ⎢ ⎣ 𝑛1𝑥 𝑛1𝑦 𝑛1𝑧 𝑛2𝑥 𝑛2𝑦 𝑛2𝑧 . . . . . . . . . 𝑛𝑘𝑥 𝑛𝑘𝑦 𝑛𝑘𝑧 ⎤ ⎥ ⎥ ⎥ ⎥ ⎥ ⎥ ⎦
In [23] they showed that to precisely locate a robot we needs to be able to adequately constrain its pose in all three dimensions. They proposed to examine the singular values 𝑁 with SVD as 𝑈 Σ𝑉 . Theoretically, we should be
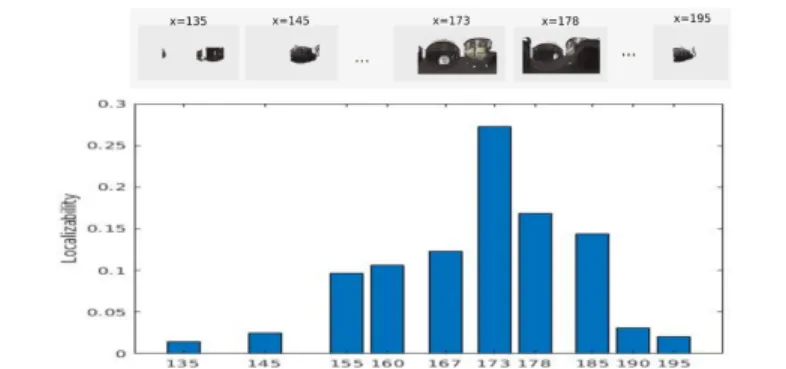
Fig. 3: Evolution of localizability while moving along the x-axis
able to locate as long as all three of the singular values are non-zero. In practice, they have calculated the localizability 𝐿 as the minimum singular value of 𝑁 :
𝐿 = 𝑚𝑖𝑛(𝑑𝑖𝑎𝑔(Σ)) (3) To test this criterion, we have selected several positions on a trajectory and then calculated localizability for each sphere in each position. All spheres are in the same reference (𝑥, 𝑦, 𝑧) and have the same height 𝑧 = 1.5𝑚 corresponding to the average height of the agent. Fig 3 shows the evolution of localizability by moving along the x-axis. We show that the localizability is better when the spherical image contains fewer empty areas. These empty areas are the invisible areas from this point of view. Therefore, this criterion reflects the quantity of geometric constraints in a given position. If this point of view allows sufficient visualization of the geometric constraints, it will be easily localizable. In our case, we need that each sphere in the optimal graph 𝑋 must have a good localizability value.
Fig. 4: Large-Scale 3D mesh
B. Results
We have applied our method on two databases which describes two parts of Rouen city. They cover about 33000 𝑚2 of a developed urban area that contains urban structures such as houses, buildings and roads. The first database is a 3D textured, triangulated and labeled mesh (Fig 4) and contains over 5 millions faces. In this dataset, we have 15 classes of labels, namely {0: Misc, 1: Road,2:RoadMarks, 3: Terrain sidewalk, 4: Building, 5: vegetation, 6: Tree,
7: Pedestrian, 8: cars,9: Bicycle, 10: Motorbike,11: Traf-ficLight, 12: TrafficSign, 13: Pole, 14: sky}. To evaluate the gain in memory we have proposed to compute the compression ratio which is defined as the ratio between the size of the final set of spheres and the size of the initial mesh and it is notated as a percentage. This dataset permitted the evaluation of our solution's performance by using all semantic, photometric and geometric characteristics together.
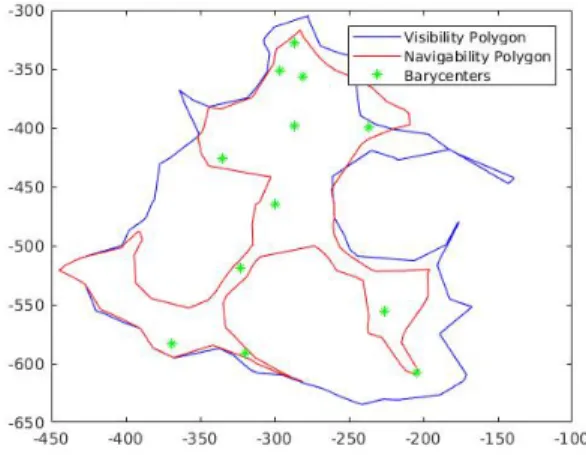
Fig. 5: Polygons Extraction
Fig 5 shows the extraction of the navigability and visibility polygons. The output of this summary process, as shown in the Fig 6 and Fig 7, is a compact set of RGB-D-L spherical images. We have obtained 10 spheres summarizing the 3D mesh. We have obtained a compression ratio of 99% of this map. We have applied our algorithm on a larger database which contains over 30 millions faces. It represents a trajectory of length 500m. Fig 8 shows the first step of our algorithm which consists in computing the graph of barycenters.
Table I shows the final results on both databases. TABLE I: Final Results
Data Sets Data Set 1 Data Set 2 Trajectory Length 100m 500m Number of Triangles 5 millions 30 millions
Number of Spheres 10 52 Compression Ratio 99% 99%
The final set of spherical images allows to summarize the initial 3D mesh. Most of the points visible from thes spheres belong to relevant points such as buildings, vegetation and TrafficSign. As a result, we have significantly decreased the size of the map. Nevertheless, we have succeeded to keep a maximum number of salient points. To evaluate our solution, we have computed the Localizability of each spherical image, as defined in the previous section. All the spheres have a high localizability values which are greater than 0.5. Based on what has been shown in [23], all spheres are easily localizable. This ensures a good localization in the sphere graph. Our algorithm guarantees maximum visibility
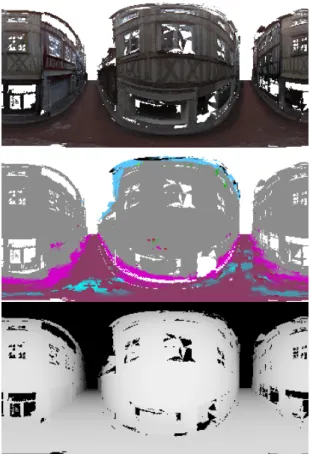
Fig. 6: RGB-D-L Spherical Image
and entropy of the studied environment, thus an optimal image registration. Reducing the size of the initial map up to 1% allows to gain in term of memory and time of computation. Indeed we can integrate easily this minimal graph on navigation system with low resources or send it over a network from a server to an agent. We have optimized the computation time of our algorithm. Indeed, the construction of a sphere of resolution 360𝑥180 took 20𝑚𝑖𝑛 because of the volume of the initial data. To do this, we have used parallel computing and organized the original data in order to facilitate research. As a result, we reduced the calculation time of a sphere to 0.9 𝑚𝑖𝑛. This computation time can be further improved to facilitate the use of our algorithm in real-time applications.
V. CONCLUSIONS
The developped method throughout this paper allows to summarize efficiently a large-scale 3D Mesh. The summa-rizing process is based on the extraction of several spherical views representing a part of the initial map. This spherical representation contains semantic, photometric and geometric information. This new method of summarizing 3D maps allows us to facilitate several navigation tasks when applied in intelligent transportation systems (localization, route plan-ning, obstacle avoidance, ...) by reducing significantly the calculation time and the required memory size. We also believe that using semantic information permits the devel-opment of a precise summary map by rejecting unnecessary
Fig. 7: Optimal RGB-D-L Spherical Image Graph
Fig. 8: Second Data Set
localization data such as points belonging to dynamic objects (cars, pedestrians, ... ). In our future work, we aim to extend our algorithm to treat the case where the navigable areas that would contain holes. The next important step will also consist in using the set of spherical views and the semantic information of the navigable area in order to produce a navigation graph. This graph will propose an adapted path to follow by the agent according to its mobility capabilities (car, pedestrian, bike, mobile robot, ...). In addition, we aim to add other criteria in the optimization process. For example, for the convergence of localization algorithms, we can impose a maximum distance 𝐷 between spherical images. In addition, we aim to develop our localization system in order to evaluate the localizability of the summarized map.
VI. ACKNOWLEDGMENTS
This work takes part in the ANR-15-CE23-0010-01 pLaT-INUM project. This project has been funded with the support from the French National Research Agency (NRA).
REFERENCES
[1] Jae-Kyun Ahn, Kyu-Yul Lee, Jae-Young Sim, and Chang-Su Kim. Large-scale 3d point cloud compression using adaptive radial distance
prediction in hybrid coordinate domains. IEEE Journal of Selected Topics in Signal Processing, 9(3):422–434, 2015.
[2] Mark Bayazit. Decomposing polygons into convex regions. https: //mpen.ca/406/bayazit.
[3] Selim Benhimane, Alexander Ladikos, Vincent Lepetit, and Nassir Navab. Linear and quadratic subsets for template-based tracking. In 2007 IEEE Conference on Computer Vision and Pattern Recognition, pages 1–6. IEEE, 2007.
[4] Svante Carlsson, H˚akan Jonsson, and Bengt J Nilsson. Finding the shortest watchman route in a simple polygon. Discrete & Computa-tional Geometry, 22(3):377–402, 1999.
[5] Dana Cobzas, Hong Zhang, and Martin Jagersand. Image-based localization with depth-enhanced image map. In Robotics and Automa-tion, 2003. Proceedings. ICRA’03. IEEE International Conference on, volume 2, pages 1570–1575. IEEE, 2003.
[6] Olivier Devillers and P-M Gandoin. Geometric compression for interactive transmission. In Visualization 2000. Proceedings, pages 319–326. IEEE, 2000.
[7] Moshe Dror, Alon Efrat, Anna Lubiw, and Joseph SB Mitchell. Touring a sequence of polygons. In Proceedings of the thirty-fifth annual ACM symposium on Theory of computing, pages 473–482. ACM, 2003.
[8] Marcin Dymczyk, Simon Lynen, Titus Cieslewski, Michael Bosse, Roland Siegwart, and Paul Furgale. The gist of maps-summarizing experience for lifelong localization. In Robotics and Automation (ICRA), 2015 IEEE International Conference on, pages 2767–2773. IEEE, 2015.
[9] Friedrich Fraundorfer, Christopher Engels, and David Nist´er. Topo-logical mapping, localization and navigation using image collections. In Intelligent Robots and Systems, 2007. IROS 2007. IEEE/RSJ Inter-national Conference on, pages 3872–3877. IEEE, 2007.
[10] H˚akan Jonsson. An approximative solution to the zookeeper’s prob-lem. Information Processing Letters, 87(6):301–307, 2003. [11] Julius Kammerl, Nico Blodow, Radu Bogdan Rusu, Suat Gedikli,
Michael Beetz, and Eckehard Steinbach. Real-time compression of point cloud streams. In Robotics and Automation (ICRA), 2012 IEEE International Conference on, pages 778–785. IEEE, 2012.
[12] J Mark Keil. Polygon decomposition. Handbook of Computational Geometry, 2:491–518, 2000.
[13] Mark Keil and Jack Snoeyink. On the time bound for convex decom-position of simple polygons. International Journal of Computational Geometry & Applications, 12(03):181–192, 2002.
[14] Maxime Meilland, Andrew I Comport, and Patrick Rives. Dense omnidirectional rgb-d mapping of large-scale outdoor environments for real-time localization and autonomous navigation. Journal of Field Robotics, 32(4):474–503, 2015.
[15] Hamza Merzi´c, Elena Stumm, Marcin Dymczyk, Roland Siegwart, and Igor Gilitschenski. Map quality evaluation for visual localization. In Robotics and Automation (ICRA), 2017 IEEE International Conference on, pages 3200–3206. IEEE, 2017.
[16] Tomas M¨oller and Ben Trumbore. Fast, minimum storage ray/triangle intersection. In ACM SIGGRAPH 2005 Courses, page 7. ACM, 2005. [17] Peter M¨uhlfellner, Mathias B¨urki, Michael Bosse, Wojciech Deren-darz, Roland Philippsen, and Paul Furgale. Summary maps for lifelong visual localization. Journal of Field Robotics, 33(5):561–590, 2016. [18] Eli Packer. Computing multiple watchman routes. Lecture Notes in
Computer Science, 5038:114–128, 2008.
[19] Ruwen Schnabel and Reinhard Klein. Octree-based point-cloud compression. Spbg, 6:111–120, 2006.
[20] Heiko G Seif and Xiaolong Hu. Autonomous driving in the icityhd maps as a key challenge of the automotive industry. Engineering, 2(2):159–162, 2016.
[21] Hyun Soo Park, Yu Wang, Eriko Nurvitadhi, James C Hoe, Yaser Sheikh, and Mei Chen. 3d point cloud reduction using mixed-integer quadratic programming. In Proceedings of the IEEE Conference on Computer Vision and Pattern Recognition Workshops, pages 229–236, 2013.
[22] Ted J Steiner, Guoquan Huang, and John J Leonard. Location utility-based map reduction. In Robotics and Automation (ICRA), 2015 IEEE International Conference on, pages 479–486. IEEE, 2015.
[23] Weikun Zhen, Sam Zeng, and Sebastian Soberer. Robust localization and localizability estimation with a rotating laser scanner. In Robotics and Automation (ICRA), 2017 IEEE International Conference on, pages 6240–6245. IEEE, 2017.