HAL Id: hal-02264444
https://hal.archives-ouvertes.fr/hal-02264444
Submitted on 8 Aug 2019
HAL is a multi-disciplinary open access
archive for the deposit and dissemination of
sci-entific research documents, whether they are
pub-lished or not. The documents may come from
teaching and research institutions in France or
abroad, or from public or private research centers.
L’archive ouverte pluridisciplinaire HAL, est
destinée au dépôt et à la diffusion de documents
scientifiques de niveau recherche, publiés ou non,
émanant des établissements d’enseignement et de
recherche français ou étrangers, des laboratoires
publics ou privés.
The GNU Image Manipulation Program Applied to
Study the Sand Dunes
Amelia Carolina Sparavigna
To cite this version:
Amelia Carolina Sparavigna. The GNU Image Manipulation Program Applied to Study the Sand
Dunes. International Journal of Sciences, Alkhaer, UK, 2013, 2 (09), pp.1-8. �10.18483/ijSci.289�.
�hal-02264444�
Abstract: The study of sand dunes and their migration rates requires large length and time scales. Therefore, the
use of time series of satellite images turns out to be important because it allows remote measure and control of the dunes. To obtain information from the satellite images we can use GIMP, the GNU Image Manipulation Program, which is freely available on the Web. Here we discuss some of its features and how they can be applied to study the sand dunes.
Keywords: GIMP, Image processing, Google Earth, Satellite images, Dunes, Barchans. 1. Introduction
Dunes are the product of the sand interacting with the wind and the desert surface. The sand is modelled and moved by the wind, but, on the other hand, the dunes are able to modify the flow pattern of the wind. Therefore, it is better to say that it is the equilibrium of interacting wind, sand and desert surface, which leads to the specific shapes displayed by the dunes [1,2].
The studies of dunes and of their migration rates started about a hundred of years ago [3], involving geographers and geophysical researchers [3-6]. Besides the field measurements, several controlled experiments and, recently, numerical simulations to model the dunes, had been proposed and made [2,4,6-13]; however, field measurements are still fundamental to have information on the links of some specific features, such as the migration rates, with the sand composition and environmental conditions [14,15].
As remarked in [2], the field measurements for studying the physics of dunes require large length and time scales, which are corresponding approximately to 100 m and 1 year. For this reason, time series of satellite images are important, because they allow a remote measure and control of the dunes. For instance, in a paper on the dunes of the Kharga Oasis [16], we used the time series of Google Earth, to obtain the moving rates of these dunes in relation with the area each dune is covering on the ground. To measure displacements and areas we used GIMP, the GNU Image Manipulation Program, which is freely available on the Web.
GIMP allows processing the images, adjusting their brightness and contrast for instance, or modifying them according to its curve tool [17], to increase the quality and visibility of details. Moreover, it
possesses several other algorithms, such as those for filtering the images, useful in scientific studies. Here in the following, we will collect some cases where GIMP and its tools are relevant for investigating the dunes. First of all, let us shortly define some morphological parameters of a dune and how GIMP can be used to measure them.
2. Width and length of a dune
In [16], to discuss the moving rates of some dunes of the Kharga Oasis and the connection to their size, we assumed the size given by the area each dune was covering on the ground. To determine this area, we used GIMP and its possibility of visualizing a grid on the image. If the image is a satellite image from Google Earth, we can have a length scale on it, and therefore it is easy to estimate the size of the grid in the desired units. However, several other morphological parameters can be chosen, as those used in Ref.18 for instance, a reference where the researchers applied some regression analysis methods to find connections between parameters, such as width and length, and between a specific parameter and the moving rate of dunes.
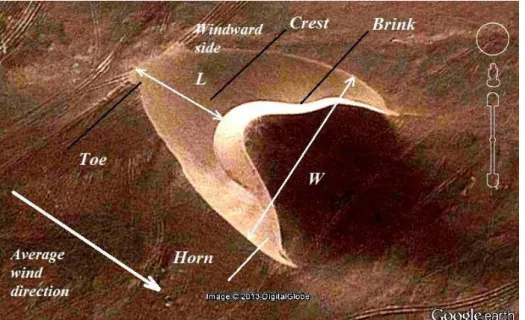
Morphological parameters can be easily given for one of the commonest types of dunes, the barchan. A barchan is an arc-shaped sand ridge, with two "horns" (see the Figure 1). The dune has two sides: the windward side with a slope of about 15 degrees and the slip face, at the angle of 30–35 degrees for medium-fine dry sand [1,5]. Barchan dunes can be large from meters to a hundred meters. The width W is measured as in the Figure 1. The length L of the dune is the distance between the toe and the brink. The barchan can have a crest and a brink, but, sometimes, these two elements are coincident. When these dunes migrate, the smaller dunes move faster than the larger ones. Therefore it can happen Department of Applied Science and Technology, Politecnico di Torino, Torino, Italy
Amelia Carolina Sparavigna (Corresondence)
[email protected], [email protected]
The GNU Image Manipulation Program Applied to Study the Sand Dunes
http://www.ijSciences.com
Volume 2 - September 2013 (9)
2
that a small dune bumps into the rear of the larger dune. After a certain time, the small dune appears on the other side of the large dune, emulating a solitonic behaviour [19,20]. However, unlike solitons, the sand particles do not pass through each other: it is the wind which is modelling the sand of colliding dunes until the rear dune becomes similar to the former front dune, and this dune turns into a smaller, faster
moving dune [20]. Therefore, it is clear that all information on the size of the dunes that we can pick up from the satellite images is important for investigating the dune interactions. And this is even more evident for the moving barchan dunes on Mars [21,22], because, till now, information can be provided by images only.
Figure 1 – A barchan in Peru as we can see it in a Google Earth image. W is the width of the dune and L its length.
This dune is characterized by its crescentic shape with two horns. Let us suppose that our aim is to find statistics on the
width and length of some barchans in a specific region of Earth or Mars. Barchans are isolated mobile dunes, however, they are often organized in large dune fields, which seem to present a characteristic dune size and spacing, and this fact is suggesting a cooperative behaviour based on dune interaction [23]. As a result, dune fields evolve towards a specific steady state. It is then important to have the data of width and length of dunes and relative distances, measuring them from the satellite images (Google Earth was used in Ref.23).
Let us remember that Google Earth allows saving images in jpg format, with a length scale superimposed on it (switching on the Scale legend). We can open the image using GIMP, and by means of a pair of compasses which we can find among its tools, we can measure distances and angles. The distances are given in pixels. However, since we
have on the image, the Google Earth length scale in the desired units, meters for instance, we can easily find using the compass the correspondence between pixels and meters. An example is shown in the Figure 2. In this figure, we have a Google Earth image with its length scale. We open the image with GIMP. In the panel of tools, we can select the pair of compasses and measure distances between two points of the image in pixels, and angles with the horizontal direction in degrees. By means of this same tool, we can have the pixels corresponding to the scale and then a simple proportion can determine the distances in the desired units.
We can use the compass to determine all the parameters useful to describe the shape of a dune and the area which it is covering. We can even estimate its height, considering the average slope of the windward face.
The GNU Image Manipulation Program Applied to Study the Sand Dunes
http://www.ijSciences.com
Volume 2 - September 2013 (9)
3
Figure 2 – Google Earth gives us an image with a length scale. Here, it is in meters. We can open the image with
GIMP. In the panel of tools, we select the pair of compasses. Below the image, we have the distance in pixels and the angle in degrees, given by this instrument. For example, we can measure the width of a dune. The compass provides this width in pixels: to have it in meters, we use the pair of compasses on the scale (here, 48 meters) and
find the corresponding pixels (123 pixels). A simple proportion tells that the dune has a width of 40.5 meters.
3. Moving dunes
In [23], the researchers measured the width and position of more than 5,000 dunes corresponding to four dune field corridors of Morocco and Western Sahara, using the satellite images from Google Earth with one meter per pixel resolution. In [23], the width line is defined as the largest distance between the dune horns, as illustrated in the Figure 1, assuming a symmetric shape of the dune. The uncertainties of measured width and location of the dunes were estimated in [23] to be of the same order as the resolution of the satellite image, and then negligible in comparison with the width of the dunes.
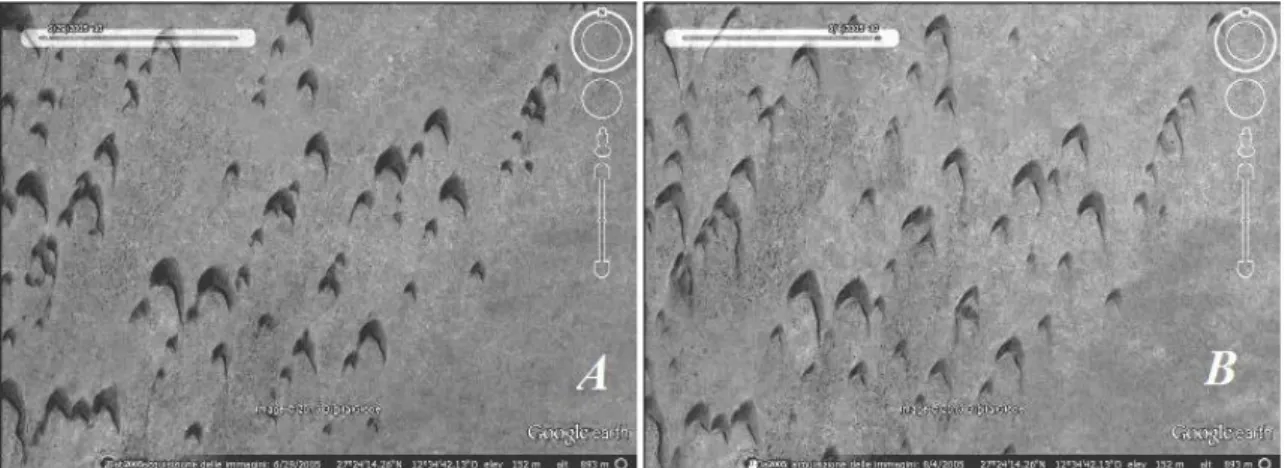
In the case of overlapping dunes, Ref.23 neglects them or takes them as a single dune, if one dune is much larger than the other one. The aim of Reference 23 was to determine the size distribution and structure of the dune fields, and therefore their motion was not discussed in details. However, Google Earth gives us the possibility to investigate their moving rates too. Let us consider here some of the dunes of the Western Sahara, coordinates 27°24’14.26’’N, 12°34’42.13’’W. From Google Earth we can have two images, one acquired on 29 June 2005 (Figure 3A), and the other on 4 August 2005 (Figure 3B).
Figure 3 - Dunes of the Western Sahara, coordinates 27°24’14.26’’N, 12°34’42.13’’W. Google Earth gives two
images, one acquired on 29 June 2005 (A), and the other on 4 August 2005 (B). The original colour tones have been converted in grey tones and contrast and brightness adjusted with GIMP.
The GNU Image Manipulation Program Applied to Study the Sand Dunes
http://www.ijSciences.com
Volume 2 - September 2013 (9)
4
Comparing the two images we see that the dunes are moving. To measure the displacement of each dune, it is better to use the following approach. New image A’ is obtained by inverting the grey tones of image A. Reducing its opacity to 50%, the image A’ is copied as a layer on the image B. The final result is shown in the Figure 4. In this image we have the dunes, recorded in the image of 29 June, that appear
as bright dunes, whereas the same dunes remain dark in image of 4 August. After, we can join the two positions of the brink of each dune by a red line for instance. This line can represent the displacement of the dune. Moreover, each dune is labelled by a number. The image is also reporting the length scale in meters.
Figure 4 - The image is obtained from images A and B of the Figure 3. A new image A’ is obtained by inverting
the grey tones of image A. Reducing its opacity to 50%, A’ is copied as a layer on B. In the image, the dunes on 29 June appear as bright dunes, whereas the same dunes on August 4 are dark. We can join the two positions of the
brink of each dune by a red line, representing the displacement of the dune. As in Ref.23, overlapping dunes have been
neglected. To have the displacement of the dunes as a function their size, we can measure both displacement and dune width using the GIMP pair of compasses as discussed in the previous section. It is
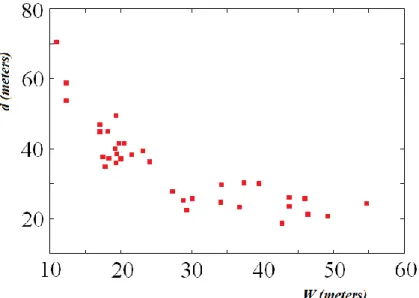
assumed that the uncertainties of measured widths and displacements are negligible. Using then the GIMP compass we obtain a plot of the displacement (in meters) of each dune with respect to its width (in meters). The plot is shown in the Figure 5.
Figure 5 – Displacement d of dunes with respect their width W. Data are given for the dunes labelled in the Figure
The GNU Image Manipulation Program Applied to Study the Sand Dunes
http://www.ijSciences.com
Volume 2 - September 2013 (9)
5
When the two images are superimposed with GIMP, it is necessary to be careful, and move one image with respect to the other, in order to have coincident some reference points on the ground. This had been made for the two images in Figure 3. The speed of these dunes seems larger than that reported in Ref.12.
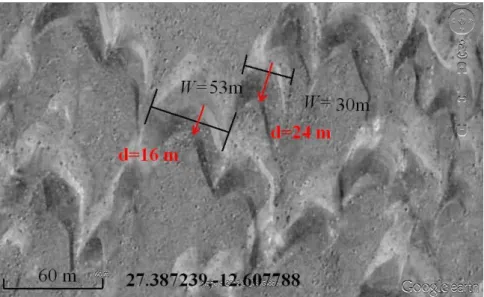
However, the moving rate reported in that reference is given per year. Here, we are measuring the rate on a shorter time interval, and it is possible that the motion of the dunes is not constant over the year. Another example of superimposed images and use of GIMP pair of compasses is given in the Figure 6.
Figure 6 – Width and displacement of two dunes measured by means of the GIMP pair of compasses. 4. Filtering images
Dunes exist on other bodies of the solar systems [24]. Their existence had been demonstrated for Venus, Mars and Titan, a Saturn’s moon. Moreover, it had been recognized that the dunes on Mars and Titan are moving objects. This result has been achieved by means of the images coming from the satellites orbiting on Mars and from the Cassini Radar Mission. To investigate the motion of the Martian dunes, images from the High Resolution Imaging Science Experiment (HiRISE), the camera onboard the Mars Reconnaissance Orbiter, have been used [25]. Comparing images taken a few months apart, researchers evidenced the sand motion in the Herschel Crater and in the Nili Patera Caldera on Mars [26-28]. This result was important because, on the basis of surface meteorology measurements and global circulation models, strong and sustained winds on Mars have been considered rare, and therefore the possibility of moving dunes was questioned. However, like on Earth, the Martian dunes are in a near steady state with their bulk composed of mobile sand, and can have high sand fluxes, similar to those in the Victoria Valley, Antarctica, implying that the rates of landscape modification on Mars and Earth are similar [28].
To study the motion of the dunes of the Nili Patera Caldera, we used in References 21 and 22, an image of the 2007 HiRISE database and an image from the 1999 database of the Mars Global Surveyor, measuring therefore the motion on a larger time scale. In [21], GIMP was used to adjust the images, which have a different resolution, to compare them. In [22], we discussed the application of an edge-detection filter, the Sobel filter of GIMP. This filter allowed a better comparison of images. Besides Sobel, GIMP has several other filters, which can be applied. Let us discuss in this section the use of another algorithm to investigate the ripples on the dunesurfaces.
The ripples observed on the surface of a dune indicate that that the winds are not only moving the dune but also modifying it. Moreover, the asymmetry of the ripples can also show the wind direction. The HiRISE images allow seeing superposed secondary ripples on the Martian dunes: these ripples were not discernible in images with a coarser spatial resolution.
The GNU Image Manipulation Program Applied to Study the Sand Dunes
http://www.ijSciences.com
Volume 2 - September 2013 (9)
6
Figure 7 – On the left, a dune of the Nili Patera Caldera dune field in an image taken on 10 March 2011 from
HiRISE database. We can use GIMP and its algorithm based on the difference of Gaussians to see the ripples on its surface.
Let us consider the image in Figure 7 on the left, showing a dune of the Nili Patera Caldera dune field, taken by the HiRISE camera on 10 March 2011. To see the ripples on its surface, we can try to apply the Sobel filter again. However, the best result is obtained by another filter of GIMP. This filter, which does edge detection too, is the so-called “Difference of Gaussians” algorithm. It works by performing two different Gaussian blurs on the image, with a different blurring radius for each, and subtracting them to yield the result. According to [29], the most important parameters are the blurring radii for the two Gaussians. We can set them using the preview. It may help knowing that an increase of the smaller radius tends to give thicker-appearing edges, and the decrease of the larger radius tends to increase the
threshold for recognizing something as an edge [29]. Adjusting these radii we can obtain the image on the right of Figure 7. Note the ripples on the dune. The ripples move: in Reference 30 we can see a two-image animation showing this motion on another dune of Nili Patera Caldera. Here, these two images are reproduced in the Figure 8. The images were taken 15 weeks apart by the HiRISE camera. In [30], the two images are positionally tied together by some fixed features on the bedrock, and then, when the images are blinked back and forth, the ripple motion during the intervening period of 105 days appears. One of the images was taken on June 30, 2007; the other was taken on October 13, 2007.
Figure 8 – On the left, the ripples on a dune in the Nili Patera Caldera on Mars, recorded by HiRISE (Credit:
NASA/JPL-Caltech/Univ. of Arizona/JHU-APL). On the right, the same images after processing by means of the GIMP difference of Gaussians.
The GNU Image Manipulation Program Applied to Study the Sand Dunes
http://www.ijSciences.com
Volume 2 - September 2013 (9)
7
On the right side of the Figure 8, we can see the images processed by using the GIMP difference of Gaussians. Instead of making a movie, we can use them superimposed like in the Figure 9. The fixed features of the background coincide, but not the ripples. And this means that they changed. As made before, we could measure the displacement of the ripples on the dune surface using the pair of compasses. Since GIMP has the possibility to colour the grey tone images, we can also try another approach. Before being superimposed, the two grey images can be coloured differently, for instance, one in blue and the other in red. The final result is shown in the Figure 10, where we can see the alternating blue and red ripples, representing in such a manner their motion.
.
5. Conclusions
As we have discussed and shown with examples, the use of time series of satellite images is fundamental to study the sand dunes, because it allows a remote measure and control of them, avoiding large and long-term field investigations. However, to receive information from the satellite images we have to use some tools. Here we discussed the use of GIMP, the GNU Image Manipulation Program, which is freely available on the Web. In particular, we showed how is possible to measure the morphological parameters of dunes and filter the images, in order to have information on the changes occurred to the dunes.
Figure 9 – The two images on the right of Figure 8 superimposed. The background is fixed, but the lines of the
ripples do not coincide.
Figure 10 – The two images on the right of Figure 8 had been coloured one in blue and the other in red and then
The GNU Image Manipulation Program Applied to Study the Sand Dunes
http://www.ijSciences.com
Volume 2 - September 2013 (9)
8
References
[1] A.C. Sparavigna, A study of Moving Sand Dunes by means of Satellite Images, International Journal of Sciences, Volume 2, Issue August, 2013, Pages 33-42.
[2] P. Hersen, S. Douady, and B. Andreotti, Relevant Length Scale of Barchan Dunes, Physical Review Letters, Volume 89, Issue 26, 2002, Article Number 264301, 4 Pages.
[3] H.J. LLewellyn Beadnell, An Egyptian Oasis, and Account of the Oasis of Kharga in the Libyan Desert, with Special Reference to Its History, Physical Geography and Water-Supply, London, John Murray, 1909.
[4] R. A. Bagnold, The Physics of Blown Sand and Desert Dunes, Chapman and Hall, London, 1941.
[5] K. Pye and H. Tsoar, Aeolian Sand and Sand Dunes, Springer, 2008.
[6] R. Cooke, A. Warren, and A. Goudie, Desert Geomorphology, UCL Press, London, 1993.
[7] O. Dauchot, F. Léchenault, C. Gasquet, and F. Daviaud, Barchan Dunes in the Lab, Mecanique, Volume 330, 2002, Pages 185-191.
[8] B. Andreotti, P. Claudin, and S. Douady, Selection of Dune Shapes and Velocities, European Physical Journal B, Volume 28, 2002, Pages 321-339.
[9] H.J. Herrmann, Aeolian Transport and Dune Formation, published in Modelling Critical and Catastrophic Phenomena in Geoscience: A Statistical Physics Approach, eds. B.K. Chakrabarty and P. Bhattacharyya, Lecture Notes in Physics 705, Springer, 2006, Pages 363-386.
[10] H.J. Herrmann and G. Sauermann, The Shape of Dunes, Physica A, Volume 283, 2000, Pages 24-30.
[11] H.J. Herrmann, G. Sauermann and V. Schwämmle, The Morphology of Dunes, Physica A, Volume 358, 2005, Pages 30– 38.
[12] G. Sauermann, P. Rognon, A. Poliakov and H.J. Herrmann, The Shape of the Barchans Dunes of Southern Morocco, Geomorphology, Volume 36, 2000, Pages 47–62.
[13] G. Sauermann, J.S. Andrade Jr., L.P. Maia, U.M.S. Costa, A.D. Araújo and H.J. Herrmann, Wind Velocity and Sand Transport on a Barchan Dune, Geomorphology, Volume 54, 2003, Pages 245–255.
[14] D.S. Thomas, M. Knight and G.F. Wiggs, Remobilization of Southern African Desert Dune Systems by Twenty-First Century Global Warming, Nature, Volume 435, June 2005, Pages 1218-21. [15] M. Hiza Redsteer, R.C. Bogle and J.M. Vogel, Monitoring and Analysis of Sand Dune Movement and Growth on the Navajo Nation, Southwestern United States, U.S. Geological Survey, July 2011, Fact Sheet 2011-3085.
[16] A.C. Sparavigna, A Case Study of Moving Sand Dunes: The Barchans of the Kharga Oasis, International Journal of Sciences, Volume 2, Issue August, 2013, Pages 95-97.
[17] A.C. Sparavigna, Variations of Images to Increase Their Visibility, International Journal of Sciences, Volume 2, Issue August, 2013, Pages 86-91.
[18] S.H. Mousavi, M. Dorgouie, A.A. Vali, M. Pourkhosravani and A.R.A. Ameri, Statistical Modeling of Morphological Parameters of Barchan Dunes (Case Study: Chah Jam Erg in South of Haj Ali GHoli Playa, in Central Part of Semnan Province, IRAN), Journal of Geography and Geology, Volume 2, Issue 1, 2010, Pages 98-113.
[19] P. Vermeesch, Solitary Wave Behavior in Sand Dunes Observed from Space, Geophysical Research Letters, Volume 38, Issue 22, 2011, L22402, 3 Pages.
[20] V. Schwämmle and H.J. Herrmann, Solitary Wave Behaviour of Sand Dunes, Nature, Volume 426, 2003, Pages 619–620. [21] A.C. Sparavigna, Sand Dunes Moving in the Nili Patera Caldera on Mars, Volume 2, Issue August, 2013, Pages 105-108. [22] A.C. Sparavigna, Edge-Detection Applied to Moving Sand Dunes on Mars, Volume 2, Issue August, 2013, Pages 102-104. [23] O. Durán, V. Schwämmle, P.G. Lind and H.J. Herrmann, The Dune Size Distribution and Scaling Relations of Barchan Dune Fields, Granular Matter, Volume 11, 2009, Pages 7-11.
[24] List of Extraterrestrial Dune Fields and References Available
on Wikipedia at
http://en.wikipedia.org/wiki/List_of_extraterrestrial_dune_fields [25] P.E. Geissler, M.E. Banks, N.T. Bridges, and S. Silvestro, HiRISE Observations of Sand Dune Motion on Mars: Emerging Global Trends, Third International Planetary Dunes Workshop: Remote Sensing and Data Analysis of Planetary Dunes, held June 12-15, 2012 in Flagstaff, Arizona. LPI Contribution No. 1673, Pages 44-45, 06/2012.
[26] M. Cardinale, S. Silvestro, D.A. Vaz, T.I. Michaels, L. Marinangeli, G. Komatsu and C.H. Okubo, Evidences for Sand Motion in Herschel Crater (Mars), 44th Lunar and Planetary Science Conference, held March 18-22, 2013 in The Woodlands, Texas. LPI Contribution No. 1719, page 2259, 03/2013.
[27] S. Silvestro, L.K. Fenton, D.A. Vaz, N. Bridges and G.G. Ori, Ripple Migration on Active Dark Dunes in Nili Patera (Mars), Second International Planetary Dunes Workshop: Planetary Analogs - Integrating Models, Remote Sensing, and Field Data, held May 18-21, 2010 in Alamosa, Colorado. LPI Contribution No. 1552, pages 65-66, 05/2010.
[28] N. T. Bridges, F. Ayoub, J-P. Avouac, S. Leprince, A. Lucas and S. Mattson, Earth-like sand fluxes on Mars, Nature, Volume 485, 17 May 2012, Pages 339–342.
[29] GIMP, http://docs.gimp.org/en/plug-in-dog.html
[30] NASA: Ripple Movement on Sand Dune in Nili Patera, Mars, 05.09.12
http://www.nasa.gov/mission_pages/MRO/multimedia/pia15680.h tml