HAL Id: hal-00317783
https://hal.archives-ouvertes.fr/hal-00317783
Submitted on 22 Dec 2004
HAL is a multi-disciplinary open access
archive for the deposit and dissemination of
sci-entific research documents, whether they are
pub-lished or not. The documents may come from
teaching and research institutions in France or
abroad, or from public or private research centers.
L’archive ouverte pluridisciplinaire HAL, est
destinée au dépôt et à la diffusion de documents
scientifiques de niveau recherche, publiés ou non,
émanant des établissements d’enseignement et de
recherche français ou étrangers, des laboratoires
publics ou privés.
Radial dependence of foreshock cavities: a case study
D. G. Sibeck, K. Kudela, T. Mukai, Z. Nemecek, J. Safrankova
To cite this version:
D. G. Sibeck, K. Kudela, T. Mukai, Z. Nemecek, J. Safrankova. Radial dependence of foreshock
cavities: a case study. Annales Geophysicae, European Geosciences Union, 2004, 22 (12),
pp.4143-4151. �hal-00317783�
SRef-ID: 1432-0576/ag/2004-22-4143 © European Geosciences Union 2004
Annales
Geophysicae
Radial dependence of foreshock cavities: a case study
D. G. Sibeck1, K. Kudela2, T. Mukai3, Z. Nemecek4, and J. Safrankova4
1NASA Goddard Space Flight Center, Greenbelt, MD, 20771, USA
2Institute of Experimental Physics Slovak Academy of Sciences, Kosice, Slovakia 3Institute of Space and Astronautical Sciences, Kanagawa, Japan
4Charles University, Faculty of Mathematics and Physics, Prague, Czech Republic
Received: 13 July 2004 – Revised: 28 September 2004 – Accepted: 6 October 2004 – Published: 22 December 2004
Abstract. We present a case study of Geotail, Interball-1,
IMP-8, and Wind observations of density and magnetic field strength cavities excavated by the enhanced pressures asso-ciated with bursts of energetic ions in the foreshock. Con-sistent with theoretical predictions, the pressure of the ener-getic ions diminishes rapidly with upstream distance due to a decrease in the flux of energetic ions and a transition from near-isotropic to streaming pitch angle distributions. Conse-quently, the cavities can only be observed immediately stream from the bow shock. A comparison of conditions up-stream from the pre- and post-noon bow shock demonstrates that foreshock cavities introduce perturbations into the on-coming solar wind flow with dimensions smaller than those of the magnetosphere. Dayside geosynchronous magnetic field strength variations observed by GOES-8 do not track the density variations seen by any of the spacecraft upstream from the bow shock in a one-to-one manner, indicating that none of these spacecraft observed the precise sequence of density variations that actually struck the subsolar magne-topause.
Key words. Interplanetary physics (energetic particles;
planetary bow shocks) – Magnetospheric physics (solar wind-magnetosphere interactions)
1 Introduction
Kinetic processes occurring in the immediate vicinity of the Earth’s bow shock can introduce considerable structure into the solar wind shortly prior to its interaction with the Earth’s magnetosphere. The relatively rare hot flow anoma-lies (Schwartz et al., 1985) and much more common fore-shock cavities (e.g. Sibeck et al., 2002) represent prominent examples. The latter structures form on bundles of mag-netic field lines connected to the bow shock that are embed-ded in regions of magnetic field disconnected from the bow shock. The bundles fill with enhanced fluxes of suprathermal ions generated at the bow shock. The pressure of these ions Correspondence to: D. G. Sibeck
perpendicular to the magnetic field causes the bundles to ex-pand, resulting in cavities of depressed density and magnetic field strength bounded by regions of enhanced densities and magnetic field strengths.
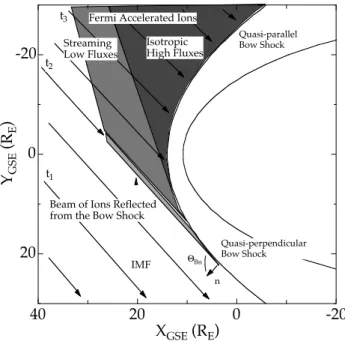
We can use the predictions of the Fermi (e.g. Terasawa, 1979; Lee, 1982) and reflection (Sonnerup, 1969) models for the ion foreshock to determine where foreshock cavities should be most prominent. As illustrated in Fig. 1, mod-els for Fermi acceleration predict intense, nearly isotropic, fluxes of suprathermal ions with energies extending beyond 300 keV immediately upstream from the quasi-parallel bow shock on magnetic field lines that have been connected to the bow shock for many minutes (t3). Lower fluxes and particle distributions streaming away from the bow shock occur both further upstream and on magnetic field lines only recently connected to the bow shock. Models for ion reflection from the quasi-perpendicular bow shock (Sonnerup, 1969) pre-dict highly anisotropic beams of suprathermal (∼4 keV) ions streaming along interplanetary magnetic field (IMF) lines re-cently connected to the bow shock (t2). No energetic ions are present far upstream or on IMF field lines unconnected to the bow shock (t1). Numerous observational studies confirm these predictions (e.g. Gosling et al., 1978; Greenstadt et al., 1980; Scholer et al., 1980). Other studies indicate that fluxes also increase as 2Bndecreases (Mitchell and Roelof, 1983),
where 2Bnis the angle between individual IMF lines and the
normal to the bow shock at the point of intersection. Based on these predictions, foreshock cavities should be most prominent immediately upstream from the pre-noon bow shock during typical periods of spiral IMF orientation. As illustrated in Fig. 1, field lines at pre-noon local times have been connected to the bow shock longer than field lines
connected to the post-noon bow shock. Furthermore, 2Bnis
less for field lines connected to the pre-noon foreshock than for those connected to the post-noon bow shock.
To test the proposed foreshock cavity scenario, we present a case study of simultaneous foreshock observations by three ISTP-era spacecraft upstream from the post-noon bow shock and one spacecraft upstream from the pre-noon bow shock. During this interval, the IMF generally assumed an unusual, orthospiral orientation. The three spacecraft upstream from
4144 D. G. Sibeck et al.: Radial Dependence of Foreshock Cavities 32 20 0 -20 YG SE (R E ) 40 20 0 -20 XGSE (RE)
Beam of Ions Reflected from the Bow Shock
Isotropic High Fluxes Streaming
Low Fluxes
Fermi Accelerated Ions
Quasi-parallel Bow Shock Quasi-perpendicular Bow Shock t1 t2 t3 IMF n ΘBn
Fig. 1. Spatial distribution of suprathermal ion distributions in the foreshock. No suprathermal ions occur on magnetic field lines
un-connected to the bow shock (t1). A beam of reflected or leaking
ions can be found on magnetic field lines connected to the
quasi-perpendicular bow shock (t2). A high flux of nearly isotropic ions
can be found immediately upstream from the quasi-parallel bow shock. A lower flux of streaming ions can be found further
up-stream (t3).
the post-noon bow shock observed corresponding foreshock cavities. The amplitudes of the density and magnetic field strength perturbations associated with these cavities dimin-ished with distance from the bow shock. As predicted by the model described above, the flux of suprathermal ions also di-minished with distance upstream and the particle pitch angle distributions became more field-aligned. By contrast, neither the length of time a field line had been connected to the bow
shock nor 2Bnwere important factors in determining event
strength. The spacecraft outside the pre-noon bow shock ob-served completely different energetic ion bursts, foreshock cavities, and density and magnetic field strength variations. As a result, the solar wind did not apply a uniform pressure across the entire dayside magnetosphere. In fact, a com-parison of the upstream solar wind observations with those by GOES-8 of the dayside magnetospheric magnetic field strength indicates that none of the solar wind monitors ob-served the precise sequence of pressure variations that buf-feted the subsolar magnetopause.
2 Data sets
To consider the radial dependence of the properties describ-ing foreshock cavities, we will present simultaneous Geo-tail, Interball-1, IMP-8, and Wind solar wind plasma, mag-netic field, and energetic ion observations. From Geotail, we will present LEP plasma density observations with
12.2-s time re12.2-solution (Mukai et al., 1994), MGF magnetic field strength observations with 3-s time resolution (Kokubun et al., 1994), and EPIC energetic ion flux observations with 6-s time resolution (Williams et al., 1994). From Interball-1, we will present VDP plasma flux observations with 15-s time resolution (Safrankova et al., 1997), MIF-M magnetic field strength observations with 6-s time resolution (Klimov et al., 1997), and DOK-2 energetic ion observations with a vari-able time resolution that depended on energetic ion flux lev-els (Lutsenko et al., 1998). The IMP-8 MIT Faraday cup takes snapshots of the density over 21.6 s at a maximum rate of once each 58 s. We present IMP-8 magnetic field ob-servations with a time resolution of 6 s and EPE energetic ion observations with 21.6 s time resolution (King, 1982). From Wind, we will present 3-DP plasma and energetic ion observations with 3- and 6-s time resolution, respectively (Lin et al., 1995), and MGI magnetic field strength observa-tions with 3-s time resolution (Lepping et al., 1995). To de-scribe the magnetospheric response, we will present GOES-8 geosynchronous magnetometer observations with 1-min time resolution (Singer et al., 1996).
3 Solar wind observations
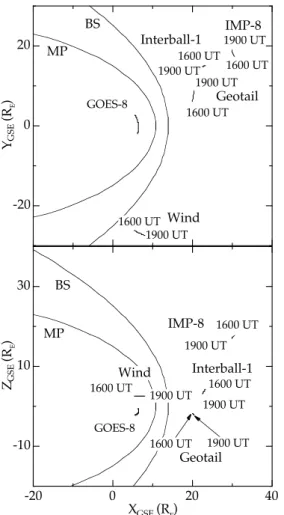
We present observations for the period from 16:00–19:00 UT on 19 April 1996. As shown in Fig. 2, during this inter-val Geotail moved duskward from Geocentric Solar Eclip-tic (GSE x,y,z)=(20.0, 6.0, −1.9) to (20.4, 8.8, −2.2) Earth
radii (RE)immediately upstream from the post-noon bow
shock. Interball-1 moved equatorward and earthward from GSE (x,y,z)=(23.2, 15.0, 4.1) to (21.9, 14.4, 2.3) RE from
a location somewhat further upstream and outside the equa-torial post-noon bow shock. IMP-8 moved duskward from GSE (x,y,z)=(30.6, 17.3, 17.6) to (29.4, 20.1, 16.3) REfrom
a position still further upstream and outside the northern post-noon bow shock. Wind moved sunward from GSE (x, y, z)=(5.4, −26.3, 2.4) to (9.9, −28.3, 2.5) REimmediately
out-side the equatorial dawn bow shock. Also shown in Figure 2 are the nominal positions of the Earth’s bow shock (Fairfield, 1971) and magnetopause (Roelof and Sibeck, 1993). GOES-8 moved through the dayside magnetosphere and local noon from GSE (x,y,z)=(6.3, −2.0, −2.2) to (5.6, 2.7, −2.2) along its geosynchronous orbit.
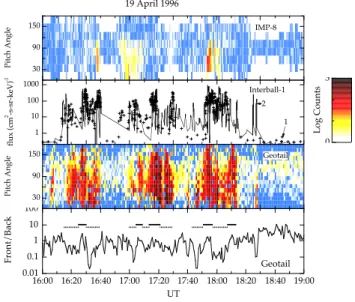
Figure 3 summarizes Geotail, Interball-1, IMP-8, and Wind plasma, magnetic field, and energetic ion observations during the three-hour interval on 19 April 1996. The EPIC instrument on Geotail observed one brief and three prolonged energetic (61.5–73.7 keV) ion bursts: from 16:05 to 16:07, 16:16 to 16:39, 16:59 to 17:29, and 17:44 to 18:13 UT. Dur-ing these bursts, Geotail observed correlated large amplitude plasma density and magnetic field strength variations. The most prominent peaks in the energetic ion flux corresponded to density and magnetic field strength minima (e.g. at 16:07, 16:22, 16:26, 16:29, 17:06, 17:19, 17:26, and 17:54 UT). Consequently, these minima can be interpreted as foreshock cavities excavated by the ion bursts.
33 30 10 -10 ZG S E (R E ) 40 20 0 -20 XGSE (RE) MP BS Geotail 1600 UT 1900 UT IMP-8 1600 UT 1900 UT Interball-1 1600 UT 1900 UT Wind 1600 UT 1900 UT GOES-8 -20 0 20 YG S E (R E ) MP BS Geotail 1600 UT 1900 UT IMP-8 1600 UT 1900 UT Interball-1 1600 UT 1900 UT Wind 1600 UT 1900 UT GOES-8
Figure 2. Ecliptic and meridional projections Fig. 2. Ecliptic and meridional projections of Geotail, Interball-1, IMP-8, Wind, and GOES-8 trajectories from 16:00 to 19:00 UT on 19 April 1996. For comparison, the figure also shows the nominal positions of the bow shock and magnetopause.
By contrast to the large amplitude fluctuations that oc-curred during intervals when energetic ions were present, Geotail observed relatively constant densities and magnetic field strengths during intervals when the flux of energetic ions fell to background levels, e.g. from 16:40 to 17:00 and after 18:10 UT. The modest density and magnetic field strength variations during these intervals were in antiphase (e.g. 18:30 to 19:00 UT), as is generally the case for intrinsic solar wind tangential discontinuities (e.g. Burlaga, 1968).
Now consider the Interball-1 observations, made sev-eral RE further upstream. Interball-1 observed bursts of
en-hanced energetic (46.3–60 keV) ion fluxes from 16:13 to 16:40 UT, 16:52 to 17:36, and 17:52 to 18:12 UT, corre-sponding to the three prolonged bursts at Geotail. As in the case of Geotail, Interball-1 observed correlated magnetic field strength and plasma flux (nV) variations during each of these intervals. However, the amplitudes of these per-turbations were lower than those seen at Geotail. Also like Geotail, Interball-1 observed weak antiphase plasma flux and magnetic field strength variations during intervals when no energetic ions were present (e.g. from 18:30 to 19:00 UT).
34 6 3 B (nT ) Geotail 6 3 B (nT ) Interball-1 3.5 2.5 nV (c m 2-s ) -1 VDP nV (x108) 6 3 B (nT ) IMP-8 700 100 (c m 2-s -s r-k eV ) -1 EPIC 61.5-73.7 keV ions 3 1 n (c m -3) MIT 3 1 n (c m -3) LEP 500 100 (c m 2-s -s r-k eV ) -1 DOK-2 Detector 1 46.3-60 keV ions 6 3 B (nT ) Wind 2.0 0.5 (m -6s 3) 16:00 16:30 17:00 17:30 18:00 18:30 19:00 UT 3DP 70.4 KeV ions (x1015) 3 1 npc (c m -3) 3DP 19 April 1996 0.1 10 (c m -2-s -s t-k eV ) EPE L1 ions 50 < E < 220 keV
Fig. 3. A summary plot of IMP-8, Interball-1, Geotail, and Wind solar wind and foreshock observations from 16:00–19:00 UT on 19 April 1996. The first triplet of panels depicts the IMP-8 GSFC magnetic field strength, MIT ion plasma density, and EPE energetic ion observations. The second triplet of panels shows Interball-1 MIF-M magnetic field strength, VDP ion plasma flux, and DOK-2 energetic ion flux observations. The third triplet of panels shows Geotail MGF magnetic field strength, LEP ion plasma density, and EPIC energetic ion flux observations. The fourth triplet of panels shows Wind MGI magnetic field strength, 3-DP ion plasma density, and 3-DP energetic ion phase space density observations.
Located even further upstream, IMP-8 observed three bursts of energetic (50–220 keV) ions, from 16:17 to 16:39, 16:50 to 17:33, and 17:52 to 18:11 UT, again corresponding to the three bursts at Geotail. The time resolution of the IMP-8 plasma observations does not suffice to determine whether decreases in the density corresponded to bursts of energetic ions or whether the density and magnetic field perturbations were in phase or antiphase. However, because the energetic ion bursts did not correspond to decreases in the magnetic field strength, the bursts at IMP-8 cannot be interpreted as foreshock cavities. Note, however, that there was a small (∼1 nT) decrease in the IMP-8 magnetic field strength when the energetic ion flux peaked at 16:38 UT.
4146 D. G. Sibeck et al.: Radial Dependence of Foreshock Cavities 6 3 B (nT ) Wind 2.0 0.5 (m -6s 3) 16:00 16:30 17:00 17:30 18:00 18:30 19:00 UT 3DP 70.4 KeV ions (x1015) 3 1 npc (c m -3) 3DP 19 April 1996 -5 5 Bx (nT ) -5 5 By (nT ) -5 5 Bz (nT ) -800 -700 Vpc (k m s -1)
Fig. 4. Wind MGI observations of the IMF strength and direc-tion (GSE coordinates), 3-DP ion plasma density, velocity along the Sun-Earth line, and energetic ion phase space density observa-tions. Wind observes energetic ions during intervals when the IMF connects the spacecraft to the bow shock, i.e. when the IMF points sunward and dawnward.
We can use Wind observations to demonstrate that the bursts of energetic ions are observed during intervals when the IMF connects each spacecraft to the bow shock. During the three-hour interval shown in Fig. 4, Wind was located up-stream from the pre-noon bow shock. A sunward and dawn-ward IMF orientation should connect the spacecraft to that boundary. As indicated in Fig. 4, Wind observed energetic ions almost continuously from 16:00 to 18:30 UT, an inter-val of sunward (+Bx) and dawnward (−By) IMF orientation.
By contrast, fluxes fell to background levels after 18:30 UT, when the IMF pointed antisunward and dawnward, and did not connect the spacecraft to the bow shock. Note also that the solar wind velocity varied by no more than 5% about
a mean value of ∼730 m s−1. Any plasma flux or dynamic
pressure variations on this day resulted primarily from den-sity, and not velocity, fluctuations.
We wish to determine whether the differing amplitudes of the perturbations associated with the foreshock cavities observed by Geotail, Interball-1, and IMP-8 are consistent with the model for foreshock cavities described above. To do so, we should first demonstrate that pitch angle distri-butions were more field-aligned at IMP-8 than Interball-1, and more field-aligned at Interball-1 than Geotail. We should then show that flux levels were lower at IMP-8 than Interball-1, and at Interball-1 than Geotail.
Figure 5 provides information about the energetic ion pitch angle distributions observed by Geotail, Interball-1,
and IMP-8. In combination, the northern and southern
heads of the EPIC instrument on Geotail provided good pitch angle coverage throughout this interval. Geotail ob-served nearly isotropic energetic (52.7 to 61.5 keV) ion pitch
37 150 90 30 Pit ch A ng le Geotail 3 0 L o g Co unt s 1 10 100 1000 flux (c m 2-s -s r-k eV ) -1 Interball-1 1 2 150 90 30 Pit ch A ng le IMP-8 19 April 1996 0.01 0.1 1 10 100 F ro nt /B ac k 16:00 16:20 16:40 17:00 17:20 17:40 18:00 18:20 18:40 19:00 UT Geotail
Figure 5. IMP-8, Interball-1, and Geotail energetic ion pitch
Fig. 5. IMP-8, Interball-1, and Geotail energetic ion pitch angle dis-tributions. The top panel shows pitch angle distributions for the L1 (50–220 keV) channel on IMP-8. The second panel compares traces for the antisunward (Detector 1, crosses) and spinning (Detector 2, solid curve) sensors of the DOK-2 instrument on Interball-1. Detec-tor 1 observed ions with energies from 46.3 to 60 keV, whereas De-tector 2 observed ions with energies from 48.2 to 59 keV. The third panel shows Geotail pitch angle distributions for 52.7 to 61.5 keV ions. It was obtained by combining observations from both heads. The bottom panel shows Geotail front to back ratios for the 52.7 to 61.5 keV ions, defined as the ratio of the ion flux with pitch angles
ranging from 0 to 90◦divided by the flux with pitch angles ranging
from 90 to 180◦.
angle distributions and small front to back ratios from 16:25– 16:30 UT, 17:05 to 17:09, 17:14 to 17:21, 17:52 to 17:57, and 18:08 to 18:13 UT (solid bars), but broad beams were streaming away from the bow shock along the magnetic field and large front to back ratios from 16:15 to 16:25, 16:30 to 16:40, 17:00 to 17:05, 17:09 to 17:14, 17:21 to 17:30, 17:43 to 17:51, and 17:57 to 18:08 UT (dashed bars). These hor-izontal bars are repeated in the LEP density panel of Fig. 3 (and other figures in this paper) to demonstrate that the in-tervals of near-isotropic fluxes correspond to energetic ion flux enhancements, and density and magnetic field strength minima.
The EPE instrument on IMP-8 also provided relatively good pitch angle coverage. By contrast to Geotail, IMP-8 never recorded energetic (50 to 220 keV) ions over the full range of pitch angles observed. Instead, it only observed strongly anisotropic bursts of energetic ions streaming sun-ward along the magnetic field at 16:30 UT and from 16:50 to 17:10 and 17:50 to 18:02 UT. The absence of any foreshock cavities at IMP-8 (Fig. 3) indicates that the pressures asso-ciated with these anisotropic distributions failed to excavate any cavities.
Although the DOK-2 instrument on Interball-1 did not provide full pitch angle coverage, some inferences
38 0.001 0.01 0.1 1 10 100 1000 (c m 2 -s -s ter-k eV ) -1 10 2 3 4 5 6 7 8 9100 2 3 4 5 6 7 8 91000 2 3 KeV Interball-1 19 April 1996 (1754 UT) Geotail IMP-8
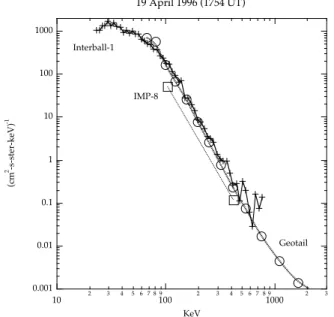
Figure 6. A comparison of Geotail (circles), Interball-1 (crosses0,
Fig. 6. A comparison of Geotail (circles), Interball-1 (crosses, and IMP-8 (squares) energetic ion spectra near 17:54 UT on 19 April 1996. The spectra were selected when the flux peaked: 17:53:17 UT on Geotail, 17:56:39 UT at Interball, and 17:53:55 UT at IMP-8.
concerning energetic ion anisotropies at Interball-1 can be obtained by comparing the observations made by its two de-tectors. Whereas Detector 1 pointed directly antisunward,
Detector 2 pointed 62.5◦ away from the sunward-oriented
spin axis. When the two detectors observe nearly identical flux levels, and Detector 2 observes no spin modulation, we may infer nearly isotropic particle distributions. The obser-vations shown in Fig. 5 indicate that these conditions were generally not met, i.e. that significant anisotropies were usu-ally present. However, the energetic (∼47 to ∼60 keV) ion fluxes approached isotropy at 16:30, 16:40, 17:15–17:20, and 17:53 to 18:02 UT, precisely the times when Fig. 3 indicates the in-phase plasma flux and magnetic field strength varia-tions that identify cavities at Interball-1.
Having shown that pitch angle distributions were often more isotropic at Geotail and Interball-1 than at IMP-8, we now wish to determine whether energetic ion flux levels were higher at Geotail than Interball-1 and higher at Interball-1 than IMP-8. Figure 6 compares energetic ion spectra ob-served by Geotail, Interball-1 (crosses), and IMP-8 (squares) near 17:54 UT at the moment when fluxes peaked at each spacecraft. The comparison indicates that fluxes at Interball-1 reached levels similar to those at Geotail, but that those at IMP-8 were a factor of 3 lower. Over the range of en-ergies from 67.3 to 154 keV, the Geotail spectra is best fit by an exponential, f=f0e−E/E0, with an e-folding energy of E0=26 keV.
To decide whether the observations at 17:54 UT typified those for the entire three-hour interval, we must compare ion fluxes at similar energies. Figure 3 presented IMP-8 obser-vations of 50–220 keV ions, Interball-1 obserobser-vations of 46.3– 60 keV ions, and Geotail observations of 61.5–73.7 keV ions.
39 10 100 D is tanc e (R E ) 0.8 0.4 0.0 co s ΘB n 16:00 17:00 18:00 19:00 UT 100 1000 Co nnec tio n t im e (s ec ) 1 10 100 1000 flux (c m 2-s -s r-k eV ) -1 Geotail(50 keV) Interball-1 (50 keV) IMP-8 (50 keV) 19 April 1996
Fig. 7. A comparison of Geotail, Interball-1, and IMP-8 energetic ion observations with factors thought to control flux levels. The top panel presents energetic ion flux levels observed by Geotail (61.5– 73.7 keV), Interball-1 (46.3–60 keV), and IMP-8 (50–220 keV). For comparison, the flux levels have been extrapolated to those expected at 50 keV under an assumption of an exponential spectra with an e-folding energy of 26 keV. The second panel presents the distances of each spacecraft from the bow shock along the IMF. The third panel depicts the length of time each field line had been connected to the bow shock when it encountered the observing spacecraft. The
bot-tom panels presents cos 2Bn, the angle between the IMF field line
connecting observing spacecraft to the bow shock and the normal to the bow shock at the point of intersection.
The top panel of Fig. 7 compares the same observations, but at energies of 50 keV, assuming exponential spectra with an e-folding energy of 26 keV. Despite flux variations greater than two orders of magnitude at each spacecraft, fluxes at Interball-1 were almost invariably less than those at Geotail, while those at IMP-8 were almost invariably less than those at Interball-1. We conclude that the ordering of the observa-tions at 17:54 UT typifies that for the entire three-hour inter-val.
We now wish to determine whether the systematic differ-ences in energetic ion flux levels, energetic ion pitch angle distributions, and plasma and magnetic field perturbation am-plitudes seen by IMP-8, Interball-1, and Geotail primarily re-sult from: 1) different distances of the three spacecraft along
4148 D. G. Sibeck et al.: Radial Dependence of Foreshock Cavities 1.2 1.0 0.8 0.6 0.4 0.2 0.0 (Q m ax -Q m in )/Q ave 30 20 10 0 R (RE) Geotail Interball-1 IMP-8
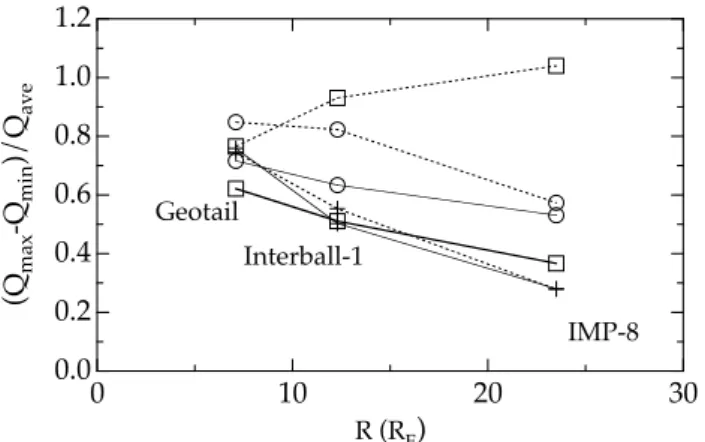
Fig. 8. Normalized values for the density (solid lines segments) and magnetic field strength (dashed line segments) variations as a function of distance along the IMF from the bow shock during three time intervals 16:00–16:40 (crosses), 16:50 to 17:35 (circles), and 17:40 to 18:15 (squares) UT.
the IMF to the bow shock, 2) different bow shock connection times for the IMF field lines within the events, or 3) different 2Bnat the intersection of the IMF lines with the bow shock.
The lower three panels of Fig. 7 provide the information needed to test these hypotheses. As can be seen in the second panel of Fig. 7, the distance from IMP-8 to the model bow shock (Fairfield, 1971) along the IMF was invariably greater than that for Interball-1, while Interball-1 was invariably fur-ther than Geotail. We have assumed that fur-there are no kinks in the IMF lines between the spacecraft and the bow shock, and no values for the distance are shown when the IMF did not connect the spacecraft to the model bow shock. Con-sequently, the distance from the bow shock along the IMF provides a good explanation for the transition from high flux levels and isotropic ion distributions at Geotail, to low flux levels and anisotropic distributions at IMP-8.
Now consider the two alternatives, namely that energetic ion flux levels and pitch angle distributions are determined primarily by the length of time field lines are connected to the bow shock or by 2Bnat the point the field lines intersect
the bow shock. To calculate the length of time a field line has been connected to the bow shock, we simply convect the line with the observed solar wind speed at 1-min time steps from the point of its initial connection, where it lies tangent to the bow shock, until it reaches the location of the observ-ing spacecraft. As can be seen in the third panel of Fig. 7, the field lines observed by Geotail were not systematically connected to the bow shock longer than those observed by Interball-1, nor were those observed by Interball-1 systemat-ically connected longer than those observed by Geotail. In addition, as shown in the bottom panel of Fig. 7, there were no systematic differences in the angles between the IMF lines observed by the spacecraft and the normal to the model bow shock (Fairfield, 1971) at their point of intersection.
Consequently, we conclude that the primary factor con-trolling flux levels and pitch angle distributions in the region
upstream from the bow shock is the distance of the observ-ing spacecraft from the bow shock along the IMF lines. Fig-ure 8 presents the normalized peak-to-peak amplitude of the density/plasma flux (solid lines) and magnetic field strength (dashed lines) variations at Geotail, Interball-1, and IMP-8, as a function of distance from the bow shock during three energetic ion burst intervals: 16:00 to 16:40 (crosses), 16:50 to 17:35 (circles), and 17:40 to 18:15 UT (boxes). Geo-tail magnetic field observations were averaged to 6 s for this plot. Density/plasma flux observations were averaged to 24-, 15-, and 21.6-s time resolution for Geotail, Interball-1, and IMP-8, respectively. The peak-to-peak amplitudes were nor-malized by the mean values during each interval, and the val-ues were plotted at the value for the minimum distance con-necting each spacecraft to the bow shock. With one excep-tion, the figure clearly demonstrates the predicted decrease in plasma and magnetic field perturbation amplitudes with dis-tance upstream from the bow shock. The exception occurs during the interval from 17:40–18:15 UT, during which IMP-8 observed considerably larger magnetic field strength vari-ations than Interball-1, and Interball-1 observed larger mag-netic field strength variations than Geotail. These variations were apparently caused by very weak fields at the former spacecraft that went unobserved by Geotail.
4 Pre-noon foreshock and magnetospheric observa-tions.
Neither IMP-8 nor Interball-1, nor even Geotail, observed the precise sequence of solar wind or foreshock-modified plasma and magnetic field parameters that actually struck the dayside magnetosphere. To demonstrate this, we compare post-noon observations of the IMF orientation by IMP-8, Interball-1, and Geotail with pre-noon observations by Wind. We then compare observations of the solar wind input by each of these four spacecraft with observations of the magnetospheric re-sponse by GOES-8.
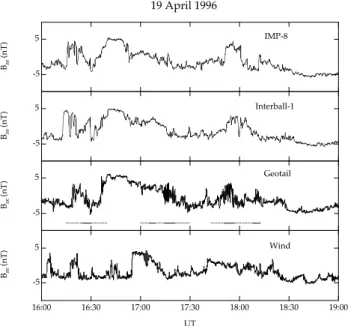
Figure 9 presents observations of IMF Bz by IMP-8,
Interball-1, Geotail, and Wind in GSE coordinates. As they were all located upstream from the post-noon bow shock, one would expect IMP-8, Interball-1, and Geotail to observe sim-ilar solar wind features. In broad terms, they did observe a gradual southward rotation from 16:50 to 17:15 UT, follow-ing an abrupt northward turnfollow-ing shortly after 16:30 UT. How-ever, close inspection reveals some discrepancies on shorter time scales. For example, IMP-8 observed two intervals of northward IMF prior to 16:30 UT, Interball-1 three intervals but Geotail only one interval.
As Wind was located upstream from the dawn bow shock, we expect its observations to differ from those of IMP-8, Interball-1, and Geotail. Figure 9 confirms that this was in-deed the case. While Wind observed an abrupt northward turning at 16:55 UT, it also observed a much more rapid subsequent rotation back to southward IMF orientations than any of the other spacecraft. The preceding northward turn-ing(s), so prominent at the other spacecraft, were far less
42 -5 5 Bze (nT ) 16:00 16:30 17:00 17:30 18:00 18:30 19:00 UT Wind -5 5 Bze (nT ) Geotail -5 5 Bze (nT ) Interball-1 -5 5 Bze (nT ) IMP-8 19 April 1996
Figure 9. IMP-8, Interball-1, Geotail, and Wind observations of IMF
Fig. 9. IMP-8, Interball-1, Geotail, and Wind observations of IMF
Bzin GSE coordinates from 16:00–19:00 UT on 19 April 1996.
pronounced at Wind. Some or all of these discrepancies may result from the differing lag times required for solar wind features to move from one spacecraft to another (Weimer et al., 2002).
We conclude that during the interval under study, the pris-tine IMF structure, unperturbed by processes within the fore-shock, varied over distances comparable to the dimensions of the magnetosphere.
However, the processes that occur within the foreshock in-troduce far greater spatial variations, at least in the plasma parameters that batter the magnetosphere. IMF orientations that connected IMP-8, Interball-1, and Geotail to the bow shock did not connect Wind, and vice versa. Consequently, foreshock cavities generated at the first three spacecraft can-not correspond to those at the latter. Returning to Fig. 3, we note that Wind observed a pattern of magnetic field strength, density, and energetic ion phase space density variations that differs from those seen by the other spacecraft. In particular, with the exception of two very transient foreshock cavities at 16:06 and 18:05 UT that occurred in response to strong bursts of energetic ions, Wind observed far steadier magnetic field strengths and densities than either Interball-1 or Geo-tail. Nevertheless, Wind did observe prominent foreshock cavities later on this day when the IMF connected it to the bow shock (Sibeck et al., 2002).
Pressure variations generated within the foreshock, and those intrinsic to the solar wind, launch fast mode waves when they strike the bow shock (Thomas and Brecht, 1988). Because the sum of the fast mode and magnetosheath ve-locities is approximately equivalent to that of the solar wind itself, pressure fronts in the magnetosheath keep pace with those in the solar wind. Consequently, the sequence of pres-sure variations striking the magnetopause should correspond
43 150 140 130 120 110 100 B (nT ) 16:00 16:30 17:00 17:30 18:00 18:30 19:00 UT GOES-8 4 2 0 n (c m -3 ) LEP Geotail 3 0 # (10 8 c m 2-s ) -1 VDP Interball-1 4 2 0 n (c m -3) MIT IMP-8 4 2 0 npc (c m -3) 3DP Wind 19 April 1996
Fig. 10. A comparison of the solar wind density observed by IMP-8, the solar wind flux (nV) observed by Interball-1, the solar wind den-sity observed by Geotail, the solar wind denden-sity observed by Wind, and the dayside geosynchronous magnetic field strength observed by GOES-8 from 16:00 to 19:00 UT on 19 April 1996.
to that of solar wind density variations incident on the bow shock. Each pressure variation striking the magnetopause should, in turn, launch a fast mode wave into the magne-tosphere. Thus, observations by dayside geosynchronous spacecraft provide an opportunity to determine which, if any, of the solar wind monitors available on this day observed the precise sequence of density and pressure variations that ac-tually struck the magnetosphere. Past work indicates that the dayside geosynchronous magnetic field strength responds di-rectly and immediately to each and every one of the abrupt (1–10 min) variations in the solar wind and foreshock dy-namic pressure seen by spacecraft located directly upstream of the subsolar bow shock (e.g. Sibeck et al., 1989a; Fairfield et al., 1990).
The bottom panel of Fig. 10 presents GOES-8 geosyn-chronous magnetic field strength observations from 16:00 to 19:00 UT on 19 April 1996. GOES-8 observed a se-quence of three crater-like magnetic field strength vari-ations, with depressions centered on 16:30, 17:00, and 18:15 UT bounded by transient magnetic field strength en-hancements. Despite the similarity of these crater-like mag-netic field strength structures to the density and magmag-netic
4150 D. G. Sibeck et al.: Radial Dependence of Foreshock Cavities field strength variations expected for foreshock cavities,
there is no one-to-one relationship between the geosyn-chronous magnetic field strength variations and the density (or flux) variations seen by any of the solar wind moni-tors available on this day. We conclude that accurate pre-dictions of the geosynchronous magnetic field require solar wind observations from a monitor located immediately up-stream from the subsolar bow shock, not far off the Sun-Earth line nor far upstream at the L1 point.
5 Summary and conclusion
Processes within the foreshock introduce substantial varia-tions into the incoming solar wind shortly before it interacts with the bow shock and magnetosphere. Because energetic ion fluxes should diminish exponentially and pitch angle dis-tributions vary from isotropic to field-aligned with distance upstream, theory predicts the perturbations to attain great-est amplitudes immediately upstream from the bow shock. The observations presented in this paper confirm these pre-dictions. Geotail, located ∼7 REupstream from the nominal
bow shock observed strong, and sometimes repetitive, den-sity and magnetic field strength perturbations in antiphase with energetic ion flux variations. Interball-1, ∼13 RE
up-stream from the bow shock, observed only weak
perturba-tions. IMP-8, ∼23 RE upstream from the bow shock,
ob-served almost no foreshock related density or magnetic field strength perturbations.
The pressure of the energetic ions perpendicular to the magnetic field excavates the foreshock cavities. As theory predicts, the flux of energetic ions diminished from Geo-tail to IMP-8 at all energies and the energetic ion pitch an-gle distributions were frequently nearly isotropic at Geotail, but invariably field-aligned at IMP-8. Statistical studies have demonstrated that the e-folding distances for flux decreases range from 3.3 RE for 10 keV ions to 11.7 RE for 67.3 keV
ions (Trattner et al., 1994), and that the transition in the pitch angle distributions of 50 keV ions from isotropic to field-aligned transpires within the region 15 REupstream from the
bow shock (Mitchell et al., 1983). We therefore conclude that foreshock cavities with significant amplitudes can only
be observed within ∼10 to 15 RE upstream from the bow
shock.
This conclusion is consistent with previously reported re-sults. Sibeck et al. (1989a) and Fairfield et al. (1990) pre-sented several case studies in which the IRM spacecraft ob-served sizeable density and magnetic field strength variations (δn/n=δB/B∼1). By contrast, Sibeck et al. (2001) reported a statistical survey of IMP-8 observations indicating rela-tively minor density and magnetic field strength variations
(δn/n=δB/B∼0.2). With an apogee of ∼18 RE, the IRM
could only observe the foreshock in the immediate vicinity of the subsolar bow shock where prominent foreshock cav-ities are expected. IMP-8 observed the foreshock at radial distances from Earth, ranging from 30 to 40 RE, where
fore-shock cavities should be less prominent.
The significance of the foreshock cavities lies in their abil-ity to modify the solar wind parameters striking the dayside
magnetosphere. Murr and Hughes (2003) have recently
demonstrated a one-to-one relationship between foreshock cavities and the isolated mesoscale whirls of ionospheric convection seen on the edge of the polar cap and known as traveling convection vortices. Because the foreshock cavi-ties are common and their factor of 2 to 3 density variations exceed those generally seen in the solar wind, we think it likely that they also represent a major contributor to the ir-reducible, and as yet inexplicable, large-amplitude fluctua-tions in magnetopause location about its mean position (e.g. Roelof and Sibeck, 1993). Pressure variations associated with the cavities may trigger bursts of reconnection on the dayside magnetopause (Elphic, 1992) or even generate signa-tures that mimic reconnection-produced flux transfer events (Sibeck, 1990), and the foreshock cavities must be a major source of transient compressions and rarefactions in the day-side magnetospheric magnetic field strength (e.g. Borodkova et al., 1995; Sanny et al., 2001). Our comparison of IMP-8, Interball-1, Geotail, and Wind observations indicates that verifying these hypotheses will either require observations in the subsolar foreshock or the ability to predict conditions in that region from observations made further upstream or off the Sun-Earth line.
Acknowledgements. We thank T. Nagai for providing high
resolu-tion Geotail magnetometer observaresolu-tions via the DARTS data server at ISAS, R. B. Decker for the IMP-8 CPME observations, A. Szabo for the IMP-8 GSFC magnetometer observations, A. J. Lazarus for the IMP-8 MIT plasma observations, R. W. McEntire and J. Van-degriff for the Geotail EPIC observations, R. Lin and T.-D. Phan for the Wind 3-DP plasma observations, R. P. Lepping for the Wind GSFC magnetometer observations, and S. Romanov for the Interball-1 magnetometer observations. H. J. Singer provided very helpful comments on an earlier draft of the paper. The authors also thank both referees for their comments. Many of the data sets used in this study were supplied by the NASA/GSFC CDAWeb data server. K. Kudela acknowledges support from Slovak VEGA Grant Agency Project 4064.
Topical Editor M. Lester thanks H. L¨uhr and another referee for their help in evaluating this paper.
References
Borodkova, N. L., Zastenker, G. N., and Sibeck, D. G.: Transient magnetic-field events at geosynchronous orbit and their solar-wind origin, J. Geophys. Res., 100, 5643–5656, 1995.
Burlaga, L. F.: Micro-scale structures in the interplanetary medium, Solar Phys., 4, 67–92, 1968.
Fairfield, D. H.: Average and unusual locations of the Earth’s mag-netopause and bow shock, J. Geophys. Res., 76, 6700–6716, 1971.
Fairfield, D. H., Baumjohann, W., Paschmann, G., L¨uhr, H., and Sibeck, D. G.: Upstream pressure variations associated with the bow shock and their effects on the magnetosphere, J. Geophys. Res., 95, 3773–3786, 1990.
Gosling, J. T., Asbridge, J. R., Bame, S. J., Paschmann, G., and Sckopke, N.: Observations of two distinct populations of bow
shock ions in the upstream solar wind, Geophys. Res. Lett., 5, 957–960, 1978.
Greenstadt, E. W., Russell, C. T., and Hoppe, M.: Magnetic field orientation and suprathermal ion streams in the Earth’s fore-shock, J. Geophys. Res., 85, 3473–3479, 1980.
King, J. H.: Availability of IMP-7 and IMP-8 data for the IMS pe-riod, in The IMS Source Book: Guide to the International Mag-netospheric Study Data Analysis, edited by C. T. Russell and D. J. Southwood, pp. 10–20, AGU, Washington, D. C., 1982. Klimov, S., Romanov, S., Amata, E., et al.: ASPI experiment:
Mea-surements of fields and waves onboard the Interball-1 spacecraft, Ann. Geophys., 15, 514–527, 1997.
Kokubun, S., Yamamoto, T., Acu”˜na, M. H., Hayashi, K., Sh-iokawa, K., and Kawano, H.: The Geotail magnetic field experi-ment, J. Geomagn. Geoelectr., 46, 7–21, 1994.
Lee, M. A.: Coupled hydromagnetic wave excitation and ion accel-eration upstream of the Earth’s bow shock, J. Geophys. Res., 87, 5063–5080, 1982.
Lepping, R. P., Acu˜na, M. H., Burlaga, L. F., et al.: The Wind mag-netic field investigation, Space Sci. Rev., 71, 207–229, 1995. Lin, R. P., Anderson, K. A., Ashford, S., et al.: A three-dimensional
plasma and energetic particle investigation for the Wind space-craft, Space Sci. Rev., 71, 125–153, 1995.
Lutsenko, V. N., Kudela, K., and Sarris, E. T.: The DOK-2 ex-periment to study energetic particles by Tail Probe and Auroral Probe satellites in the Interball project, Cos. Res. (Engl. Trans.), 36, 93–102, 1998.
Mitchell, D. G. and Roelof, E. C.: Dependence of 50-keV upstream ion events at IMP7&8 upon magnetic field bow shock geometry, J. Geophys. Res., 88, 5623–5634, 1983.
Mitchell, D. G., Roelof, E. C., Sanderson, T. R., Reinhard, R., and Wenzel, K.-P.: ISEE/IMP observations of simultaneous upstream ion events, J. Geophys. Res., 88, 5635–5644, 1983.
Mukai, T., Machida, S., Saito, Y., Hirahara, M., Terasawa, T., Kaya, N., Obara, T., Ejiri, M., and Nishida, A.: The low energy parti-cle (LEP) experiment onboard the Geotail satellite, J. Geomagn. Geoelectr., 46, 669–692, 1994.
Murr, D. L. and Hughes, W. J.: Solar wind drivers of trav-eling convection vortices, Geophys. Res. Lett., 30, doi: 10.1029/2002GL015498, 2003.
Paschmann, G., Sckopke, N., Bame, S. J., Asbridge, J. R., Gosling, J. T., Russell, C. T., and Greenstadt, E. W.: Association of low-frequency waves with suprathermal ions in the upstream solar wind, Geophys. Res. Lett., 6, 209–212, 1979.
Roelof, E. C. and Sibeck, D. G.: Magnetopause shape as a
bivari-ate function of interplanetary magnetic field Bzand solar wind
dynamic pressure, J. Geophys. Res., 98, 21 421–21 450, 1993. Safrankova, J., Zastenker, G., Nemecek, Z., Fedorov, A.,
Simer-sky, M., and Prech, L.: Small scale observation of magnetopause motion: Preliminary results of the INTERBALL project, Ann. Geophys., 15, 562–569, 1997.
Sanny, J., Berube, D., and Sibeck, D. G.: A statistical study of tran-sient event motion at geosynchronous orbit, J. Geophys. Res., 106, 21 217–21 229, 2001.
Scholer, M., Ipavich, F. M., Gloeckler, G., Hovestadt, D., and Klecker, B.: Pitch angle distributions of energetic protons near the Earth’s bow shock, Geophys. Res. Lett., 6, 707–710, 1980. Schwartz, S. J., Chaloner, C. P., Christiansen, P. J., Coates, A. J.,
Hall, D. S., Johnstone, A. D., Gough, M. P., Norris, A. J., Rijn-beek, R. P., Southwood, D. J., and Woolliscroft, L. J. C.: An ac-tive current sheet in the solar wind, Nature, 318, 269–271, 1985. Sibeck, D. G.: Transient events in the outer magnetosphere – Boundary waves or flux-transfer events, J. Geophys. Res., 97, 4009–4026, 1992.
Sibeck, D. G. and Korotova, G. I., Occurrence pattterns for transient magnetic field signatures at high latitudes, J. Geophys. Res., 101, 13413–13428, 1996.
Sibeck, D. G., Baumjohann, W., Elphic, R. C., et al.: The mag-netospheric response to 8-min-period strong-amplitude upstream pressure variations, J. Geophys. Res., 94, 2505–2519, 1989a. Sibeck, D. G., Baumjohann, W., and Lopez, R. E.: Solar-wind
dy-namic pressure variations and transient magnetospheric signa-tures – Reply, Geophys. Res. Lett., 16, 1200–1202, 1989b. Sibeck, D. G., Decker, R. B., Mitchell, D. G., Lazarus, A. J.,
Lep-ping, R. P., and Szabo, A.: Solar wind preconditioning in the flank foreshock: IMP-8 observations, J. Geophys. Res., 106, 21 675–21 688, 2001.
Sibeck, D. G., Phan, T.-D., Lin, R., Lepping, R. P., and Szabo, A: Wind observations of foreshock cavities: A case study, J. Geo-phys. Res., 107, 10.1029/2001JA007539, 2002.
Singer, H. J., Matheson, L., Grubb, R., Newman, A., and Bouwer, S. D.: Monitoring space weather with the GOES magnetometers, in GOES 8 and Beyond, edited by E. R. Washwell, Proc. SPIE Int. Soc. Opt. Eng., 2812, 299–308, 1996.
Sonnerup, B. U. O.: Acceleration of particles reflected at a shock front, J. Geophys. Res., 74, 1301–1304, 1969.
Terasawa, T.: Origin of 30∼100 keV protons observed in the up-stream region of the Earth’s bow shock, Planet. Space Sci., 27, 365–384, 1979.
Thomas, V. A. and Brecht, S. H.: Evolution of diamagnetic cavities in the solar wind, J. Geophys. Res., 93, 11 341–11 353, 1988. Thomas, V. A., Winske, D., and Thomsen, M. F.: Simulation of
upstream pressure pulse-propagation through the bow shock, J. Geophys. Res., 100, 23 481–23 488, 1995.
Trattner, K. J., M¨oebius, E., Scholer, M., Klecker, B., and Hilchen-bach, M.: Statistical analysis of diffuse ion events upstream of the Earth’s bow shock, J. Geophys. Res., 99, 13 389–13 400, 1994.
Weimer, D. R., Ober, D., Maynard, N. C., Burke, W. J., Collier, M. R., McComas, D. J., Ness, N. F., and Smith, C. W.: Variable time delays in the propagation of the interplanetary magnetic field, J. Geophys. Res., 107, doi:10.1029/2001JA009102, 2002. Williams, D. J., McEntire, R. W., Schlemm II, C., Lui, A. T.
Y., Gloeckler, G., Christon, S. P., and Gliem, F.: Geotail en-ergetic particles and ion composition instrument, J. Geomagn. Geoelectr., 46, 39–57, 1994.