ACTIVE SOLAR RETROFIT OF A RESIDENTIAL HOUSE, A CASE STUDY IN EGYPT
Shady AttiaArchitecture et Climat, Université Catholique de Louvain, 1348- Louvain La Neuve, Belgium
André De Herde Architecture et Climat, Université Catholique de Louvain
ABSTRACT
There are extraordinary opportunities to reduce the consumption of fossil energy in retrofitting existing buildings in Egypt. For instance, South Tahrir (150km northwest of Cairo) falls in the arid climate zone with an annual-average daily global irradiation value of 23.76 MJ/m2 and for diffuse irradiation they are 9.65 MJ/m2 for Cairo and approximately 3300 hours of full sunshine. However, in extreme climates like Egypt, conditions show relatively high demand for cooling and heating energy. To overcome this problem and to examine these opportunities, this study evaluated the active solar retrofit of a passive house built in South Tahrir city. The aim of the study was to investigate the potential of active solar retrofits. The building performance was evaluated using TRNSYS, and monitored during two years of occupancy (2004-2006) to evaluate the performance and energy/carbon emissions reduction. The research took into consideration active design strategies such as solar thermal domestic water heating, photovoltaic panels and solar thermal air conditioning. First, the performance of the passive house before and after the retrofit was represented and compared. The house thermal and electric loads were compared to the solar thermal and electric production. Then results were evaluated to assess the suitability of each strategy based on energy performance. The final result of this study proved theoretically the feasibility of installing solar hot water collectors and solar thermal air conditioning. For this specific location and climate conditions an active solar retrofit of the residential house is energetically rewarding. Future solutions should address all of the thermal loads (cooling, heating, DHW) with thermal energy collection and only the electric loads (internal loads and auxiliary components) with photovoltaic collection. However, as long as the prices of electricity are highly subsidized the active solar retrofit is still considered not be cost effective.
1. INTRODUCTION
Almost fifty years ago, Egypt started its large scale desert development project in an effort to create new land for
Egypt’s rapidly growing population. The overarching objective was to find a solution to problems of rural unemployment and urban overcrowding and to achieve growth in exports and food security. Also the project called for development of more desert farmlands and communities. The goal was to achieve zero energy buildings without tapping into the national electrical grid. Burdened with technical, financial, and political problems, the early desert development efforts failed [1].
Now, and almost 50 year later, Egypt’s large population suffers from the magnitude of the same problems in addition to more and more reliance on and demand for energy. Despite the low electricity consumption rates in Egypt (1120 kWh/capita in 2002) compared to international rates, electricity consumption for residential purposes increased by 12 % in 2007 [2]. In summer 2008, the total electric demand peaked to 21,530 MW, compared to 19,250 in 2007. Consequentially, most governorates, especially Upper Egypt (South), witnessed daily blackouts ranging from 5 to 8 hours.
Analyses confirm that an increased spread of energy-intensive appliances in households is one of the major reasons. Additionally, the last decade witnessed longer hot summers. As a result the hot seasons have been extended from April to October. Therefore, more than half of peak load of energy consumption is used to satisfy air conditioning demands alone. In 2008, annual sales of air conditioners (AC) reached 150,000 units. Consequently, air-conditioning of buildings became the single largest consumer of electricity and it accounts for nearly 60% of the nation’s peak power demand and over 30% (6,500 MW) of annual power consumption in the residential sector. This demand is expected to grow annually by more than 12% [3, 4].
1.1 Solar Retrofit as a Solution
However, there is no doubt that one resource Egypt has in abundance is the sun. Therefore, implementing active solar retrofit plans, on a large scale, is the main solution to reduce the energy used in housing for cooling. Therefore, the main focus of this research is to investigate the potential of active
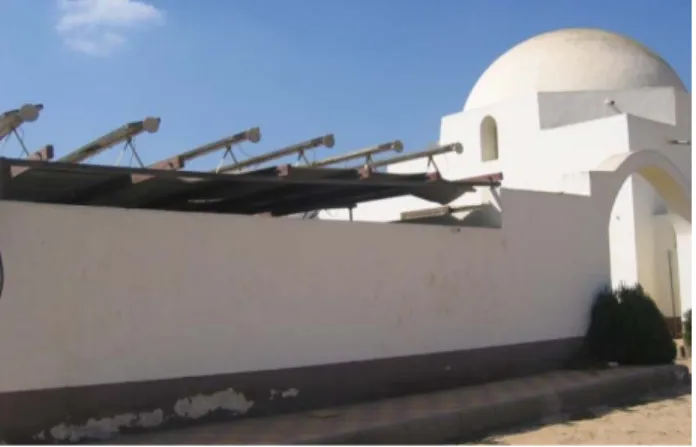
solar retrofits. A passive design farm-house in South Tahrir was selected as a case study. The building performance was evaluated using TRNSYS, and monitored during two years of occupancy (2004-2006) to evaluate the performance and energy/carbon emissions reduction. The research took into consideration active design strategies including solar domestic water heating (DHW), photovoltaic electricity generation and solar thermal air conditioning (SAC). 2 CASE STUDY: PASSIVE HOUSE IN SOUTH TAHRIR Out on the buff-colored desert, halfway between Cairo and Alexandria in an area called South Tahrir, where the dry hot winds sweep along sucking moisture from every living thing, there lies a green pasture farm with a Passive Solar House (PSH) (Fig. 1). The PSH was constructed for the American University in Cairo (AUC) Desert Development Center (DDC), which uses its 578 acres as a nucleus for strategic desert development including agricultural experiments and energy efficient architecture. The vision of the DDC was to design sustainable and ecologically friendly buildings. To determine the appropriate methods to achieve such a design, a PSH demonstration facility, serving as a pilot project, was constructed on-site to test and demonstrate various practices.
Fig. 1: The passive solar house, South Tahrir, East façade 2.1 Baseline House Description
The South Tahrir PSH is located at 30.55o latitude north, 30.67o longitude east and 197 m above sea level in an open reclaimed farm. The PSH was built in 1980’s by architect Samir Hosni, professor of architecture at Alexandria University, as a prototypical farm-house to accommodate one single family. The architect followed Hassan Fathy’s architecture principles and ideas, incorporating Egyptian vernacular strategies which considerably enhance thermal comfort by lowering temperatures indoors and outdoors [5]. Additionally, and in an attempt to integrate the philosophy of the DDC for sustainable desert development, the architect integrated passive design archetypes which had disappeared from fashion for being considered arcane and pejoratively indigenous. The building is built of adobe bricks made from local materials. The building architecture is combining domes, vaults and
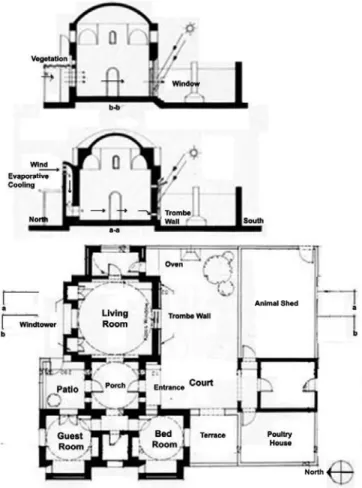
Fig. 2: Plan and section of the passive solar house.
interior courtyards. The baseline PSH is a one story home of approximately 180 m2 of livable space. As shown in Figure 2, the living spaces are separated from the animals' sheds and storage area by a courtyard. The entrance porch, accessed from the courtyard, opens on the other side onto the patio and divides the house into a sleeping area to the left (bedrooms and a bathroom) and a living area to the right (living/dining room and kitchen).
The structure is of heavy, thick load bearing adobe brick walls and high adobe brick domes used to optimize natural thermal patterns and keep the building cool through the hot weather. The floor was finished with ceramic tiles to maximize the total accessible volume of thermal mass materials that has its surface exposed to cool air. Cross-ventilation, wind tunnels humidifying the air, Trombe walls (Fig. 3) and the planted patio constitute the main passive cooling systems, while direct and indirect heat gain through glazed windows and Trombe walls are used for passive heating [6, 7]. Table 1 lists the general description of the building and some material properties for the construction assemblies used.
Table 1: Building description
Baseline building description PSH Shape Height Volume Wall area Wall Thickness Roof area Floor area Windows area Trombe wall area Exterior Wall U-Value Roof U-value Floor U-value Rectangular ( 16 m x 12 m) 4 m height 788 m3 214 m2 0.6 m 196 m2 196 m2
22.24 m2, 11% of total wall area 6 m2
0.4 W/m2 K 0.29 W/m2 K 0.35 W/m2 K
2.2 The climate of South Tahrir
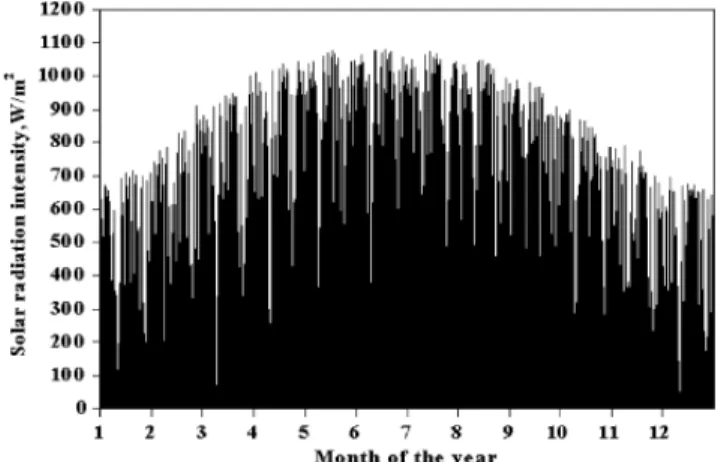
The weather patterns in South Tahrir are characterized by being extremely hot and dry (Group B, according to Köppen Classification). Average annual precipitation is 17mm; and average daily temperature during July is 34.4 oC (93.9° F) and 16.2 oC (61° F) during winter. However, wide variations of temperature occur in South Tahrir, ranging from a maximum of 39° C (102° F), during daylight hours, to a minimum of 8° C (46° F) before sunrise. Moreover, hot spring winds reach high velocities and carry great quantities of sand and dust from the desert. For this study, climate data were obtained from the Egyptian Meteorology Authority (EMA). Solar irradiation is very strong, and may reach 40.68 MJ/m2 on a horizontal surface (per day during June and July). The intensity of solar radiation during the winter (January/February) is relatively high and reaches 33.48 MJ/m2 on a south-facing vertical surface, and about 24.12 MJ/m2 on a horizontal surface (Fig. 4). These conditions make South Tahrir an almost ideal location for buildings that achieve thermal comfort in the winter by employing solar energy.
Fig. 4: Solar irradiation on a horizontal surface of a typical year for South Tahrir, Egypt. (EOG)
2.3 Occupants
The PSH is a single family one story home, only one hour drive from Cairo. The active solar retrofit plan started one year after the farm manager moved into the house with his family. During working days, the house is generally empty in the morning and occupied after 3 p.m until 8 to 9 a.m in the next morning. The house is not served with natural gas, which makes the users dependent on the electric grid except for cooking purposes where gas canisters are used. The house is equipped with a variety of residential appliances. For example, each space in the house includes a ceiling fan, which is excessively used during summer. Also occupants installed three AC units. The house is equipped with an electric water heater and has two mobile electric space heaters, which are excessively used in winter nights. Additionally, the house is equipped with conventional appliances such as lighting fixtures, clothes washer, refrigerator, freezer and television.
2.4 Thermal comfort criteria for South Tahrir
Achieving thermal comfort in hot arid climates requires the knowledge of the maximum internal air and surface temperatures that could be tolerated before having to provide supplementary cooling. Figure 5 shows a simplified graph of the human thermal comfort zone plotted onto the standard comfort zone as quantified by ASHRAE Standard [8]. In South Tahrir, the comfort zone may shift slightly to the right, about 3 oC, as indicated by the dark blue oval, because Egyptians are more comfortable at higher temperatures. Also in a country like Egypt people are used to acclimatization. People tolerate more variation in thermal conditions, and are comfortable over a wider range of temperatures [9]. Acceptable indoor air temperature for South Tahrir, range between 24 degrees C and 29 degrees C (75° and 84° F), with relative humidity between 20% and 50% and air velocity 0.5 to 1.5 m/s [10, 11]. When
temperatures fall below 23 degrees C (73.4° F), solar exposure is desirable; above 31 degrees C (87.8° F), cooling is required for comfort. The solar radiation is desirable in most of December, January and February, as well as in the morning and late evening in November, March, April and May. Conversely, cooling and air movement, in lower humidity conditions, are needed during midday and afternoon hours in May through October.
Fig. 5: Psychometric chart for Egypt 3. ACTIVE SOLAR RETROFIT
The goal of this study is to investigate the potential of active solar retrofits in order to reduce dependency on non-renewable energy. The research developed three active retrofit strategies including thermosyphon for DHW, PV panels for electricity generation and thermal SAC system for cooling. Each strategy is explained in the following sections.
3.1 Solar Thermal Water Heating
For DHW, several choices were available. However, for the case of South Tahrir, using a simple water heating system that serves the house was a practical solution. A market survey determined the selection of the single thermosyphonic Dimas Solar System, shown in Figure 6. The 2 m2 solar collectors are connected to a 160 L storage tank mounted on top of the house roof. The device was installed on the roof and oriented to the south with a tilt angle of 40o from the horizontal. This orientation was chosen to provide hot water during winter. During the hot long summer that extends from April to October the system is turned off. This is due to the high dry bulb temperatures that average as high as 32°C during summer.
3.2 Solar Electric System
The intensity of the sun in South Tahrir is high as it is a part of the Sahara, making Egypt, a magnet for solar harnessing. In South Tahrir, total annual irradiation is between 19.62 and 24. MJ/m2 [12]. Therefore, PV panels are part of the active retrofit strategies. A 26 m2 PV array was placed on
the roof of the store room and animals sheds, with a nominal output of 3.1 kWp producing approximately 5,800 kWh/year.
Fig. 6: Dimas Solar Thermosyphon installed on the roof The panels are made of polycrystalline cells (module efficiency 12.5%) and are mounted on the flat roof with 30o inclination (Fig. 7). The PV system was donated through the World Bank which has also provided monitoring equipments. The system also uses one SMA SB7000 Inverter. During the night, the house will draw electricity from the electric company. A data logger records the performance of the system in operation and the solar electricity that is used directly in the house. The electricity generated by the PV array supplied first the house and the generation over the demand was exported to the grid. Net metering, in which the electricity meter runs to reverse when electricity is fed back to the grid was applied in order to measure the annual energy balance.
Fig. 7: The house with PV panels array 3.3 Solar Thermal Air Conditioning
As part of the active solar retrofit it was planned to install a SAC System to meet the dominant cooling demand during the summer season. The same company that provided the thermosyphon was asked to deliver a water absorption refrigeration chiller (LiBr). Because, the high cost of the the SAC system and the difficulty of finding a vendor in the Egyptian market who provides the system with technical
support the system was excluded from the experimental research endeavor. However, based on the monitoring results the SAC was investigated in the simulation part of the study.
4. EXPERIMENTAL RESULTS
In order to compare the performance of the baseline PSH to the new Retrofitted Passive Solar House RPSH two monitoring periods were set (August 2004-2005 and August 2005-2006). The monitoring was done as part of a project administered and financed by the DDC. Various sensing and monitoring devices were installed. The monitoring methodology followed the international standard outline (ISO 9459-3 Performance test for solar systems) [13]. However, for the PSH in South Tahrir some deviations took place in order to lower the cost and simplify the monitoring process. First, an electricity E-meter was installed to measure the input and output of energy consumption in kilowatt hours. Secondly, the solar collectors for the thermosyphon included tracking control of thermo sensors and flow meters (two temperature sensors: one in cold water inlet and one in hot water outlet). Several data loggers were used and the data was combined together in one data file. In order to allow meaningful comparisons between the different systems, a standardized approach was followed. The energy contributed by the solar systems was converted into kWh.
4.1 Experimental Results – Baseline PSH
The experimental results were based on measuring and recording the electric consumption before the retrofit. The baseline PSH was monitored for 12 months from August
Fig. 8: First monitoring period for the PSH
2004 until August 2005. Figure 8 presents the energy consumption of the baseline PSH. An extensive and detailed energy audit was not possible, however the monitoring devices tracked down the energy consumption for heating, cooling and DHW. The internal loads were later calculated by subtracting the three items from the total monthly electric consumption. As expected, the cooling loads dominated the total consumption pattern, consuming 2736 kWh (55%) for one year at 26oC with a maximum hourly load of 7.2 MJ. Despite the passive design of the house the dependence on air conditioners is still essential. The yearly heating load at 21oC was 1616 MJ with a maximum hourly load of 9.2 MJ. The figure shows also that the total consumed electricity of the PSH was 4956 kWh/year before the retrofit from August 2004-05. It was found that in average the electricity consumption per month for the PSH (four persons) is about 450 kWh (27.5 kWh/m2.year) including all domestic electric devices.
4.2 Experimental Results – Active Retrofitted PSH
Before reaching the end of the first monitoring period (Aug-2004-05) all the active solar devices were installed and tested in order to start the second monitoring period (Aug-2005-06). Figure 9 shows the monthly generation of electricity for one year from PV panels. The maximum output is in July and minimum in January. The total electricity production was 5777 kWh/year. During the winter season, the solar electricity was only used to meet the internal electric loads and heating demand because the cooling was not required. Therefore, the rest of the electricity was fed into the grid. The volume of hot water produced by the thermosyphon provided 100% of the family needs (410 kWh).
Fig. 9: Second monitoring period for the RPSH 5. SIMULATION RESULTS
The PSH and RPSH were modeled including the three active retrofit systems. Results from the TRNSYS program were analyzed to produce the data shown in Figure 10. TRNSYS is an acronym for a “transient simulation program” and is a quasi-steady state simulation model. This program was developed by the University of Wisconsin by the members of the Solar Energy Laboratory [14]. The objective of the simulation was to model and compare the complete building and systems performance, compromising the thermosyphon, PV panels and SAC, which deliver energy for the PSH during the whole year. A typical meteorological year (TMY) of climate data in South Tahrir was considered for simulations.
5.1 Simulation Results – Baseline PSH
Simulation was conducted to determine the building annual energy consumption and the peak load. Several iterations took place to match as closely as possible the experimental field results for electricity consumption values. The building loads were calculated using multi-zone building model (TRNSYS Type 56a). The model house was divided into four zones and constructed according to the building description (2.1). Additionally, the Trombe wall was modeled as a thermal storage wall (Type 36c).
5.2 Simulation Results – Active Retrofitted PSH
In order to evaluate the active solar retrofit the three different solar systems were modeled. The different performances were evaluated separately as follows:
a) Thermosyphon: The simulated system consists of a solar thermosyphon collector with integral storage tank of 150 L (Type 45). Different from the experimental results (374 kWh), the 2 m2 thermosyphon modeled in TRNSYS overestimated the produced energy by 8.5% (406 kWh). This is because of the occupancy schedule that was estimated and set for the whole period between October and May, while experimental results reported the real consumed DHW during the monitoring period.
b) PV panels: The simulated system consists of a simple PV model (type 562 a). The PV system consists of a series of grid connected PV panels and an inverter. The characteristics of the PV are shown in table 2. Additional components required are a Type 9 data reader, Type 16 radiation processor, and many other subsidiary components. The simulation results predicted annual yield of 6115 kWh/year. This is 6% more than the real generated electricity (5777 kWh/year) during the second monitoring period.
Table 2: PV system characteristics used in TRNSYS
Parameter Value
Collector area (m2)
Regulator efficiency
Inverter efficiency (DC to AC) Output power capacity of inverter (W) Maximum current (for charge) (amps/cell)
26 1 0.9 830 30
c) SAC: The system simulated consists of solar collectors (TRNSYS Type 1) developed for use for domestic hot water production [15, 16]. The characteristics of this type of collector are shown in table 3. Hot water is stored in TRNSYS Type 38 tank. The tank is made of a vertical copper cylinder and is insulated with polyurethane. The coefficient of performance (COP) of this system is 0.7. Additionally there is a system boiler (type 6) with a nominal heating rate of 22 kW and a set upper temperature of 93oC (199°F). The Li-Br-water absorption air conditioner (type 7) is a single-effect unit with a nominal capacity of 4500 kWh, assuming no auxiliary heater and energy rate control. A number of runs were carried out in order to optimize the sizing process in relation to performance of the system. The final optimum values for the SAC in the case of the South Tahrir house was 15 m2 of collector area, 26oC(79°F) for the collector inclination, 86oC (186°F) boiler set temperature and 1 m3 for the storage tank.Based on the simulation results the thermal energy generated by the SAC system was converted into kWh. The SAC generated 902 kWh, enough to cool the house for the whole summer season, except for some days during July and August.
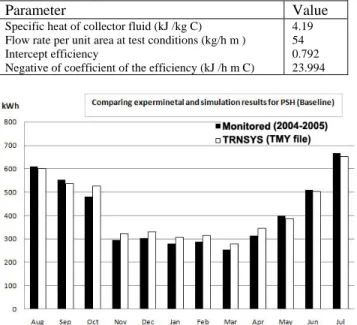
Table 3: SAC system characteristics used in TRNSYS
Parameter Value
Specific heat of collector fluid (kJ /kg C) Flow rate per unit area at test conditions (kg/h m ) Intercept efficiency
Negative of coefficient of the efficiency (kJ /h m C)
4.19 54 0.792 23.994
Fig.10: Baseline PSH, experimental vs. simulation energy consumption
Finally, modeling the house using TRNSYS suggested it would use approximately 5108 kWh per year. Figure 10 compares the consumption between actual (baseline) and predicted performance. The simulated consumption values per month were 8-9 % more from October to April and 2-3 % less for the rest of the year. On the whole, the results show that the TRNSYS follow the trend of energy use, even though a TMY file was used for the simulation.
6. DISCUSSION AND CONCLUSION
This study investigated the performance of active solar systems for an existing passive house in order to evaluate the impact and potential of low-energy retrofit. In this way, the study is deliberately forward looking, evaluating and assessing the energy potential and feasibility, providing an examination and vision for retrofits that may be implemented in the future on a large scale in Egypt. The main focus of the study was to evaluate and compare the different solar systems. The secondary purpose was to document and monitor the performance of the baseline PSH and the RPSH.
The first monitoring period allowed analyzing necessary information about the energy consumption profile, containing hourly values of cooling and heating loads as well as hot water demands and internal loads. Although the monitoring was applied for one single house only, the results can help in estimating future energy use and support the creation of a strategy for achieving energy reduction through retrofit. More importantly, the simulated retrofit achieved a net amount of energy of over zero kWh and met the electric loads. Given that, CO2-emissions were reduced to zero Kg CO2-emissions.
Between August 2005 and August 2006, the total electricity consumption was 4956 kWh, which is equivalent to 8177 Kg CO2-emissions. For the same period the solar electric PV panels delivered 5108 kWh. Installing PV panels is energetic rewarding but it should be in concert with cost feasibility [17]. Moreover, monitoring proved that using a thermosyphon for DHW is 100% rewarding. The experimental results showed that the installed system met the needs for hot water during the whole year including December and January (374 kWh).
Next, we found that the difference between the actual result and predicted ones are close. The model constructed in TRNSYS is sound and valid because it has less than 3% error. We realized that by addressing the thermal loads – including space cooling, heating and domestic water heating, with thermal energy collection we reduced the dependence on electricity by 72%. Since solar thermal collectors are considerably more efficient than solar PV collectors, installing a thermosyphon and SAC system were more efficient, based on the analysis of the simulation results. Cooling the building from an electric source
consumed 2736 kWh, which is three times more the energy consumed when the building was cooled from a thermal source (902 kWh). Obviously, there is a significant difference in the collection efficiencies of solar electric and solar thermal energy. In fact, around 72% of the total energy load in the PSH was thermal in nature, and could be met from solar thermal panels including space cooling, heating and DHW.
In short, there is a great potential for active solar retrofit in Egypt even though the average electricity consumption per capita is approximately 1200 kWh/person for the year 2007 compared to 13228 kWh/capita and 8314 kWh/capita in the USA and Belgium [18]. In general, the growing increase in electricity consumption rates for cooling requirements are extremely high and this growing consumption attitude is expected to grow exponentially based on the future projections of the Egyptian National Institute of Planning (ENIP). The study showed great potential for the retrofit not only on the level of energy generation, but also on the level of CO2-emissions reduction.
Therefore, in the near future, we should address all of the thermal loads (cooling, heating, DHW) with thermal energy collection and only the electric loads (internal loads and auxiliary components) with photovoltaic collection. The centralized solar thermal collectors might be optimized to supply the building with both DHW and cooling in order to substitute the electric based AC system. Especially, when we take into account that solar thermal cooling requires roughly one third the electric energy used for conventional air conditioning. However, despite the successful performance of the active retrofit strategies in saving energy, especially the performance of the SAC system, installing absorption chillers is still very uncommon in residential settings. The system is complicated, expensive and requires large quantities of water. In fact, switching to solar thermal air conditioning is crucial to achieve comfortable ultra low-energy residential buildings in Egypt, but as long as the prices of electricity are highly subsidized the active solar retrofit is considered as an economical challenge.
7. FUTURE RESEARCH
As the paper is a part of an ongoing research, the authors will continue drawing on market analysis and cost feasibility in detail to maximize the life cycle benefit and cost.
8. ACKNOWLEDGEMENTS
The author expresses his thanks to the research team Architecture et Climat, at the Université catholique de Louvain-La-Neuve. The author extends his gratitude for the valuable advising of Robert Vale and Michiel Ham.
9. REFERENCES
1. AUC. Why a Desert Development Center? . 2008 [cited 2008 15 December]; Available from: http://www.aucegypt.edu/ResearchatAUC/rc/ddc/Pages/defa ult.aspx.
2. Michel, S. and H. Elsayed. Examples of low energy design at urban scale in Egypt. PLEA. 2006. Switzerland, Geneva.
3. ME, Annual Report for the Egyptian Electricity Authority. 2007, Ministry of Electricity: Cairo.
4. Georgy, R. and A. Soliman, Energy Efficiency and Renewable Energy Egypt - National study. 2007, NREA: Cairo.
5. Fathy, H., W. Shearer, and A. Sultan, Natural energy and vernacular architecture 1986, Chicago: Published for the United Nations University by the University of Chicago Press. xxiii, 172 p.
6. AKTC. Passive Solar Demonstration Facility. 1987 [cited 2006 September]; Available from: http://www.archnet.org/library/sites/one-ite.jsp?site_id=849. 7. Mazria, E., The passive solar energy book : a complete guide to passive solar home, greenhouse, and building design. 1979, Emmaus, Pa.: Rodale Press. xii, 435 p.
8. ASHRAE, ASHRAE handbook. Fundamentals. 2005, American Society of Heating, Refrigerating, and Air-Conditioning Engineers: Atlanta, Ga. p. v.
9. Attia, S. and A. De Herde. Bioclimatic Architecture: Design Strategies in Egypt. in Sustainable Energy Technologies,. 2009. Aachen, Germany.
10. HBRC, Egyptian code for energy efficiency improvement in buildings, ECP306, ed. H.A.B.N.R. CENTER. 2005, Cairo: HBRC.
11. Medhat, A. and E. Khalil. Improving energy efficiency of air conditioned buildings through summer elusive climate. in 2nd International Energy Conversion Engineering Conference. 2004. Rhode Island.
12. Omran, M., Analysis of solar radiation over Egypt.
Theoretical and applied climatology, 2000. 67(3-4): p. 225-240. 13. EECA, In-situ performance monitoring guide. 2006, EECA: New Zealand.
14. Klein, S., TRNSYS 16 A Transient Simulation and Program. 1996, Solar Energy Laboratory, University of Wisconsin: Madison.
15. Duffie, J. and W. Beckman, Solar Engineering of Thermal Processes. 1991, New York: John Wiley.
16. Cincinnati, U.o. Solar Decathlon, Reform House. 2006 [cited 2007 September]; Available from: http://solar.uc.edu/solar2007/house.
17. Ham, M. The Real PV Problem is Money. in ASES. 2000. Washington.
18. IAEA. Energy and Environment Data Reference Bank. 2007 [cited 2008 29/12/2008]; Available from: