i.
EFFECT OF ORGANIC MATTER ON THE
ENGINEERING PROPERTIES OF FORT BELVOIR SANDY CLAY
by
GEORGE C. TSO
Submitted in Partial Fulfillment of the Requirements for the Degree
BACHELOR OF SCIENCE from the
MASSACHUSETTS INSTITUTE OF TECHNOLOGY 1953
Signature
Signature
redacted
of Author... .. ... .. .. .. .. .. .. . Department Civil and Sanitary Engineering.
/1 September 1, 1953.
Signature redacted
Certified by... ... *
T sis Supervisor. of
Ui
Massachusetts Institute of Technology Cambridge, Massachusetts
August 24, 1953
Mr. L. F. Hamilton
Secretary of the Faculty
Massachusetts Institute of Technology Cambridge, Massachusetts
Dear Sir:
In partial fulfillment of the requirements for the degree of Bachelor of Science in Civil Engineering, this
thesis entitled, "Effect of Organic Matter on the En-gineering Properties of Fort Belvoir Sandy Clay," is hereby submitted.
Respectfully submitted.
Signature redacted
iii
ACKNOWLEDGMENTS
The author wishes to express his sincere grati-tude to Professor T. W. Lambe for his guidance, his encouragement and advice in the research stage of this
investigation. The author also wishes to express his appreciation to Dr. R. T. Martin whose valuable sugges-tions and constructive criticisms made this thesis pos-sible.
Thanks to his colleagues in Soil Mechanics Labora-tory at the Massachusetts Institute of Technology for their kindly suggestions in the laboratory technique.
TABLE OF CONTENTS Page Title Page Letter of Transmittal ii Acknowledgment iii I. Abstract II. Introduction A. Geheral B. Purpose C. Scope D. Materials E. Assumptions
III. Testing Program 5
A. Atterberg Limit Tests 5
1. Specimen 2. Procedures
B. Compaction Tests 5
1. Specimen 2. Procedures
C. Unconfined Compression Tests 6 1. Specimen
2. Procedures
IV. Discussion of Results 8
A. Effect on Atterberg Limits 8 1. General
2. Liquid Limit 3. Plastic Limit
B. Effect on Compaction 10
1. General
2. Optimum Water Content 3. Optimum Dry Density
C. Effect on Compressive Strength 17 1. General
2. Background
3. Analysis of Results
Page
V. Conclusion 24
VI. Recommendation 25
Appendix--Data 26
1. Tests on Peat 27
2. Atterberg Limit Tests 28
3. Compaction Tests 29
4. Unconfined Compression Tests 31
I. ABSTRACT.
The thesis is a part of an investigation which aims to find out the efffect of organic matter on engineering proper-ties of soil.
In this study, Fort Belvoir sandy clay and peat were used as the principal materials. The properties of their various mixtures, such as Atterberg Limits, Compaction, and Comkressive Strength were tested.
The data, which in most cases compared to the absolute values i. e. considering the exact contributions of the constituents, show that peat has a significant influence on the liquid limit, optimum water content, maximum ulti-mate shear strength and water content at maximum strength of the clay, whereas in the case of plastic limit and opti-mum dry density, no appreciable effect is produced.
The amount of peat in the clay is very crucial at around 2%. Peak values occur at liquid limit, and ultimate shear strength when the specimen contains 2% peat.
II. INTRODUCTION
A. General:
Soils may generally be classified as inorganic and organic. The latter which contains carbonized vegetable matter or decaying animal life is generally considered to
be a poor matetial in the sense of its engineering properties. However, very few studies have been made in determing the
exact influence imposed on soil by the organic matter. Con-sidering the rapid development in the science of soil
mechanics,, such an investigation seems now justified.
B. Purpose:
The effect of organic matter on the engineering pro-* perties of soil is to be investigated. The purpose of this thesis is only a preliminary -study to be followed by a de-tailed investigation based on the results of this preliminary work. A general theory can only be developed after further
searching studies.
C. Scope:
Fort Belvoir sandy clay was taken as a basic soil and peat was used as the organic matter. Their various mixtures, having peat from 0.1% to 10%* were investigated. Properties
such as their Atterberg Limits, Compactions and Compressive Strengths were tested.
* Ratio of dry weights
2.
D. Materials:
Sandy clay is from Fort Belvoir, Virginia, and was in oven-dry state. It contains 60 percent less than 0.1/mm size material and 25% of its particles are smaller than 0.OQ.jmm.*
Its specific gravity is 2.71. Water was added to the dry soil to make specimens. The engineering characteristics of the pure clay can be found in the data of each test for the purpose of comparison. (Photo 1 shows the clay sample.)
The peat used was a common one. The raw material was dug from a depth of 4 feet on a lot behind Melrose High-school, Melrose, Massachusetts. It was partly submerged under water, as the water table of the place was about the same depth. Its color was totally black and had a decaying odor. It contained a large amount of vegetable remains and small stones. The mass was then washed through Tyler No. 10 Sheave in the laboratory to remove foreign materials. It was then sealed in a jar for use. The final material was
in a liquid state. It was tested and found to be 85% organic, and had a specific gravity of 1.61.
It has a plastic limit & Liquid limit of 261% 375% respectively (data see Appendix 1)..
* Data from T. W. Lambets 2"Cold Room Studies Third Interim Report of Investigation. 2
** 1. Percentage of organic matter was determined by the ignition of peat in a platinum crucible. After ignition, the weight of the remaining material in the crucible was found. The percent of organic matter is then equal to original weight--remaining weight/original weight.
2.. By the use of H2SO4 - K2Cr2O7 digestion the organic matter determined was 7%
3.
Photo 1. Fort Belvoir Sandy Clay in a dry state (left) Peat used in experiments. (right)
4.
E. Assumptions:
Throughout the whole experiment, the following assumptions were made:
1. The different water content of specimens at the
time of aging does not affect the test data.
2. The test results are not affected by the variations
in room temperature when the test is performed.
A.full scale. study is necessary in order to determine the accuracy of Assumption No. 1.
It is also anticipated that the "time" of aging of
specimens will also influence their characteristics.
How-ever this variable is eliminated by aging all specimens for a fixed period.
5.
III. TESTING PROGRAM
A. Atterberg Limit Tests: 1. Specimen:
Dry Fort Belvoir sandy clay was mixed thoroughly with peat which had been prepared. Six specimens- with
dif--ferent amounts of peat, 0%, .1%, 1%, 2%, 5%, and 10%, were made.
They were then sealed in a jar in a wet state and stored for two weeks before they were taken out to be tested.
2. Procedures:
Procedures used were recommended by Prof. T. W. Lambe's "Soil Testing For Engineers," Chapter III.
B. Compaction Tests: 1. Specimen:
Specimens were prepared in the same manner as in Atterberg limit tests, except that they were aged for four weeks due to conflict of schedule. It was pointed out that
as long as they had the same period of aging, the "time " variable does not enter the picture.
2. Procedures:
Procedure used was recommended by S. D. Wilson, "Comparative Investigation of a Minuture Compaction Test With Field Compaction," which was presented before the Annual Meeting, A.S.C.E., January, 1950. Mold of 1.306 in diameter, 2.816" in height was used throughout the tests. Since this method is considered quite new, the equipment is
shown in Photo 2.*
I
A. Compaction of the Specimen B. Removal of the Mold Extension Collar
6.
C. Unconfined Compression Tests: 1.. Specimen:
Specimens Wed were those which had been tested in compaction tests. Therefore, they had a diameter of 1.306 in. and a height of 2.816 in.
2. Procedures:
The procedure given by Prof. W. T. Lambe, "Soil Testing for Engineers," Chapter XII was used. Specimens of
same percentage of organic matter were so planned that a maximum value of compressive ultimate strength could be
ob-tained. The ultimate' strength was taken at point of failure, where the strain
(a)
was between 10-15% in most cases.The apparatus used is shown in Photo 3.*
T
Extrusion of Specimen from Mold B. Strength Test of Specimen in Unconfined
Compression Apparatus
Photo No. 3
B.
IV. DISCUSSION OF RESULTS
A. Effect on Atterberg Limits:
1. General:
Illustrated in Figure 1 are the liquid limit and
plastic limit of specimens which had various amounts of
organic matter. The complete data are given in Appendix 2.
The theoretical values, that is, considering the additive effect of clay and peat, calculated from the fractional contribution, and based on the amount of each present, are plotted as dotted lines.
2. Liquid Limit:
The illustration shows clearly that the presence
of organic matter raises the liquid limit of the clay. It
was observed that in a homogeneous mixture, the soil particles were infiltrated with small masses of organic matter, which
is believed to be capable of absorbing water. At the most,
the water content in peat can only reach liquid limit of the
peat when the mixture reaches its liquid limit. All this
only amounts to the theoretical value. The departure from
the theoretical value suggests that the presence of organic matter may have some effect on the cohesion force of the
clay. The addition of organic matter seems to increase the
intermolecular attraction of the soil particles. The effect
is most outstanding when the amount is around 2%. The
Imi t
#+fr Ir w
tiul I iititu Itt mi t I-It itititut
frn
i ii ii +t t - kP-f I H H 9 . If "+f fi r I -fittili u -4144 UH 7 --- --- - 77 H f i I Jutpititl t I -i I T fl itHI44-ifly"
Ifff
EM I I I I I I I I I I i I +HFff+"+++i I T T H4fl444++444lb*l I f+-M I 44 +++E 11LAKIIII, . .. .I ... ... ... .4
i ffi t f t immimimiHimiti- -f I if-+ ft 1 1 1 1 2 f + i FFM I 66 I j4- Wi 1,44 I MRIW4t-LLlllI iL I I 4 11 i i i 4 f++ T . . . ............ I I+H 1+ ff##ffffl tiii I lit' 111 141 [III - i # i . t10.
study on the influence of soil structure due to infiltration of organic matter may reveal the cause*
3. Plastic Limit:
The curve has the same trend as that of liquid limit, but to a lesser extent. The departure from the theo-retical value is not as significant (the largest is only about 3.5%). The result may be caused by the fact that peat does not have enough water to reach its own plastic limit or, in other words, theoretical value which is based on plastic limit of both constituents is too high to repre-sent the actual condition. A departure may still exist.
B. Effect on Compaction: 1. General:
The test data can be found in Appendix 3. Figure 2 shows plots of dry density versus water content of each specimen. The optimum values of which were interpreted from these curves and can be found in Appendix 3a. They will be discussed under the following headings:
2. Optimum Water Content:
For the sake of easy reference, Figure 3 shows the optimum water content of specimens having different per-centages of organic matter.
The dash line in Figure 3 represents the value which considers the water required for optimum water
11. 4 * Et t -4 I
12. TT-T iT1
Ii
I
1 9 S I13.
The plot shows that optimum water content is raised by adding organic matter. It means that more water is needed in order to get the same effectiveness of compactive effort.
As it has been pointed out, the peat is able to absorb part
of the water, and, of course, reduces the "lubricating" effect that ordinarily should be produced by the additional water. The distance between the two lines can roughly measure the water that is absorbed by peat.
3. Optimum Dry Density:
Figure 4 shows the optimum dry density of specimens having different percentages of organic matter. It was felt
that these values are insignificant unless some modifications are made about the various water contents at which optimum dry densities occur, and the volume of clay replaced by peat.
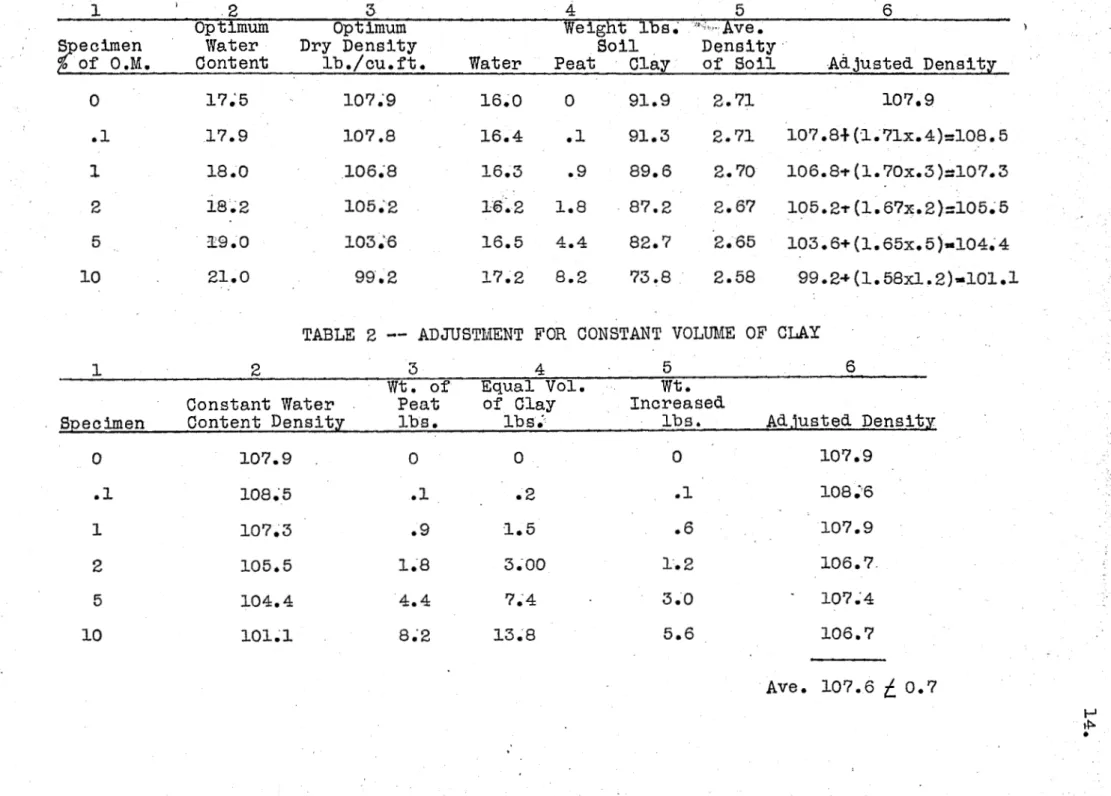
Line ab in Figure 4 represents the calculated values of optimum dry density, if the optimum water con-tents were constant and equal to that of pure clay. The method of obtaining it can be better described by the use of Table 1. Columns 1, 2, and 3 are self-explanatory.
Using the water content, and the percentage of organic matter, the weights of the three constituents were computed in
Column 4. Column 5 is the average specific gravity of the soil-peat and clay.
Adjusted densityiwas obtained by adding to the original desnity the increased weight that resulted from
replacing water by soil. ttab" is the best line drawn through the values.
TABLE 1 -- ADJUSTMENT FOR CONSTANT WATER CONTENT
2 4 5 6
Optimum Optimum Weight lbs Ave.
Specimen Water Dry Density Soil Density A
%
of O.M. Content lb./cu.ft. Water Peat Clay of Soil Adjusted Densit0 91.9 .1 91.3 .9 89.6 1.8 17.5 17.9 18.*0 18 0 2 19. 0 21.0 16.0 16.4 16.3 l16 *2 2.71 107.9 2.71 107.8+(-1.71x'4)=108.5 2.70 106.8-P (1.70x.3)=107.3 2.67 105.2-r (I.67x.2)=105 5 2.65 103.6+(1.65x.5)s*104.4 2.58 99.2+ (1.58x1.2)mlOl.l
TABLE 2 -- ADJUSTMENT FOR CONSTANT VOLUME OF CLAY
1 2 Soecimen Constant Water Content Density 3 Wt. of Peat lbs. 4 Equal Vol. of Clay lbs 0' 5 Wt. Increased lbs. 6 Ad justed Density 107.9 108 6 107.9 106.7 -107.4 106.7 Ave. 107.6 / 0.7 0 .1 107.9 107.8 106.8 105.2 103.'6 2 5 10 87.2 82.7 73.8 16.5 4.4 17.2 8.2 99.2 0 .1 2 5 107.9 108.5 107.3 105.5 104.4 101.1 0 .1 .9 1.8 4.4 8.2 0 .2 1.5 3.00 7.4 13.8 0 .1 .6 1.2 3.0 5.6 P
4
.A~~~
IT
ft
A4 ~hzL
11 ri- F H 1 i rH 14+-44
IM11111 III fITERTFF-11,111 MF 7747+1W717
TTT $me.g.
q
E
f9
, f+4 u I +hrtm+H-rH I 016.
Line ac in Figure 4 represents the optimum dry density if,, in addition to the correction made for water
content, the volume of peat in the specimen were repla'ced by clay. The method of obtaining the values is self-explanatory in Table 2. Line ac is the line best drawn through the
points.
It is seen that ac is nearly a horizontal line. (Error of 1%) Considering the inconsistency of the experi-mental method, such as hamriner force, inconsistent thickness
of layers, the error is negligible.
This means that the difference of optimum dry density is only caused by different water content, and the
17.
C. Effect on Compressive Strength: 1. General:
The complete data of the tests are given in Ap-pendix 4* The results are plotted in Fig. 5 as ultimate
shear stress versus water content for each specimen having different amounts of Organic matter. The maximum ultimate shear stress and the water content at which the maximum strength occurs, are interpreted from the curves. Fig. 6
shows the values plotted against the organic matter
con-tent of the specimens (data see Appendix 4a) 2. Background:
Since the exact nature of the strength theory of soil is not known, it is better to mention the assumptions that will be used when analyzing the results.
It is generally assumed that shearing resistance within soil masses is commonly attributed to the existence of "internal friction" and "cohesion." Internal friction
is to include the resistance to sliding of the soil particles over one another and any interlocking that may have to be overcome before a slip can occur. Cohesion is supposed to
include both true cohesion, that due to intermolecular at-traction, and apparent cohesion, that due to surface tension effects in the water contained in the clay mass.1
3. Analysis of Results:
In Fig. 6 the maximum ultimate strength has a peak value for a specimen having about 2% organic matter. The occurrence of the peak may be explained in the following
tZ, r-~1 N
k
(j\~ I i 4 +FT
[V
*021 -iia.. -manage. 4NNN: a. -40800::: ... . ... ... 3M Mommoose ... ... 0 ... ... ... ... ... ... ... ... ... ... ... ... ... Mean ... ... so" a- ... ... Brown am 8 ... SOOM MM UNUM M.- ... ... a.. ... ... ... !"."Hamodwo.ems ... ... ... ... ... amemanow ... so ma;: : :::me: Ns:! V*: M:M sound 0.0 ... 8.08-88.0.8 ... a .20000. ... $:*!a HHHOUNUNNUM.: ... seems ... see .0.0 ... s. nowma.m... NESNUNNUM numans a-UNHUHN HWUHHHHUM WHUNNOUNUU...- ... season. unimunumun ... unuummomemmmeme'a means mongoosHUHN 01@10aemon NUOUSHHHHHH: NOMMUMMUN MUNNO ::: :11JUMM"". :.:.a.. "'INHUNNNUM: N.O..n ... . NUNN= ::::a* NINHUNIONN NNUHN *a a a ... ion filM... .. ... .8.040m ... ... m- on... all MHUHHHUM: ... a ... -*...- seems afiniiiiiiiiiii: @Season ... *OMUNW ANNN a semen% was .am . . . ... ... ... Nn ... 0 ... ... 6. ... Samoa ... -.. ; ... a.:::: 111991 Iffil Hill Mil His SH4. ONHOW !Umo. 1:280: UNPI. SH ... H1 !III: :1111:upp1. 1 IS 1181111EIIIIiIII: memo. MMUNUMMUNN: Monsoons ... I ME: ... ... .. ::: ... ... smoommUspWou: ""1111111HUH unuilillip flus snow --- man NO.U.M.N.: m"": ..-mass 11131 13 1 :1 111 .. . .. .. .. .. . .1: uu: ull: luc p% a 4. !!!Iuuu'.-:m-.J::V': ... .. 049:01mmoome:40main ... O.M.9 HISSUCHUINu: .... ... 0000.40" ... ... ... .Mluo ... HHHH!"Ill"Humn. O'Hunimi:iumunnur Allss ... AN HNI HOW P.M. H N N ... .... :3 1UH ONE 68.00080 H11111 INIH!": In su...moo.w: ... a ...mirdiii
Igo
a
1"
museum
a
mossommoseemes
me
a
mosv-.Ammom
assume
...
a
...
NUAN
;00111a.mmump.mams
BID
Mil
U118--i
11:11
lu,
flunflianxi:
...
6811HUHHUNUM
4 ....
...
...
as
a
04090
0M
UUHl
...
0
...
...
Bin
1!!Il I'lunn' 01:6 1.6=1 UH: :::a.! ON; ... wasseaso-NMNUMUM.... silos a ... season. a ... a H! HIM 1111IH: JiSififfiffi""S me Nil our 21 :111111HURD HHHHHH. ! ... some ... to MR 1111 oil P0511 oil RUN :::I'm um Him? F .0.108NUGGO WUN .01 .... Aose:081-:80"Unuummu.:a M aMUN owns.& ... a ... so. Mal pin anj ing wil uIn jan all'! salum. 1!!!! lnuuu: -%m ;","UNC: -UHHH: still 1.21HENSUM.N. MHHUM .11HUMUMOU. gulfulf:rmiumuzon: ... 0 ... -WOMMUM, Mmommmemuns: .606,768mamom M UCH 11 AM :::::: ::: :: -: -:: -- -:: --a tr-92 ill FUS ma"aue "meal 13161 113121HUS Bill Bug 11126 00000 00090 UMN :0000 001*0 mass, *:::a .. a a a am,.. m. -. .. M um I 1111flu"I"IMUNI ... mHOOMMUNnun ... :::: ... a was ... HOUNUMMUNN ... -itivioses Ifashion. The fact that peat has a very low shearing strength suggests that smal-1 chunks of it fail before the whole speci-o men does. This failure will cause a sudden drop within the
specimen. The sudden displacement may reduce the cohesion force greatly by damaging the intermolecular attraction of the soil. The damaging Is not appreciable compared to the specimen's frictional force, where the amount of peat does not exceed 2%. Beyond this amount, the reducing of the
cohesion force comes into effect. The curve of water con" tent at maximum strength in Fig. 6 shows a correspondente but reverse shape which gives further proof that the
varia-tion of the strength is of a cohesive nature* 4. Tiqle Difference in Strength:
Because of the various water contents at *hich the maximum ultimate strengths -of each specimen occur, it was suggested that a plot be drawn showing the comparison of maximum ultimate strength of specimens to the strength of the pure clay at the same water content. Such a plot is shown in Fig. 7. The distance between the two curves in Fig. 7 is the true difference in strength that is pro-duced by the addition of organic matter. It is interpreted and plotted in Fig. 8. The curve has a similar shape to the maximum ultimate shear strength in Fig. 6. The slight deviations in shear strength in 5-10% organic matter range shown in Fig. 6 and 8 are within experimental errors. Far
*Cohesion is generally great when the water content of a soil is low and much lower when the soil is in a saturated con-dition.3
0 C\j :; 7: 777 I F I
21
more data are needed to justify an explanation. The theory that the sudden failure of peat, reducing the molecular attraction and causing a peak value at 2% o.m.
22. ... s~...e...e. .. .H...e s ...-... ~~~~~~~ ... .-. ... .... 6 ... se.. . -..- .. ... 09a. a ... ... ... U .... ... .I:.. ... .. -... ,... ... i.... ... nu. . U.H .N.a .... .-..-... sese... i u m u : ... .... :..:: '..e... ses NO.UM ti8 U 19 ... ... ... 0... .... ... 2 ..0 .H.... m... .i .ai.i ..me' .We .. T ... ... ... !.. ... ..-. ..:. I ... 2. .. 2.. ... !..!... ... 2....3 ..gg~g*~ UNI !fal M:.. .... ... ... ... anes -*...f... sw... s... . a. a ... ... , ... ... ....-... .. ... 338 . .. e-.. -... ... n... ... N.. .... M . ... ... ... 8 ... . 10.8 ... ... ... .. ... .. ... ... .. MU.SUM...t" ... ,... ... 8... ... .... ~ " . . . .. . . ... .. . . . ...-... . . . . . .. . .. . . . . . . . . . . .. . . . .. 5 . . ... ... ... ... ... ... .. ilp ... ... ... . .. 0. ... ... 9.. .. s....e.... O.. .W...s...e... . ... e.ac...-..=...0...m um...e... ... . ... :... ... i...""if f""ill"'' ... =...0...@...=...-=0.@...0...0..@... ... ... ... ... ... . ... 3 ...-... ... ... ...-. ... ... 19M M M... ... ... 8 5... ... .23. . -.. ... ,.. NN.U.M... .. ... ... .. ... .. .-....---...-... , ... . MU. HMSH. . :.:, SMU.. 2t ...-... luH .. .. .. .. .. .. .. . .. .. .. .. .. .. .. . -.... U M ... .. . . . ... . . .. . . .. . . .. . . .. . . .. . . .. . . I88 . ... e- e. =. @ee e. .. .= .. .e~e~~e~e.. .e .. s. .. .. .. .. ... .... .. .... ... e. .. ... 1 .. m u. ... ... ... .' i... .. . . .. . . . .. . . . .. . . .. . . . .. . . . ... U . . . . .. . . . .. . . .. . . . .. . . . .. . . .. . . .i.f.t.. . . . ... ... 3 ... ... ... ..- e ., . a- .. ... ... ... 3... ... ... s... ... . ... ,3 ... ... .. ... . . ... .. ... ... .:.... ...
g...-...
... ... '.a... ... ... ...-... :::...1.1.0... ... ... M..,...s... i mu n m n... ... .... ... ... ...-... ... ... .. ... . .. .. . . . . . . . . . . O. . . . . . . . . . . . . . . . . . . . . . . . . . . . . . . . . . . . . . . . . . . . . . . . . . . . . . . . . ... ... ... 0...=...0@....0... ... ... ... e...e..e....e... ... ... ... ... ... ... ... ... .... .... .e... s... ... ..@.8@...@... ... ... e. a... ... e. ... e.~ un .. ... . .. . .. .= .. . .0 . 0 ..* ...0 .. = = ...= .0 ...= .. N.. . U. ... o. = = . .." ...m0 =o. ..= = ... ... ... .e ee . .. . . . ... .e~. .e~ .e .e e. ... . ... ..0 ... ... .. ... . ... ... ... .... ... .. .. =. ... ..0 = @. =. .. e .v -a ee.a .,- -e w , .. e e .. ..g ... ,. ..,ea e ... ... ... ... ... =...=...0..s.. e.. ..0 .. s .... ... e.e.-e...ee. 0..0.e.ee. ~~e..eee.~ ... ~...23. -t fT 44 H t+ 4 ttt t tt I T 1 4t 4 t i ma t -a + 4 +1+ 7 t-- i t i t 11 Y= I-- -a II rr I~ TT # 4 -... fi it ... +~~ .. ++--~ 41 ttt r a1 4+ q 0 -H4uit: 4 4 t 14u i Iu it I 1 +o + + + til
24.
V. CONCLUSION
Generalization at such an early stage of work is dangerous, but one is tempted to make a tentative step.
It would seem that under the conditions imposed by the experiments, the following conclusions can be made.
1. Liquid limit increases as percentage of organic matter increases. The experimentally observed
increase was 2 - 3 times that which would be predicted from mixtures of Fort Belvoir sandy clay and peat.
2. Plastic limit increases as amount of organic matter increases. This increase is proportional to the
increase in limit expected from mixtures of Fort Belvoir sandy clay and peat.
3. In compaction, the optimum water content increases as organic matter increases. Difference in optimum dry density is caused only by difference in water
content and lower specific gravity of organic matter.
4. The ultimate shear stress is raised as percen-tage of organic matter increases. There is a peak value
(45% above the stress of pure clay) at the 1-2% organic matter range.
5. The test results strongly suggest that (a) The presence of organic matter tends to increase the
mole-cular attraction of the clay. The amount depends largely on the percentage of organic matter present. (b) The organic matter is capable of absorbing part of the water that is
25.
VI. RECOMMENDATION
Although the result of this experiment can only be taken as preliminary, yet it does show that influence brought by organic matter on the engineering properties
of soil in some cases is desirable while in other cases it is not, and that further study of the problem will be rewarding. The author wishes to suggest some possible in-vestigations that can be made in a future study.
1. Properties such as consolidation and permea" bility can further be investigated for this particular mixture.
2. The influence on the properties by different water content at time of aging should be investigated.
3. The effect of. time of aging on the engineering properties of the specimen may be of interest.
4. Other mixtures should be studied in order to develop a general theory.
26.
APPENDIX TEST DATA
27. 1. TESTS ON PEAT Specific Gravity* 1.61 Plastic Limiti Determination 1st 2nd 271 252 Wp Ave.f% 261 Liquid Limit No. of Blows 30 28 14 Water Content 360 375 406
*Procedure recommended by W. T. Lambe ."Soil Testing for
Engineer."
374 W'j
28.
2. ATTERBERG LIMIT TEST
Plastic Limits Organic Matter 0 .1 1 2 5 10 Water 23.4 24.2 24.8 24.5 27.4 30.1 Content 24.6 29.1 Liquid Limits Organic Matter 0 .1 2 5 10 No. of Blows 16 30 44 23 25 40. 20 23 47 19 32 45 22 24 42 11 27 50 Water Content 36.4 34.8 3207 3704 -35*6 32.7 42.8 44.2 3904 3806 39.8 37.0 43.8 41.0 39.4 59.0 54.0 4508 WpAve. 24.0 24.2 24.8 24.5 27.4 29.5 Liquid Limit 3501 35.6 42.6 3902 42 53.3
29.
3. COMPACTION TEST
Relationships of water content to dry density for various percentages of organic matter.
0% of Organic Matter W d lbs/cu.ft. 11 91.0 13 97.1 15*3 101.0 17.4 108.0 19.0 106.0 21.5 101.0 1% of Organic Matter d lbs/cu.ft. 14.4 99.3 17.0 106.0 19.8 105.3 22.9 99.9 26.1 95.6 5% of Organic Matter d lbs/cu.ft. 14.9 17.2 18.0 21.6 23.5 89.6 93.3 101.5 100.0 97*7 .1% of Organic Matter % , d lbs/cu.ft. 11.8 13.8 14.6 19.4 21.1 94.8 100.3 102.3 107.0 103.5 2% of Organic Matter W_ .d lbs/cuoft. 13.3 93.6 13.9 96.0 16 7 104.5 18.8 105.0 21.6 102.5 10% of Organic Matter ]y d lbs/cu.ft. 18 18.9 20.8 21*0 23.8 28.4 85.9 94.5 97.1 99.0 98*1 90.0
30.
3a. RESULTS FROM COMPACTION TESTS*
Optimum Dry Density Vs. Percentages of O.M. Contained.
of Organic Matter Optimum Dry Density
lbs./cu.ft. 0 .1 2 5 10 10709 107.8 106.8 .(10502) 103.6 99.2
Optimum Water Content Vs. Percentages of 0.M. Contained.
of Organic Matter Optimum Water Content
0 .1 2 5 10 17.5 1709 18.0 (18.2) 19.0 2100
31.
4. UNCONFINED COMPRESSION TEST*
Relationships of shear for various amounts of
O% of Organic Matter WX % 11. 9 14.6 16.0 19.0 2105 23.0 .-L lbs./sq.in. A 12.4 2108' 20.2 12.7 9.6 5.1 stress peak P#. organic matter. to water content -1% of Organic Matter W% 2 lbs./sq.in. 14.4 17.0 1908 22.9 26.1 22.7 30*8 16.3 9.6 5.2 0.1% of Organic Matter W % P lbs./sq.in.
2A
8 5 15.5 18.7 19.1 9.8 21.6' 20.0 14.7 5% of Organic Matter W% P lbs./sq.in. __2A 1409 17.2 18.0 21.6 23.5 16.4 2005 23.0 1902 6.3 2% of Organic Matter W% P lbs./sq.in. 2A. 8.35 1008 16.4 18.8 21.6 2308 31.3 19.9 20.4 9.4 10% of Organic Matter W P lbs/sq.in. 18 18.9 20.8 23.8 2804 1209 21.6 25.1 13.8 6.3#
P = Compressive forceo A = Average cross-sectional area of the specimen x W = Water content
32.
4a. RESULTS FROM UNCONFINED COMPRESSION TEST*
-Maximum Ultimate Shear Stress Vs. Amount of O.M. Contained
Organic Matter Maximum Shear Stress
.
in lbs./sq. in. 2A 0 .1 2 5 10 21.7 22.4 30.p8 31,5 25.9 25.5Water Content at Ultimate Shear Stress Vs. Amount.of 0.M. Contained.
Organic Matter Water Content
0 .1 2 5 10 *See Fig. 8 14.6 14.3 16.7 11.4 19.2 20.2
33.
BIBLIOGRAPHY
1. Ritter and Paquette, "Highway Engineering," New York, The Ronald Press Co., page 173.
2. T. W. Lambe, "Frost Investigations," Fiscal year 1952 and 1953, Arctic Construction and Frost Effects Lab., New England Division.
3. Ibid.