The Effect of Market Transparency on
Corporate Disclosure
By
Georg Rickmann MSc. Finance
Warwick Business School, 2013
BSc. Business Administration University of Gottingen, 2012
SUBMITTED TO THE SLOAN SCHOOL OF MANAGEMENT IN PARTIAL FULFILLMENT OF THE REQUIREMENTS FOR THE DEGREE OF
MASTER OF SCIENCE IN MANAGEMENT RESEARCH
at the
MASSACHUSETTS INSTITUTE OF TECHNOLOGY FEBRUARY 2020
©2020 Massachusetts Institute of Technology. All rights reserved.
Signature of Author:
Signature redacted
Signature redacted
Certified by:WDepartment of Management January 16, 2020
Eric So Sarofim Family Career Development Professor
Signature redacted
Thesis SupervisorAccepted by: MASSACUSTSL INSTITUTE OF TECHNOLOGY
MAR
1120201
LIBRARIES
Catherine Tucker Sloan Distinguished Professor of Management Professor, Marketing Faculty Chair, MIT Sloan PhD Program ::The Effect of Market Transparency on Corporate Disclosure
byGeorg A. Rickmann
Submitted to the Sloan School of Management on January 16, 2020, in Partial Fulfillment of the Requirements for the Degree of Master of Science in Management.
Abstract:
I study how increased market transparency affects firms' disclosure incentives. I exploit the staggered introduction of TRACE, which made bond prices and transactions publicly observable, and show firms provide more guidance when their bonds' prices and trading become observable. This effect is stronger for firms with informationally sensitive bonds and firms without exchange-listed bonds prior to TRACE. Also, firms become particularly more likely to disclose bad news, consistent with the notion that investors' access to market information limits managers' incentives to withhold information. I corroborate my results using a small controlled experiment, in which prices and trading are revealed for a randomized set of bonds. Taken together, my results suggest that observable market outcomes inform investors not only directly by aggregating and revealing investors' information and beliefs, but also indirectly by increasing corporate disclosure.
Thesis Supervisor: Eric So
1 Introduction
I study how increased market transparency affects firms' incentives to disclose information.
My study is motivated by the idea that investors reveal their private information through trading (e.g., Kyle, 1985; Glosten and Milgrom, 1985). In transparent markets, in which trading and the
resulting market prices are observable, the public can learn from market outcomes about firm value,
risk, and the probability of underlying value-relevant events (e.g., not-yet-announced M&A
decisions or changes in firms' investment strategies). Investors ultimately share more private
information with each other and are more informed when markets are transparent, which changes
how they interpret and react to managers' disclosure decisions. How managers, in turn, alter their
disclosure behavior in transparent markets is the focus of this paper.
Economic theory suggests that access to information alters market participants' interpretation
of both disclosures and non-disclosures, and therefore plays a key role in managers' disclosure
decisions (Verrecchia, 2001; Dye, 2001; Beyer, Cohen, Lys and Walther, 2010). Increased access
to market information can lead to increased disclosure for at least three reasons. First, observable
trading and returns help investors assess whether a material event occurred, which spurs increased
demand for managers to disclose their material information.1 Second, observable price and
transaction data are central inputs to litigation. They help investors assess investment losses,
attribute these losses to particular revelations, and coordinate class action lawsuits.2 Thus, the costs
of withholding or delaying information are likely higher in transparent markets, resulting in greater
disclosure of material information (Skinner, 1994, 1997). Finally, to the extent that third parties
' This argument is a natural extension of models such as Dye (1985) or Jung and Kwon (1988), in which uncertainty about whether managers have material information prevents full disclosure.
2 Also, observable market data help plaintiffs demonstrate that the firm's bond market is sufficiently efficient to apply
the fraud-on-the-market principle. The fraud-on-the market principle lifts the requirement that plaintiffs demonstrate direct reliance on a particular disclosure or non-disclosure (because investors indirectly relied on it through prices).
(e.g., competitors or policymakers) extract proprietary information from market outcomes, the
proprietary information costs of disclosure likely decrease when markets are transparent, resulting
in increased incentives to disclose (e.g., Verrecchia, 1983).
There are also reasons why increased market transparency may reduce managers' incentives
to disclose information. For example, market data reduce information asymmetries about firm value,
which can reduce investors' demand for disclosure and the equilibrium disclosure level (e.g.,
Verrecchia, 1990; Diamond and Verrecchia, 1991).3 Ultimately, the net effect of these channels is
an empirical question, which I explore in this paper.
A major challenge when testing predictions about the effect of market transparency on disclosure is finding a setting that elicits exogenous variation in market transparency. I overcome
this challenge by studying the introduction of the Trade Reporting and Compliance Engine
(TRACE), which generates plausibly exogenous variation in bond market transparency. In essence,
TRACE makes previously unobservable trading and the resulting prices observable to market
participants. Corporate bonds are generally traded over the counter (OTC), and prior to TRACE,
transaction information such as realized prices and volumes was largely private information
exclusive to the transacting parties. TRACE fundamentally changed this exclusivity by requiring
dealers to report transactions (e.g., price, trade size, and timing), which are then disseminated to the
public. Since TRACE's full implementation, investors have almost-real-time access to more than
99% of the total activity in US corporate bonds (FINRA, 2007).
In addition to generating large-sample variation in the observability of prices and trading, the
introduction of TRACE offers two main empirical advantages. First, TRACE dissemination was
3 The expression "demand for disclosure" can be confusing because there is no market for disclosure, in which disclosure
is sold for money and the price sets demand equal to supply. In many accounting theories, equilibrium is achieved in the security market, and "demand," or "pressure," for disclosure formalizes as a price discount investors rationally
introduced in four main phases (in 2002, 2003, 2004, and 2005). This staggering allows me to
compare firms whose bonds become observable with control firms whose bond observability does
not change. Also, I can restrict this comparison to public firms with public debt, reducing selection
concerns stemming from differential reporting requirements or the endogenous decisions to issue
bonds or to become/stay public. Second, the National Association of Securities Dealers (NASD)
conducted a small randomized controlled experiment, in which prices and trading of 120 randomly
selected bonds were revealed through TRACE. I use this experiment to corroborate my large-sample
inferences. I describe the TRACE introduction in more detail in Section 2.
Using the introduction of TRACE as an empirical setting, I test three predictions. First, I test
whether and how much TRACE alters managers' disclosure. Second, I test whether TRACE has a
larger effect in situations in which the bond market outcomes contain more incremental information.
Finally, I test the prediction that, to the extent managers prefer to withhold bad news, TRACE has
a larger effect on bad news disclosures by reducing managers' incentives to withhold information.
In my main analysis, I study firms' voluntary disclosure mainly in terms of their use of
guidance forecasts. Guidance forecasts reflect firms' projections of key financial statement
parameters - including earnings, sales, and capital expenditures - and are an important source of
information for investors.4 My sample consists of 13,206 firm-quarters between July 2001 (one year
before the first phase introduction) and February 2006 (one year after the last phase introduction). I
define a firm-quarter as having an observable bond (i.e., as being "treated") if the firm has a bond
that has started dissemination through TRACE.
My main finding is that firms increase their disclosure in response to increased market transparency. Using difference-in-differences regressions that exploit the staggered nature of the
4 For example, Beyer et al. (2010) estimate that management forecasts provide more than half of firms'
TRACE introduction, I estimate that firms provide 0.30 more forecasts per quarter when their debt
trading/prices become observable, which corresponds to a 19% increase relative to the unconditional
mean of the quarterly forecast frequency. This increase in the disclosure frequency is attributable to
firms forecasting (i) more topics (e.g., CapEx in addition to earnings), (ii) more horizons (e.g.,
multiple fiscal years), and (iii) on more dates. Moreover, the increased disclosure is not limited to
management forecasts: using the disclosure quality measure by Chen, Miao and Shevlin (2015), I
find firms significantly improve the quality of their financial statements following the introduction
of TRACE. Overall, these results are consistent with theory predicting that improved access to
market information limits managers' incentives to withhold information.
To sharpen my inferences, I study the timing of the disclosure effect. I find that disclosure
remains flat before the TRACE introduction, jumps immediately as prices and trading become
observable, and remains high thereafter. Because a firm's market transparency increases
discontinuously around its phase introduction date, this pattern suggests that the increase in
disclosure is attributable to TRACE rather than to confounding effects.
My second prediction is that TRACE has a larger effect on disclosure when the revealed price and trading data likely contain more information. I find TRACE has a substantially smaller effect
on firms with exchange-listed bonds, which is intuitive because investors could observe price quotes
prior to TRACE. I also find TRACE has a larger effect on firms with high credit risk, which is also
intuitive because the informational sensitivity of debt increases with the firm's credit risk (Merton,
1974). These results are consistent with the idea that the increased disclosure is driven by the
revealed information content of prices and trading.
My third prediction is that the increased disclosure more likely reflects bad news because TRACE reduces managers' incentives to withhold news. Consistent with this prediction, I find a
significant increase in the forecast frequency of bad, but not good, news, where I use the
announcement return to classify the content of announcements.
A potential disadvantage of the TRACE introduction is that firms were not randomized into treatment groups. Instead, assignment to a TRACE phase was based on bonds' ratings and issue
sizes, with earlier phases tending to contain larger and better-rated bonds (see Section 2 for a detailed
description). Firms in different treatment groups thus differ in their associated characteristics, most
notably their (public) debt amounts and creditworthiness, which raises the concern that disclosures
from the treated and control firms might change differently around the TRACE introduction dates
due to confounding factors rather than the TRACE introduction itself.
To address these concerns about confounding effects, I corroborate my results using a small
randomized controlled experiment in which NASD randomly chose 120 BBB-rated bonds and
started to make their transactions available through TRACE. Using the experiment, I find
corroborating evidence that firms increase their management forecast frequency in response to their
debt prices/trading becoming observable, again particularly for bad news disclosure.
I also exploit that the threshold rules used to assign bonds' treatment sometimes lead to discrepancies in the treatment of otherwise-similar firms. For example, a firm receives treatment in
Phase 1 if it has one investment-grade bond with an issue size of $1.2 billion, but not if it has two
investment-grade bonds with issue sizes of $600 million each. This discrepancy in the treatment
group assignment allows me to hold constant the total issue size of a firm's investment grade bonds,
which is the firm-level equivalent of the variable used to assign bonds' treatment. I exploit similar
cutoff rules for Phases 2 and 3A. Holding explicitly constant the total issue-size-rating combination
used to assign treatment to bonds, I corroborate the result that market transparency increases
disclosure. The treatment effect estimates from this threshold-based analysis, the experiment, and
Finally, I examine potential channels through which TRACE spurred firms' disclosure. I find
preliminary evidence for three non-exclusive informational channels: observable market data
plausibly increase disclosure by (i) increasing the litigation costs associated with withholding
information, (ii) reducing the proprietary costs associated with disclosure, and (iii) reducing
uncertainty about whether managers have information about material events. I also test and find
evidence against the alternative that disclosure increases because TRACE increases firms' bond
issuance and related public disclosure.
My article makes two main contributions. First, my study extends the literature on managers' disclosure incentives by studying how withholding incentives are mitigated by investors' access to
alternative information sources. My results suggest that when investors can learn from prices and
trading, managers disclose more, and the additional disclosure tends to contain bad news. This
finding is consistent with managers withholding less information as investors get access to
alternative information.
Broadly speaking, my study is unique in that my research setting allows me to isolate the effect
of the observability of prices and transactions, and the variation in this observability is plausibly
exogenous, which allows me to make causal statements about the direction and strength of the
studied effects. Taken together, my study extends the emerging literature on how external market
forces shape managers' disclosure incentives (e.g., Sletten, 2012; Balakrishnan, Billings, Kelly and
Ljungqvist, 2014; Hu, 2017; Kim, Shroff, Vyas and Wittenberg-Moerman, 2018).5
Second, my results highlight externalities of market transparency and have practical
implications for regulators concerned with the transparency of financial markets. Research on the
consequences of mandated market transparency is important, in part because of increased regulatory
efforts with regard to market transparency.6 My results suggest that increased market transparency
creates externalities for investors by increasing firms' voluntary disclosure, thereby ultimately
improving investors' access to corporate information. Observable market outcomes inform investors
not only directly by aggregating and revealing investors' information and beliefs, but also indirectly
by increasing corporate disclosure.
The remainder of the paper is structured as follows. Section 2 describes the introduction of
TRACE. Section 3 discusses the informativeness of bond prices/trading and develops my formal
hypotheses. Section 4 describes my sample. Sections 5 through 9 present my empirical results.
Section 10 concludes.
2 Description of the TRACE Introduction
The Transaction Reporting and Compliance Engine (TRACE) was introduced between 2002
and 2005 to increase price transparency in the corporate debt market (FINRA, 2018). Before
TRACE's introduction, corporate bond markets were opaque with low levels of pre- and post-trade
transparency. Corporate bonds are traded primarily over the counter, and prior to TRACE,
transaction parties were not required to make their trading or the realized market prices public.
Realized market outcomes were generally private information of the transaction parties and not
broadly shared. Pre-trade quotations were available only to market professionals, most often by
telephone (Bessembinder and Maxwell, 2008). In addition, institutions could consult a vendor
providing estimated prices (so-called "matrix prices") (Asquith, Covert and Pathak, 2013). To quote
Arthur Levitt, then Chairman of the SEC, "the sad truth is that investors in the corporate bond
6 The increased regulatory efforts are reflected in recent successfully implemented regulations that follow TRACE's
example, such as the introduction of real-time public reporting for all swap transactions (e.g., credit default swaps and industry swaps) in 2012 and the introduction of MiFID II/R in Europe in 2018.
market do not enjoy the same access to information as a car buyer or a homebuyer or, dare I say, a
fruit buyer."7
The introduction of TRACE substantially increased transparency in the corporate bond
market. For each transaction in TRACE-eligible securities, dealers are required to report to TRACE
the bond identifier, date and time of the transaction, the trade size, trade price and yield, and whether
the dealer bought or sold the bond.8'9 TRACE then releases to the public the price and yield, the
trade size, and the date and time of execution.10 After full implementation, investors could access
information on 100% of OTC activity, which represents more than 99% of the total activity in US
corporate bonds (FINRA, 2007). Investors could access the data free of charge on the NASD website
or through third-party vendors, such as Bloomberg, Reuters, or MarketAxess. According to a Wall
Street Journal Article, TRACE was seen as "a major step forward in the evolution of the corporate
bond market, along the lines of the stock-market tickers in the early 20th century." "
The timeline for the introduction of TRACE starts in 1998, when the SEC reviewed the
transparency of US debt markets. After this review, the SEC asked NASD, a predecessor
organization to the Financial Industry Regulatory Authority (FINRA), to take three steps to address
the lack of bond market transparency: (i) adopt rules requiring dealers to report their transactions
and develop systems that receive and distribute the transaction prices on an immediate basis; (ii)
create a database of transactions in corporate bonds, which would enable regulators to proactively
supervise the corporate debt market; and (iii) in conjunction with the development of a database,
'His speech can be found at https://www.sec.gov/news/speech/speecharchive/I998/spch218.htm.
8A "TRACE-eligible security" is a debt security that is US-dollar denominated and is issued by a US or foreign private issuer, and registered under the Securities Act; or issued pursuant to Section 4(2) of the Securities Act and purchased or sold pursuant to Securities Act Rule 144A. See FINRA Rule 6710 for a more information.
9 Dealers are required to report their trades to FINRA in a timely fashion. Starting from 2002, dealers were required to report their trades to TRACE within 75 minutes. This window was reduced to 45 minutes (on October 1, 2003), 30 minutes (October 1, 2004), 15 minutes (July 1, 2005), and finally to immediate reporting (January 9, 2006).
1 The disseminated trade size is capped at $5 million for investment-grade bonds and at $1 million for junk bonds.
" In Major Shift, NASD Expands Corporate Bond-Price Reports.
create a surveillance program to better detect fraud in order to foster investor confidence and the
fairness of these markets. In January 2001, the SEC approved the TRACE rules, and in July 2002,
NASD formally introduced TRACE.
Starting from July 1, 2002, dealers had to report their transactions to TRACE; however, the
dissemination (i.e., observability) of this information to the public was introduced in four main
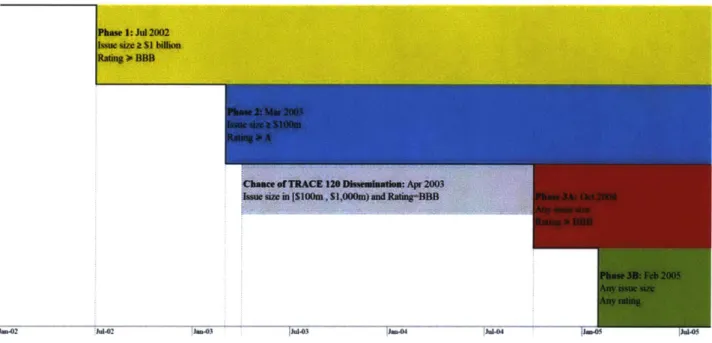
"phases." (in 2002, 2003, 2004, and 2005). Figure 1 and Table 1 summarize the phases' introduction dates and the requirements for bonds to be included in a phase. Phase 1 started on July 1, 2002, and
included investment-grade bonds with an initial issue size of at least $1 billion.12
Phase 2 began on March 3, 2003, expanding dissemination to the next-largest bonds (initial
issue size > $100 million) with a rating of at least A. In addition, NASD conducted a randomized
controlled experiment, selecting 120 BBB bonds with issue sizes between $10 million and $1 billion
and started to disseminate these bonds' information on April 14, 2003, as part of Phase 2. In Section
6, I describe this experiment in more detail and use it to corroborate the inferences from my main tests.
Phase 3 expanded TRACE to cover almost all bonds and was introduced in two parts. Phase
3A was introduced on October 1, 2004, and expanded the TRACE system to bonds that are "not eligible for delayed dissemination." Phase 3B was introduced on February 7, 2005, for bonds that
are "eligible for delayed dissemination." Practically speaking, bonds eligible for "delayed
dissemination" are junk bonds.13 I refer the readers to Asquith et al. (2013) and Bessembinder and
Maxwell (2008) for excellent, more extensive descriptions of the TRACE introduction.
12 In addition to the Phase 1 bonds, 50 non-investment-grade bonds that previously had information released under the
Fixed Income Pricing System (FIPS) were transferred to TRACE. I do not use these "TRACE 50" bonds for my treatment group assignment because the list changed frequently and information about some bonds was available for only a short while. According to FINRA employees, the list changed on a quarterly basis.
" Bonds with a rating of BB or worse were eligible for delayed dissemination: If a BB-rated [B-or-worse-rated] bond
3 Bond Informativeness and Hypothesis Development 3.1 Informativeness of Bond Prices and Trading
My study builds on the idea that the observability of bond market trading and prices adds to the firm's information environment. Informed investors reveal their private information through
trading (Grossman and Stiglitz, 1980; Kyle, 1985; Glosten and Milgrom, 1985), and TRACE makes
this trading and the resulting prices observable. As a consequence, not only do the transaction parties
learn about the private information underlying the transactions, but so does the broader public.
Ultimately, investors "share" their otherwise private information in transparent markets.
The corporate bond market is dominated by large, sophisticated institutions with excellent
access to information (e.g., Bessembinder, Kahle and Maxwell, 2009; Even-Tov, 2017). These
institutions spend significant resources on information acquisition, which their trades then reflect.
Back and Crotty (2015) find that price discovery in bond markets spills over to equity markets, and
vice versa. 1 4Other articles document informed trading and price adjustments prior to economic
news events, such as acquisition announcements, earnings announcements, or class action lawsuits
(Wei and Zhou, 2016; Kedia and Zhou, 2014; Billings and Klein, 2011).
The information content of observable bond prices/trading is incremental to that of equity
prices/trading, and vice versa. The arguably most important conceptual reason for this is that equity
and debt have different payoff profiles as a function of firm performance and thus reflect the same
underlying event (or information set) differently. By reflecting information differently, debt prices
dissemination was delayed for newly issued bonds with a rating of BBB or below: for BBB-rated [BB-or-worse-rated] bonds, transactions within the first two [ten] days after pricing were released on the third [eleventh] day. On January 9,
2006, TRACE stopped the delayed dissemination.
1 Back and Crotty (2015) extend the Kyle (1985) model to allow for cross-market spillovers (from bond order flow to equity prices, and vice versa). They infer that price discovery occurs in both the bond and equity markets, and that it is not dominated by either market with respect to the information conveyed by order flows.
reveal additional information about, for example, firm value, risk, or the probability of
firm-value-influencing events.
To illustrate this point, consider the familiar example of risk shifting actions (Jensen and
Meckling, 1976), which destroy firm value but increase equity value. Assume that both debt and
equity prices fully incorporate all information, such that their incremental informativeness stems
entirely from their different payoff profiles. Observing only either the equity or debt return, investors
cannot deduce whether (i) firm value decreased, (ii) firm risk changed, or (iii) a risk-shifting action
took place. In contrast, when observing both debt and equity returns, they can deduce whether firm
value has changed, whether firm risk has changed, and how much of the equity and debt returns are
attributable to wealth transfers between debt and equityholders. Ultimately, they can better assess
whether a risk-shifting action took place.
There are at least three additional reasons why the information content of bonds is not
subsumed by that of equity, and vice versa. First, subsets of equity and bond investors are specialized
and trade on their private information only in either the equity or debt market. Therefore, equity and
bond prices incorporate different pieces of private information, and observing both "signals" is more
informative than observing only one. Consistent with this argument, Back and Crotty (2015) find
that price discovery occurs in both the bond and equity markets, and Badoer and Demiroglu (2019)
provide evidence that equity prices appear to incorporate more information from debt markets after
TRACE and thus react less negatively to downgrades. 5 Second, equity and bond prices are not
perfectly efficient and may thus incorporate events incorrectly. For example, Even-Tov (2017) and
Bittlingmayer and Moser (2014) use bond returns to predict mispricing in stocks, meaning bonds
contain information that should be, but is not, contained in equity prices. Finally, both equity and
bond prices are noisy, and access to both signals thus leads to more precise posteriors (e.g.,
Holmstrom, 1979).
3.2 Hypothesis Development
Managers often have incentives to withhold information from investors. Economic theory
suggests that investors' access to alternative information is a key determinant of managers'
disclosure decisions, because it determines how investors interpret and react to disclosure (e.g.,
Grossman, 1981; Dye, 1985; Skinner, 1997; and Verrecchia, 1983). For example, the unraveling
result by Grossman (1981) shows that if investors know with certainty whether managers possess
value-relevant information, then informed managers fully reveal their information.16 However, if
investors are uncertain about managers' information endowments, managers withhold sufficiently
bad news (Dye, 1985; Jung & Kwon, 1988).
There are at least three non-exclusive reasons why increased market transparency leads to
increased disclosure. First, abnormal trading and returns suggest whether something material
occurred in the firm and thus whether managers have material information. For example, prior
literature documents abnormal trading and price swings before major, not-yet-announced corporate
news (e.g., Kedia and Zhou, 2014; Wei and Zhou, 2016). Investors demand clarification/disclosure
accordingly, such that informed managers ultimately tend to face increased demand for disclosure
and are more likely to disclose. This argument can be seen as a natural extension of Dye (1985) and
Jung & Kwon (1988), who show that uncertainty about the manager's information endowment limits
disclosure.'7
16 See Beyer et al. (2010) for a discussion of the assumptions underlying the unraveling result.
17 For illustration, suppose the market signals fully reveal whether managers have value-relevant information. In that
case, the conditions of the unraveling result are satisfied whenever managers have information and managers fully reveal their information, and managers fully reveal their information.
Second, the litigation and reputational costs associated with withholding information likely
increase when prices and trading become observable. Observable transaction prices and volumes
assist potential plaintiffs in (i) assessing whether managers had information, (ii) quantifying
investment losses stemming from their reliance on firms' disclosures and non-disclosures, (iii) tying
declines in investors' wealth to a particular disclosure or revelation, and (iv) coordinating class
actions (Park, 2014). Also, observable market data help plaintiffs demonstrate that the firm's bond
market is sufficiently efficient to apply the fraud-on-the-market principle. The fraud-on-the market
principle lifts the requirement that plaintiffs demonstrate direct reliance on a particular disclosure
or non-disclosure (because investors indirectly relied on it through efficient prices) and facilitates
the certification of a class (Park, 2014). In total, TRACE likely increases the threat of litigation,
particularly from bond investors, such that the expected litigation costs associated with withholding
information are higher, which increases managers' incentives to reveal their information (Skinner,
1994, 1997).18
Finally, increased market transparency might increase disclosure by reducing the proprietary
information cost associated with it. To the degree that third parties (competitors, regulators, labor)
extract proprietary information from prices and trading that they would otherwise extract from
disclosures, the proprietary information cost of disclosure decreases, and firms reveal more
information (e.g., Verrecchia, 1983).
There are also arguments why increased market transparency can lead to reduced disclosure.
For example, increased market transparency reduces information asymmetry about firm value
between managers, which can reduce investors' demand for information and equilibrium disclosure
(e.g., Verrecchia, 1990). Also, broad access to market data likely reduces information asymmetry
18 The threat of bondholder litigation is economically meaningful. Park (2014) finds that 8% of all settlements between 2001 and 2005 include bondholder recoveries.
among investors, which may limit the extent to which disclosure incrementally reduces adverse
selection and the cost of capital, and thereby reduce managers' disclosure incentives (Diamond and
Verrecchia, 1991).
In sum, my main hypothesis is that market prices and trading, by revealing information to
market participants, change managers' equilibrium incentives to disclose information. However, it
is not obvious whether managers will disclose more or less. Second, I predict a larger effect in
situations in which the revealed market prices and trading contain more new information. Third, to
the extent that managers prefer to withhold bad news, I predict that TRACE particularly affects bad
news disclosure.
3.3 Other Related Literature
The introduction of TRACE has been studied primarily by the market microstructure
literature. This literature suggests that TRACE-induced transparency reduces transaction costs (e.g.,
Bessembinder, Maxwell and Venkataraman, 2006; Goldstein, Hotchkiss and Sirri, 2007). At the
same time, however, the literature generally finds no increase in trading activity (Goldstein et al.,
2007; Asquith et al., 2013).19
Apart from the aforementioned research, Sletten (2012), Balakrishnan et al. (2014), Zuo
(2016), Hu (2017), and Kim et al. (2018) are likely the papers most closely related to mine. Of these papers, only Kim et al. (2018) study a debt market setting. The paper provides evidence that the
initiation of CDS trading increases corporate disclosure; however, the paper's focus is on CDS
insurance itself, not the observability of prices and trading.2 0
19 Goldstein et al. (2007) find no effect on trading volume, and Asquith et al. (2019) find that trading activity does not
increase, and by one measure decreases. In my sample, I test how TRACE dissemination affects firms' average turnover of bonds and find no significant effect.
" CDS trading represents primarily an economic action: the transfer of cash flow rights, which leads to the empty
creditor problem and reduces monitoring by debtholders. In contrast, TRACE dissemination represents the observability of economic events/actions (or of their absence): for both treatment and control firms, bond trading takes place and is reported to TRACE. For treated firms, however, this information is then made observable.
Sletten (2012) studies the disclosure reaction to stock price drops. In contrast to my paper, (i)
her focus is on ex-post disclosure as a function of ex-post price drops and (ii) prices appear to have
no informational role but are assumed to move independently of value. Zuo (2016) shows that stock
returns tend to be more positively associated with managers' subsequent earnings revisions when
there is more informed trading, which he interprets as managers revising their earnings expectations
more after observing more informative stock prices. Zuo (2016) differs from my paper because he
studies neither market transparency nor the amount of information disclosure.
In Balakrishnan et al. (2014), an exogenous loss of retail analyst coverage due to brokerage
closures and mergers leads to an increase in earnings-related management forecasts. The authors
interpret their results as managers aiming to reduce information asymmetries between retail
investors and institutional investors. Another related paper is Hu (2017), which studies how an
increase in the frequency at which exchanges release daily open short interest, from once per month
(only mid-month) to twice (mid-month and end-of-month) affects the relative disclosure
probabilities around the mid- and end-of-month dates. My paper differs from Hu's because I study
the effect of making otherwise-unobservable realized bond prices and trading observable, while Hu
studies the latency/frequency at which exchanges release open short interest. Also, I focus on the
total amount of management forecasts, while Hu's evidence on the probability of end-of-month
disclosure relative to the probability of mid-month disclosure speaks best to the strategic timing of
disclosures around predictable public information releases.
4
Sample
I use data from the following sources. FINRA gave me lists of the bonds introduced in each
phase and also the 120 randomly chosen treatment bonds used in the FINRA 120 experiment. I
obtain data on bond issue characteristics (such as issue size, maturity, or rating information) from
on management forecasts from IBES, data on firms' accounting fundamentals from Compustat, and
data on stock prices and returns from the CRSP Security Files.
Following prior literature, I use the intersection of CRSP and Compustat as the firm universe
and "standard" corporate bonds in the intersection of TRACE and FISD as the bond universe.2 I
match bonds to firms using a matching algorithm that relies on bonds' cusips, issuer names in bond
prospectuses, and S&P RatingsXpress and CRSP tables on WRDS. I keep the firm quarters of all
firms associated with at least one bond in FINRA's phase lists. Thus, my difference-in-differences
design compares only firms with public bonds, mitigating selection concerns stemming from the
decision to issue bonds. I exclude firms with an SIC code between 6000 and 6999 (i.e., financial
institutions and REITs). Finally, I limit the sample period to July 2001 (one year before the first
phase introduction) through February 2006 (one year after the last phase introduction).
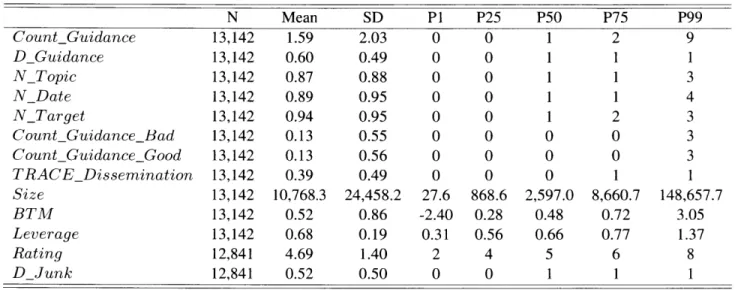
The final sample consists of 13,142 firm-quarter observations between July 2001 and February
2006, with 849 unique firms. Panel A of Table 2 displays descriptive statistics for the final sample, and Panel B shows the variable means by the TRACE phase group. The sample firms are relatively
large with an average market capitalization of $10.77 billion. Firms in earlier phases tend to be
larger, likely because large firms tend to have larger and more secure bond issues. The average
guidance frequency is 1.59 forecasts per quarter for the pooled sample and ranges from 1.15
forecasts for Phase 3B firms to 2.18 forecasts per quarter for Phase 2 firms.
The conceptual treatment variable is the observability of market trading/prices of a firm's debt.
I use FINRA's lists of bonds introduced in each phase to code my empirical treatment variable,
2 "Standard bonds" exclude non-USD bonds, Yankee bonds, Rule 144A bonds (which were also not subject to TRACE), convertible bonds, pay-in-kind bonds, secured or asset-backed bonds, perpetual bonds, variable-coupon bonds, and bonds with an offering amount below $1 million.
TRACEDissemination, a dummy variable that equals one if at least one of the firm's bonds has
started TRACE dissemination and zero otherwise.
5 Research Design and Main Results
My goal is to estimate the treatment effect of market transparency (i.e., of the observability of bond prices and trading) on corporate disclosure. This section contains my main tests, which exploit
the staggered implementation of TRACE in a generalized difference-in-differences framework.
From an empirical design perspective, the implementation of TRACE offers multiple desirable
features. First, TRACE made virtually all trading in corporate bonds observable, thereby affecting
the large population of firms with public bonds. This broad impact allows me to run large-sample
tests with a high degree of statistical power. Second, firms' bond trading became observable at
different times (in 2002, 2003, 2004, and 2005), allowing me to compare firms whose bonds become
observable with those of firms for whom bond observability does not change simultaneously.
Importantly, I can restrict this comparison to public firms with public bonds, alleviating concerns
about selection bias stemming from the endogenous decision to become/stay public or to issue
bonds. Finally, having multiple introduction dates is beneficial because potential confounding
effects that survive the comparison with the control group likely average out over the phases and
thus have less impact on the treatment effect estimator.
5.1 Effect of Market Transparency on Disclosure
My main regression model is outlined in equation (1) and uses a generalized difference-in-differences approach (e.g., Bertrand and Mullainathan, 2003). This regression model accounts for
the fact that the multiple TRACE phases are introduced in a staggered fashion. The firm fixed effects
control for fixed differences between treated and non-treated firms and the time fixed effects control
for aggregate fluctuations over time. The regression ultimately uses variation around the TRACE
introduction date as control firms, including firms that already have observable bonds from an earlier
TRACE phase or will have observable bonds at a later point in time.
CountGuidanceit =
f
- TRACEDisseminationit + y'Controsi,t-1 + a + at + Eit (1)The outcome variable, CountGuidance, is the count of management forecasts in the fiscal
quarter.22 TRACEDissemination is a dummy variable that equals one if the firm has a bond for
which TRACE dissemination has begun. The coefficient on TRACEDissemination estimates the
treatment effect of TRACE on the disclosure frequency. The control variables include the lagged
log-market capitalization, lagged book-to-market, lagged leverage, and firm- and fiscal-year-quarter
fixed effects. These variables control for the effects of firm size, growth opportunities, and capital
structure on firms' disclosure. My results are robust to including various other control variables,
including different proxies for firm size, credit risk, firm performance, or time trends for each phase
group.2 3
Table Al in the appendix contains the variable definitions. I cluster standard errors at the
firm and fiscal-year-quarter levels.
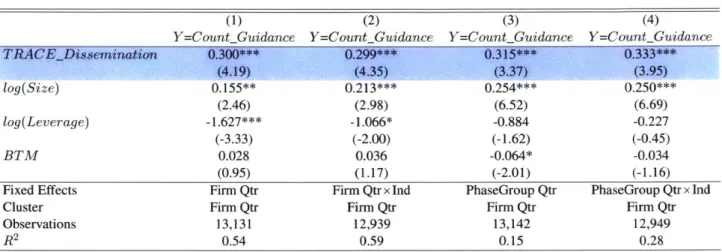
Panel A of Table 3 contains the first main result of my paper. Specifically, Column 1 contains
my main specification from estimating equation (1), which uses firm and year-quarter fixed effects.
The treatment effect estimate is significantly positive, suggesting that disclosure increases in
response to the TRACE-induced increase in market transparency. The coefficient magnitude
suggests that firms provide 0.3 more management forecasts per quarter as their bond trading
becomes observable, which corresponds to an 18.8% increase in the forecast frequency relative to
2 Some articles use log(1+CountGuidance) as the disclosure variable. My results are robust to using this
transformation as well. However, using the raw CountGuidance measure allows me to better assess the economic magnitude of my estimates. Using the "logged" measure, assessing the economic magnitude is difficult. The usual "percentage-change" interpretation of logged variables is approximately right if (i) the values in CountGuidance were large and (ii) the changes in CountGuidance were relatively small. However, these conditions are not satisfied by
CountGuidance, so a percentage interpretation might be inadequate.
23 Including these different control variable combinations does not alter my inferences, neither qualitative nor with regard to magnitude. I decide to include relatively few control variables in my model, trading off the potential biases from omitting relevant variables vs. those from including "bad controls" (see Angrist and Pischke, 2009).
the sample mean of 1.6. This result can be seen as my paper's main finding: firms increase their
discretionary disclosure in response to increased market transparency.
The remaining columns in Table 3 employ different fixed effect structures. For example, to
mitigate concerns that firms in different phase groups are subject to different industry-specific
dynamics in disclosure, I employ industry-times-year-quarter fixed effects. I estimate a disclosure
increase of 0.299 forecasts per quarter (in column 2), which is almost the same as the estimate from
my main specification. In columns 3 and 4, I use less restrictive fixed effects combinations, with
fixed effects for the phase groups rather than for individual firms. Across all specifications, the
estimates are similar in size, ranging from 0.3 to 0.33 forecasts per quarter. In untabulated tests, I
also estimate difference-in-differences models for each phase introduction and for a "stacked"
sample and find that disclosure increases in response to information becoming available through
TRACE.2 4
In Panel B,I focus on the decision about whether or not to disclose, i.e., on the extensive
margin of disclosure. 2 5The dependent variable is D_Guidance, a dummy indicating whether the
firm made at least one management forecast in the quarter. Across all columns, I estimate that
TRACE increases firms' probability to disclose by 2.5% to 3.2%. For comparison, the probability
of providing guidance is 60.1% in my sample.
5.2 Parallel Trends and Confounding Effects
2 I use symmetric windows from one year before to one year after a given phase introduction date. For all four phases,
I estimate a positive effect of TRACE on disclosure. This estimated increase in disclosure is significant for Phases 2, 3A, and 3B, but not for Phase 1. The estimated increase in disclosure is lowest for Phase 1 and largest for Phase 3B.
Because the estimations for individual phases are noisy and more sensitive to simultaneously occurring events, I also "stack" the four phases, and estimate an increase of 0.31 forecasts per quarter in response to TRACE. This "stacked" coefficient can be interpreted as the precision-weighted average of the treatment effects for the individual phases.
21 Count Guidance, can also be seen as capturing the extensive margin in the sense that multiple disclosures reflect
Like most regulation that involves multiple "treatment groups," NASD did not assign firms
into treatment groups in a purely randomized fashion. Instead, the assignment occured at the bond
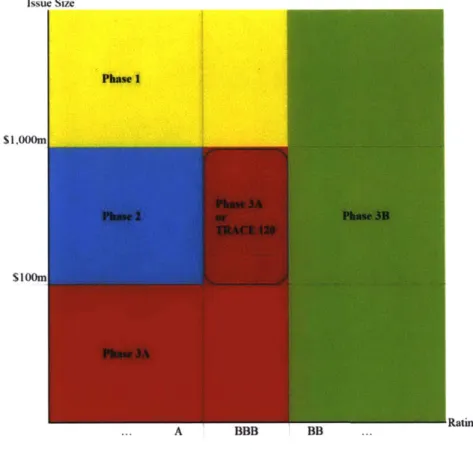
level based on credit ratings and issue sizes. Figure 2 illustrates the threshold rules used to assign
bonds into different treatment groups and highlights that bonds in different phase groups differ
systematically in their issue sizes and credit ratings. As a consequence, firms in different phase
groups tend to differ along associated dimensions, such as their amount of public debt, firm size,
and credit risk. These systematic differences are not a problem per se, but they raise the concern that
firms in different treatment groups might, even in the absence of TRACE, have experienced
different changes in disclosure around their respective TRACE introduction dates.
I address potential concerns about parallel trends in two broad ways. First, in this subsection, I examine the timing of the disclosure increase relative to the TRACE introduction dates and provide evidence that the parallel trends assumption is satisfied in my sample. My second broad way of
addressing concerns about parallel trends is to focus directly on the source of possible differences
between the treatment and control groups: the non-random assignment of bonds into treatment
groups. In Section 6, I exploit a randomized controlled experiment, in which NASD started to
release the transaction information for a small number of randomly selected bonds. In a similar
spirit, in Section 7, I exploit cutoff rules used by NASD that sometimes lead to discrepancies in the
treatment group assignment of otherwise similar firms.
In this subsection, I examine the timing of changes in firms' disclosure relative to the TRACE
introduction dates. The intuition underlying this examination is that market transparency increases
discontinuously around a firm's phase introduction date, while confounding effects likely do not.
Thus, if the observability of trading and prices affects disclosure, I expect a discontinuous increase
in disclosure around the TRACE introduction dates. This intuition is similar to that underlying an
dates. Moreover, by uncovering how a firm's pre-period disclosure evolved (relative to the control
group), the examination suggests whether the parallel trends assumption is plausible.
CountGuidancei1 = y 1QtrPre3 + y2QtrPre2 + y3QtrPrel + fl1QtrPostl+ 2QtrPost2
+fl3QtrPost3 + f4QtrPost4_plus + a + at + y'Controlsi,t_1+ Eit (2)
Equation (2) estimates the treatment effect of the TRACE introductions on disclosure in the
surrounding quarters. The period ending in the fourth quarter before the TRACE introduction is
omitted and thus serves as the benchmark against which the change in disclosure is measured. Table
4 contains the estimates, and Figure 3 plots the estimates from my main specification. Consistent
with parallel trends, the estimated treatment effects are close to zero and insignificant for each
quarter before a firm's TRACE introduction and significant and positive for each quarter after it. In
other words, disclosure jumps precisely when a firm's prices and trading become observable, but
not before, suggesting that disclosure increases because of the information's availability in TRACE,
rather than confounding factors. Moreover, consistent with the idea that TRACE reveals more
information over time, disclosure appears to increase slightly over the post-period.
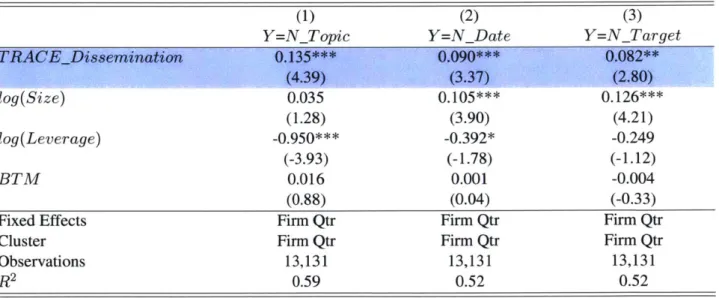
5.3 Effect on Three Dimensions ofManagerial Forecast Frequency
To shed further light on the nature of the documented disclosure increase, I provide more
granular evidence on how firms change their disclosure. Specifically, I ask three related questions.
Do managers forecast (i) more "topics" (e.g., CapEx in addition to Earnings), (ii) more horizons
(e.g., the fiscal year 2005 in addition to 2004), and (iii) more frequently (e.g., on February 1 in
addition to March 1)? To capture these dimensions, I code the variables (i) NTopic as the count of
distinct forecasted topics, 2 6 (ii) N Target as the count of distinct forecasted target months, and (iii)
NDate as the count of distinct dates when a forecast is made.
Table 5 contains my estimates. I find that firms significantly increase their disclosure
frequency along all three disclosure dimensions. This finding suggests that firms disclose not only
more frequently the same variables, they also disclose about a broader set of variables (e.g., about
additional topics and periods).
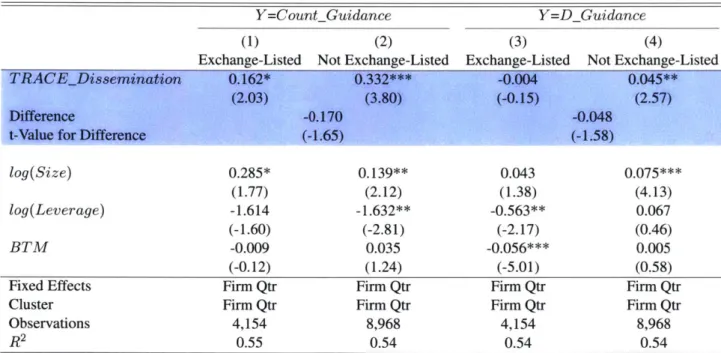
5.4 Cross-Sectional Variation in the Informativeness ofBond Prices and Trading
If the increase in disclosure is driven by the dissemination of price and transaction information, then I predict a stronger effect in situations in which the disseminated prices and trading tend to
contain more incremental information. I test this prediction in two ways. First, I test whether the
TRACE introduction has a weaker effect on firms with exchange-listed bonds.2 7 Exchange-listed
bonds generally have observable binding quotes and thus had a relatively higher degree of price
transparency even before TRACE. TRACE is thus likely to reveal less incremental information. I
partition the sample based on whether a firm has exchange-listed bonds and estimate the effect of
TRACE in each sample. Table 6 contains the results. The increase in disclosure is half as strong for
firms with exchange-listed bonds as for firms without them (0.16 vs. 0.33), which is consistent with
the idea that the revealed information content of market trading and prices is what leads to the
documented increase in disclosure.
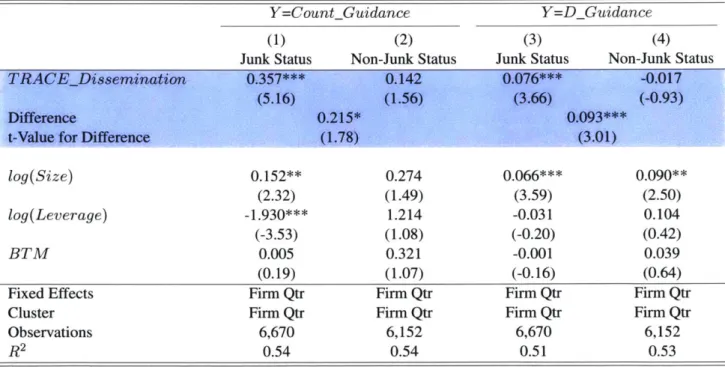
My second test relies on Merton's (1974) insight that the information sensitivity of debt increases with the firm's credit risk. At one extreme, for firms with risk-less debt, debt values do
not change with news about the firm and are thus uninformative. At the other extreme, for
close-to-default firms, debt values are very sensitive to information about firm value and are thus more
reflective of this information. I partition the sample into investment-grade and junk-bond firms and
estimate the effect of TRACE in each sample. Table 7 contains the estimation results. The estimated
2 I obtain data on whether a bond is listed on the NYSE from Mergent FISD. Mergent generally codes this information
increase in disclosure is more than twice as large for the junk-bond firms as it is for the
investment-grade firms (0.36 vs. 0.14), further supporting the notion that the increase in disclosure is driven by
the revealed information content of prices and trading.
5.5 Effect on Bad vs. Good News Disclosure
Accounting theory generally predicts that managers have greater incentives to withhold bad
news than good news. If the increase in disclosure is attributable to less withholding of bad news,
then I expect that the disclosed information content will become more negative, on average. I test
this prediction in two ways. First, I classify disclosures as negative or positive and test whether
TRACE predominantly affects the amount of negative disclosures. Second, I test whether the
average announcement return becomes more negative after TRACE's introduction to draw
inferences about the average information content of the disclosures.
My first test classifies management forecasts into positive and negative based on the market's reaction to the forecast.2 8 Stock returns correspond exactly to the theoretical information construct
in accounting theory and capture a forecast's unexpected value implications. Two further advantages
of using stock returns to classify forecasts are that (i) I can classify management forecasts about
sales or CapEx, for which an unexpectedly high forecasted value is not necessarily good news, and
(ii) I can circumvent problems associated with measuring the manager's expectation revealed
through the forecast and the market's expectation at the time of the forecast.29 However, using
28 I use the 3-day market-adjusted return to classify disclosures as positive or negative. Prices move even in the absence
of disclosure, which induces noise and thus misclassifications of the disclosures. To mitigate the misclassification problem, I classify disclosure returns as positive or negative only if they are larger in magnitude than the price movement on a standard day. I proxy for the magnitude of a "standard" 3-day return using the standard deviation of the firm's daily market-adjusted returns (scaled by Vn= 3 ).
29An alternative to using returns to classify announcements is to focus only on earnings forecasts, for which a
better-than-expected value corresponds to positive stock reactions. The problem using this approach is the necessity to correctly measure for each forecast (i) what the manager's revealed earnings expectation was and (ii) what the market's expectation at the time of the forecast was. One could assume the midpoint of the manager's range forecast equals the manager's revealed earnings expectation; however, Ciconte et al. (2014) demonstrate that the range midpoint is a bad proxy for the manager's revealed expectation, even on average. Likewise, one could assume that past analyst forecasts equal the market's expectation at the time of the forecast, but the analyst forecast might be stale and also biased, with
returns to classify management forecasts requires the stock return to correspond well to the revealed
information in the management forecast, i.e., the announcement returns should not be confounded
by simultaneous events, such as earnings announcements. For this reason, I focus on unbundled forecasts. Panel A of Table 8 shows the estimation results. The frequency of management forecasts
increases significantly for bad, but not for good, news announcements, consistent with the idea that
the additional disclosures represent otherwise-withheld bad news.
My second test estimates the effect of market transparency on the average news content of management forecasts by directly focusing on the announcement return. In particular, my main
dependent variable in Panel B, Ret Announcement, is the portion of the firm-quarter's return that
accrues around unbundled announcement days. I find that announcement returns become, on
average, more negative, suggesting that as markets become more transparent, the average content
of management forecasts becomes more negative. The estimated effect of -1.1% is economically
meaningful. In contrast, I find no significant effect of TRACE on the return on non-announcement
days or the total fiscal-quarter return. Overall, my results are consistent with the hypothesis that
market transparency induces managers to reveal more bad news to investors.
6 Experimental Analysis
NASD conducted a small controlled experiment, introducing 120 randomly selected BBB-rated bonds to TRACE on April 14, 2003. I use this experiment to address the concern that in my
main sample treatment is not randomized and the parallel trends assumption is thus not implied. The
experiment was conducted together with three finance researchers to estimate the effect of price
transparency on liquidity (on volume and estimated bid-ask spreads) and is published in Goldstein
et al. (2007).3o
the bias depending on the forecast horizon (e.g., Kothari et al., 2016).
6.1 Replication of the Sample
FINRA kindly provided me with the list of the 120 treated bonds, so I know which bonds
received treatment and which did not. To replicate the pool of bonds that could have received treatment (hereafter, the "base sample"), I follow the experiment description in Goldstein et al.
(2007). The transaction data needed to construct the "base sample" has recently been made available to researchers.3 1
The base sample was selected based on non-disseminated TRACE transaction data for BBB
bonds between July 8, 2002, and January 31, 2003. The sample was narrowed down over the course
of multiple steps. An included bond is BBB-rated with an issue size between $100 million and $1 billion. The bond must be a "standard" corporate bond, have at least one more year of maturity, not be newly issued, not be issued by a bank, not be convertible, and it must have a certain amount of
transaction activity during the selection period. Goldstein et al.'s restrictions on issue size and rating imply that an included bond had not been disseminated in an earlier phase. Because my study takes
place at the firm level, this step is insufficient, and I explicitly exclude firms in Phases 1 or 2. After creating the base sample, NASD randomly selects 90 actively traded and 30 thinly traded
bonds.3 2
For the actively traded bonds, they first pick 90 pairs of similar bonds (matched on industry, average trades per day, bond age, and time to maturity), and then randomly pick and treat one bond
per pair. For the thinly traded bonds, they select and treat 30 bonds at random from the base sample of thinly traded bonds.
subsample of actively traded bonds. The results are consistent with investors learning from the broader bond pricing data and being able to negotiate better terms with dealers.
31 acknowledge that my replication of the base sample likely contains some error. For example, my algorithm to clean the original TRACE data from errors might differ from the one used by NASD.
2 Firms are classified as "actively traded" if they trade at least once per week, on average, during the selection period. Firms are classified as "thinly traded" if they trade between once every two weeks and once every two days.
Goldstein et al. use two kinds of control groups. For both actively and thinly traded bonds,
they use those bonds in their base sample that did not receive treatment as the control group. For
actively traded bonds, they also use the 90 matched bonds as an alternative control group. Since my
analysis takes place at the firm level, my treatment group consists of firms with a bond that received
treatment in the experiment, and my control group consists of untreated firms with a bond in the
base sample (i.e., of firms that could have received treatment but did not).
The final sample consists of 1,572 firm-quarters in the period starting one year before and
ending one year after FINRA started dissemination for the randomly selected bonds. Panel A of
Table 9 contains descriptive statistics for the base sample, and Panel B contains mean values for the
treatment and control groups, respectively. Most of the mean values for the treatment and the control
groups are relatively similar. When I test for the equality of the pre-period means, I find no
significant difference for the disclosure variables or leverage. However, I find that firms in the
treatment group tend to have a larger market capitalization, which is also reflected in their
book-to-market ratios. This difference suggests that the treatment group assignment within my base sample
may not be perfectly random.34
6.2 Results
I estimate the treatment effect of price observability on disclosure using the difference-in-differences regression in equation (3). The control variables in this regression include the lagged
market capitalization, book-to-market ratio, and leverage, and they mainly serve the purpose of
increasing the estimates' precision.
33 For robustness, I also use Goldstein et al.'s (2007) matched bond sample, which Edith Hotchkiss kindly shared with
me, and find a significant effect on disclosure. The number of observations in that sample is much lower, however, and the tests' statistical power is likely lower as well.
3 Alternatively, the inequality of means could be due to chance. Under the null hypothesis of equal means, the probability of rejecting equality at the 10% significance level for at least one of the 10 variable means is about 65% if the variables are independently distributed and 10% if the variables are perfectly positively correlated.
CountGuidance1t = f * Postt * Treati + y1Postt +Y 2Treati + 6'Controlsit+ Eit (3)
Panel A of Table 10 contains the estimates. In the first column, I run the baseline model
without fixed effects and estimate that firms increase their disclosure by 0.36 forecasts per quarter
as their bond trading becomes observable. In columns 2 through 4, I add firm and/or quarter fixed
effects. Despite the small sample size, the treatment effect estimates remain relatively stable across
specifications, ranging from 0.30 to 0.36, which suggests that the treatment assignment is
conditionally independent of the added effects. Moreover, the treatment effect estimates are of the
same magnitude as those from my large sample regressions in Table 3, which ranged from 0.30 to
0.33.
In Panel B, I estimate the effect of TRACE market transparency on the amount of negative
and positive disclosures, as classified by the 3-day announcement return. I estimate that bad news
disclosure significantly increases (by 0.17 forecasts per quarter), but I find no effect on good news
disclosure. This finding is consistent with managers withholding less negative news as market
participants become more informed.
7 Exploiting Cutoff Rules Used to Assign Bonds to Phases
In the main phase-in of TRACE, firms are assigned to phase groups based on their bonds'
issue size and rating. To address concerns about this non-random treatment assignment, I exploit
that bonds' treatment assignment is based on threshold rules with regard to the bonds' issue size
(conditional on rating) and that these threshold rules do not necessarily transfer to the firm level. To
illustrate, an investment-grade bond receives treatment in Phase 1 if its issue size exceeds $1 billion.
Consequently, a firm receives treatment if it has one $1 billion investment-grade bond, but not if it
has two $500 million investment-grade bonds. Because of this discrepancy in firms' treatment