Publisher’s version / Version de l'éditeur:
Questions? Contact the NRC Publications Archive team at
[email protected]. If you wish to email the authors directly, please see the first page of the publication for their contact information.
https://publications-cnrc.canada.ca/fra/droits
L’accès à ce site Web et l’utilisation de son contenu sont assujettis aux conditions présentées dans le site LISEZ CES CONDITIONS ATTENTIVEMENT AVANT D’UTILISER CE SITE WEB.
Research Report (National Research Council of Canada. Institute for Research in Construction), 2002-11-01
READ THESE TERMS AND CONDITIONS CAREFULLY BEFORE USING THIS WEBSITE.
https://nrc-publications.canada.ca/eng/copyright
NRC Publications Archive Record / Notice des Archives des publications du CNRC : https://nrc-publications.canada.ca/eng/view/object/?id=b89830f2-1a99-4b8b-a873-d810485f39d5 https://publications-cnrc.canada.ca/fra/voir/objet/?id=b89830f2-1a99-4b8b-a873-d810485f39d5
NRC Publications Archive
Archives des publications du CNRC
For the publisher’s version, please access the DOI link below./ Pour consulter la version de l’éditeur, utilisez le lien DOI ci-dessous.
https://doi.org/10.4224/20378724
Access and use of this website and the material on it are subject to the Terms and Conditions set forth at
IBANA-Calc Validation Studies
IBANA-Calc Validation Studies
Bradley, J.S.
IRC-RR-125
November 2002
IBANA-Calc Validation Studies
J.S. Bradley
Acknowledgements
This work was carried out as part of the IBANA project. Primary financial support for the IBANA project was provided by Transport Canada, the Department of National Defence and the National Research Council. Additional funding was received from Vancouver International Airport Authority. The helpful cooperation of the staff at Toronto and Vancouver airports in making arrangements for the various field measurements was very much appreciated.
The assistance of Mr. Keith Lay in the carrying out the field measurements, including the playback and processing of the tape recordings at each site, is gratefully acknowledged. Initial calculations were performed by Mr. Gérald Mayaud.
Summary
This report compares measured and predicted indoor sound levels in buildings exposed to aircraft noise. Predictions were made using the IBANA-Calc software that was developed to make it easy and convenient to calculate indoor sound levels in buildings exposed to aircraft noise. This report is therefore a further validation of the IBANA-Calc software and an exploration of some of the details of the predictions and the differences between laboratory and field measurements of sound insulation.
The work is the final component of the IBANA project (Insulating Buildings Against Noise from Aircraft) that included: (a) laboratory measurements of the sound
transmission loss of building envelope components, (b) field measurements of a varied constructions of a test house at Ottawa Airport and (c) development of the IBANA-Calc software.
Measurements reported here were made using multi-track recordings of indoor and outdoor sound levels in buildings near Vancouver and Toronto Airports. These included new homes near Toronto Airport, an older home near Vancouver Airport and offices in a Vancouver Airport building. The sites were not ideal simple cases but included various complicating factors that made the predictions more challenging.
The results show that predictions of indoor sound levels can be quite accurate where there are no complicating factors. In the new houses near Toronto airport, the overall
A-weighted level reductions for 3 of the 4 measured cases were predicted within 1 dBA. Nine of the 10 cases considered could be predicted within an overall A-weighted level difference error of about 3 dBA.
Three major sources of errors were identified.
• There tend to be significant differences in the noise reductions of windows at their mass-air-mass (MAM) resonance frequency between laboratory and field situations. There is evidence that these differences are sensitive to the angle of incidence of the aircraft noise. Sound transmission at the MAM resonance frequency is usually the cause of the dominant indoor sound levels and so these errors have a significant effect on the overall indoor sound levels.
• There are also large differences in the measured sound insulation of common wood stud exterior walls between laboratory and field conditions. These are also associated with low frequency resonances that lead to a pronounced dip in the sound insulation measured in the laboratory. These dips are much less obvious, and noise reductions are significantly greater, when measured in actual buildings. These differences were found to lead to substantial errors in predicted overall indoor sound levels.
• The lack of laboratory sound transmission loss data for some constructions made it impossible to produce accurate predictions. There is a need to acquire more data for constructions common in commercial buildings and in high rise apartment buildings. Evaluation of some of the optional corrections included in the IBANA-Cal software provides further guidance for users.
Table of Contents
pageAcknowledgements 1
Summary 2
Table of Contents 3
1. Introduction 4
1.1 IBANA-Calc Validation Studies 4
1.2 The Complete IBANA Project 4
2. Procedure 6 2.1 Measurements 6 2.2 Predictions 7 2.3 Measurement Sites 8 3.0 Results 11 3.1 Oakview 11
3.1.1 Oakview, north-east bedroom 11
3.1.2 Oakview, north-west bedroom 15
3.2 Summerhill 18
3.2.1 Summerhill, north-east bedroom 21
3.2.2 Summerhill, north-west bedroom 21
3.3 Brown Area House 24
3.3.1 Brown Area House, North-east bedroom 24
3.3.2 Brown Area House, North-west bedroom 28
3.4 Vancouver Airport Building 32
4. Discussion 40
4.1 Differences between laboratory and field transmission loss measurements 40
4.2 Use of optional corrections in IBANA-Calc 41
4.3 Changes to IBAN-Calc 42
4.4 General problems 42
5. Conclusions 44
References
46
Appendix I. Optional Corrections included in the IBANA-Calc Software 47
1. Introduction
1.1 IBANA-Calc Validation Studies
This report presents comparisons of measurements of the sound insulation of several buildings exposed to aircraft noise with predictions of the expected sound insulation using the IBANA-Calc software. The noise reduction of incident aircraft noise was measured in 1/3 octave bands for 10 rooms in buildings near Toronto and Vancouver Airports. Calculated noise reductions for aircraft noise were obtained using the IBANA-Calc program with its database of building envelope transmission loss data. Measured and calculated noise reductions are compared to explore the accuracy of the predictions and to investigate the appropriateness of several optional corrections included in the IBANA-Calc software.
Ideally, such comparisons would have included measurements of simple configurations in new buildings with well known construction details located in areas of very high aircraft noise to ensure good quality measurements and straightforward predictions of sound insulation. Such ideal measurement sites could not be found and the measurement sites reported here represent more challenging conditions to predict. For example, the sites near Toronto Airport did represent new construction but were located too far from the airport to have ideally loud incident aircraft sound levels. As a result indoor aircraft noise levels could not be accurately measured at high frequencies. Measurements in a house near Vancouver Airport were more difficult to predict because the location of the house led to unusual angles of incidence for the aircraft noise and also due to the less well-defined acoustical properties of the building construction.
It would also have been interesting to evaluate more sophisticated sound insulation designs. In practice the houses that were measured near Vancouver and Toronto airports showed no indication of such designs. In the cases reported here, the dominant sound paths were always through the windows and there was no evidence of any consideration for improving the sound insulation of this obvious weak link. Similarly, measurements of a commercial building at Vancouver Airport also indicated that the dominant sound path was via the windows. However, in this case the windows were of a more substantial design.
Therefore, the comparisons presented in this report represent situations that are in various ways more complex to predict and hence do not correspond to straightforward validation studies.
1.2 The Complete IBANA Project
This work is a final component of the IBANA project (Insulating Buildings Against Noise from Aircraft). The complete IBANA project included both laboratory [1] and field measurements [2] of building envelope sound insulation as well as the creation of the IBANA-Calc computer software [3] to permit the convenient use of these data to design the sound insulation of the building envelope against intruding aircraft noise. The IBANA project is a result of an earlier comprehensive review of the NEF (Noise Exposure Forecast) aircraft noise measure and various aspects of predicting aircraft noise
aircraft noise. It was further concluded that, in Canada, available technical information and guidelines [7] for achieving improved sound insulation were out of date and in need of a new approach. A more specific review of current knowledge of building façade sound insulation issues was also completed [8]. This study found, that although the basic principles were generally well understood, there was almost no available data
representative of the sound insulation of modern Canadian building constructions. Further, there was only a rough understanding of the relationship between laboratory and field sound insulation data, and existing Canadian guidelines were based on aircraft noise spectra that are not representative of modern aircraft types.
The complete IBANA project has included the following key components: • Laboratory measurements of the sound insulation of various building façade
components including various wall and roof constructions as well as windows and the effects of vents [1].
• Field measurements of the sound insulation of various configurations of a simple wood frame test house at Ottawa Airport [2].
• Development of procedures for conversion between laboratory and field measurements of sound insulation [2].
• Development of software to enable the more accurate and convenient design of the required sound insulation for buildings exposed to aircraft noise [3].
2. Procedure
2.1 Measurements
The field measurements of noise reductions were made by simultaneously recording aircraft flybys both outdoors and indoors using a total of 8 microphones. Two
microphones were outdoors and there were 3 microphones in each of the test rooms. The principal outdoor microphone was mounted on a mast 8.5 m above ground level near the test building. It recorded the free-field incident aircraft sound levels. For the Toronto Airport houses (Oakview and Summerhill) the second outdoor microphone was attached to the brick surface of the building façade facing the passing aircraft and 2.1 m above ground level. The three microphones in each room were distributed to sample room positions more than 1 m from room surfaces.
The outdoor microphone (on the mast) was a Bruel and Kjaer type 4921 outdoor microphone system. All of the other microphones were Bruel and Kjaer type 4190, 12 mm condenser microphones attached to Bruel and Kjaer type 4921 impedance matching preamplifiers. These 7 microphones were powered by ACO Pacifico battery powered microphone power supplies that were also used to amplify the microphone signals. Five channels of the signals were connected to a Tascam DA38 8-track digital audio tape recorder via X-Wire digital transmitters and receivers. The other three channels were directly connected by cable to the tape recorder. All of the equipment could be battery powered. Figure 1 below shows a symbolic block diagram of the measurement
equipment. X X X X X X X X X X X Room A Room B
Facade Mic Outdoor Mic
8-track digital tape recorder
Figure 1. Block diagram of field recording system. (X = X-Wire digital transmitter or receiver).
Continuous recordings were made to include all of the aircraft events over an
approximately two-hour period. Calibration tones were recorded on each track at both the beginning and the end of the two-hour period.
Reverberation times were also measured in each room. The decay of an interrupted pink noise test signal was recorded in each room to obtain results over the same 50 to 5000 Hz range as the aircraft noise reductions. Five decays were recorded at each of the 3
microphone positions in each room. A Norwegian Electronics type 830 1/3 octave band real time analyser was used to determine the reverberation times over the first 15 dB of each decay. Values were averaged over data from all 3 microphone positions for each room. Although the low frequency decays were extremely irregular these estimates are thought to be adequate for use in the present noise reduction calculations.
The first step in processing the recordings was to listen to them and identify significantly loud aircraft events that were not contaminated with other types of noise. This was particularly difficult for the Toronto houses where local road traffic noise was often a problem. When the acceptable events had been located on the tape, each of the 8
microphone signals was processed to give 1/3 octave band spectra at 0.1 s intervals for a total of 30 s for each aircraft event. This was done by computer controlled playback of the tapes, 2 channels at a time, into a Bruel and Kjaer type 2144 real time analyser. The resulting multi-spectra for each of the 8 tracks were stored in a single spreadsheet file that included all 1/3 octave bands from 50 to 5000 Hz.
Further processing was done using computer spreadsheet software. The results for the 3 microphones in each room were first averaged to get a single room average result. The data was reduced to 1 s time intervals by summing the values at 0.1 s time increments over each 1 s period. The data was further reduced by summing the levels in each band, that were within 10 dB of the maximum, to calculate Sound Exposure Levels (SEL) in each frequency band and for each microphone location. That is, SEL spectra were obtained for the Outdoor microphone recording, the Façade microphone recording, and for the averages of the microphone recordings in each room. The difference between the outdoor microphone and indoor SEL spectra were used to determine the noise reductions (NR) of each aircraft event for each room tested.
2.2 Predictions
All sound insulation predictions were made using the IBANA-Calc software. Use of the software is described in the IBANA-Calc Users Manual [3]. The user must enter the dimensions of each building façade component and select the sound transmission loss data of the most appropriate construction from the program’s data base. The user also enters the floor area of each room and the amount of sound absorption as a percentage of the floor area. These percentages are normally estimated as a function of the room type but where measured reverberation times are available (as in these validation
measurements) it is possible to more accurately estimate the absorption as a percentage of the floor area. However, the program does not allow for variations of absorption with frequency because these were found to be small in measurements of Canadian homes [9]. Therefore frequency-averaged values must be used.
In the IBANA-Calc software, each exposed building façade can be treated as a separate scenario calculation and the results of each façade component are added or combined to determine the total indoor sound levels at each 1/3 octave band frequency. Thus the indoor sound levels could be separately calculated for one or more exposed exterior wall
and for a roof/ceiling element. For the convenience of the current comparisons with measured results, the summations were performed external to the program in spreadsheet calculations. The results of each scenario calculation (i.e. for each building envelope façade) were output using the Print to File function of IBANA-Calc.
The IBANA-Calc software also includes several optional corrections to account for expected effects of the vertical angle of the source and for restricted horizontal angular views of the aircraft pass by (see also Appendix I). Calculations were included both with and without these corrections to further evaluate their use. For example, where exposed exterior walls were perpendicular to the flight path, the horizontal angular view of the fly by would be restricted. The measurement sites included in this report did not provide an opportunity to further evaluate other corrections. For example, none of the measured rooms were on the ground floor so the ground reflection effect correction could not be used. The air absorption correction to the outdoor aircraft noise spectrum shape was not used because the same recordings at Vancouver and Toronto Airports had previously been used to develop this correction.
All comparisons are either in terms of noise reductions relative to measured or predicted outdoor sound levels or in terms of indoor sound levels estimated relative to the predicted outdoor sound levels.
2.3 Measurement Sites
Sound insulation measurements of a total of 10 rooms in buildings exposed to aircraft noise near Toronto and Vancouver Airports are used in this report. All of the test rooms were on the second floor of the buildings. This was not planned but simply where the most appropriate completely enclosed rooms were located in each case. The selected rooms had to be completely enclosed, well defined spaces with at least one exterior surface exposed to the noise of passing aircraft.
Measurements were made in a total of 8 rooms at four new houses near Toronto Airport. For the recordings in two of the houses, the aircraft were landing and it was not possible to get adequate indoor sound levels for these cases. For the other two houses near Toronto Airport, referred to as Oakview and Summerhill, adequate indoor levels were obtained because measurements at these buildings corresponded to aircraft taking off. These two homes were new buildings being used as model homes. They were completely finished with drapes and in one case carpeted floors, but the rooms were not furnished. The rooms tested were second floor bedrooms because these were well-defined enclosed spaces on the side of the building exposed to the noise of the passing aircraft.
Photographs, plans and construction details are given later in the results section. The Toronto sites, Oakview and Summerhill, were located approximately 6.6 km from end of northern-most east-west runway. All recorded aircraft were taking off towards the west from this runway and passing the north sides of these houses. It was determined that the houses were approximately 1000 m from the flight track of the departing aircraft which passed the houses with an estimated vertical angle of 30 degrees. The approximate location of these two houses and the airport are given in the map of Figure 2.
was fully furnished and both rooms tested were bedrooms on the upper level. Again they were selected because they were simple enclosed spaces with one or more exterior surfaces exposed to the noise of the passing aircraft. A photograph, plans and construction details are included later.
The Brown area house was located 2 km from end of the southern most east-west runway at Vancouver airport. All aircraft recorded were taking off to the east and passing over the north side of the house at a vertical angle of approximately 80 degrees. The map of Figure 3 shows the approximate location of this house.
Figure 2. Map showing the location of the houses Oakview and Summerhill and Toronto Airport.
Airport
Houses
Figure 3. Map showing the location of the Brown area house near Vancouver Airport. House
Airport
Measurements were made of the sound insulation in four offices of a building at Vancouver Airport. The building was a relatively modern building dating from the mid 1970s. It was constructed with concrete exterior wall panels that included fixed heavy double glazing and a concrete roof structure. Two of the offices were on the south wall of the building facing the departing aircraft. The other two offices were on the east side of the building, which was perpendicular to the path of the aircraft. The second floor offices were selected because the ground floor was an open workshop space. More details are provided in the results section.
The Vancouver Airport building that was included in these tests was located
approximately 450 m from the south runway at approximately the point where aircraft were taking off. Thus the vertical angle of the aircraft taking off past this building was approximately 0 degrees.
3. Results
The measurement details and results of each comparison are presented and discussed building by building so that it is easier to keep track of the particular details relevant to each set of results.
3.1 Oakview
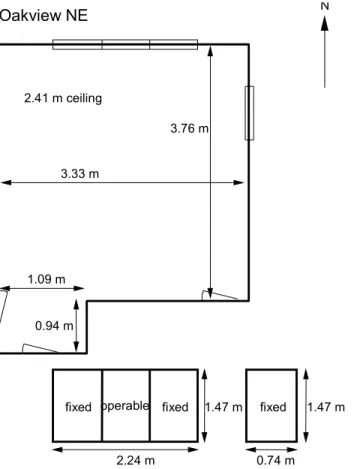
Figure 4 shows a photograph of the north side of the Oakview house including the outdoor free-field microphone. The sound insulation of the two bedrooms on the north side of the house facing the passing aircraft were measured and are referred to as the north-east (NE) and north-west (NW) bedrooms. The plan and construction details of the NE bedroom are given in Figure 6 and Table 1. The corresponding information for the NW bedroom is in Figure 9 and Table 3.
3.1.1 Oakview, North-east Bedroom
The NE bedroom had a large window on the north side facing the passing aircraft and a smaller window on the east side, which was perpendicular to the passing aircraft flight path. However, the east side also faced an adjacent road with significant road traffic. The exterior wall construction was 2” by 6” wood studs with a single layer of gypsum board on the inside and a brick exterior over gyplap sheathing. The ceilings of these upper rooms consisted of a double layer of gypsum board.
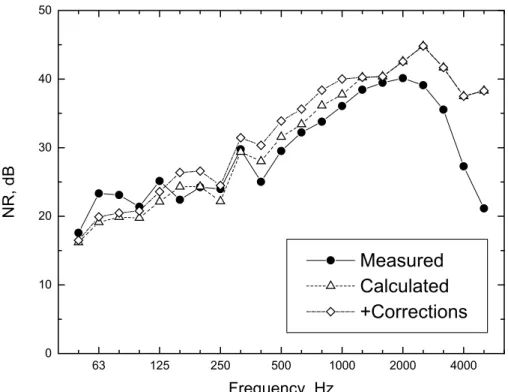
Figure 7 compares measured and predicted noise reductions (NR) for the NE bedroom. Two predicted or calculated results are given, for cases with and without optional corrections. The basic calculations simply take into account the areas and transmission loss values of each façade element. In this case the added corrections included two effects. First, calculations for the north façade were corrected for a 30 degree vertical angle of incidence. Second, the east wall calculations were corrected for the restricted horizontal angular view of the aircraft fly by (i.e. 0 to 90 degrees rather than the complete 180 degrees).
For all of the Toronto area measurements, there were not adequate indoor aircraft noise levels at the highest frequencies (3.1, 4 and 5 kHz). Measured indoor levels included significant levels of other noise sources and so measured attenuations are incorrectly too small. This may extend to the 2 and 2.5 kHz 1/3 octave bands too. Of the two corrections, adding the corrections for the 30 degree vertical angle of incidence to the results for the north façade had the larger effect. Adding the correction for the reduced horizontal view from the east façade had a much smaller effect on the total indoor levels. However, the results in Figure 7 do not clearly demonstrate that the corrections lead to improved agreement between measurement and predictions.
Figure 8 compares the predicted and measured A-weighted sound levels in the NE bedroom of the Oakview house. These show expected indoor levels relative to the predicted outdoor levels. All levels have been A-weighted to approximate their relative perceived importance to listeners. The dominant sound is seen to be centred at 250 Hz and is presumably due to the mass-air-mass resonance of the windows. Conventional double glazing with two layers of 3 mm glass and a 13 mm air space is usually found to
Figure 4. North face of Oakview house near Toronto airport.
Floor area, m2 13.6 m2 Room volume, m3 32.7 m3 Window area, m2 3.29 + 1.09 m2 Average RT, s 0.9 s
Walls Single layer of 13 mm gypsum board on 2” by 6” wood studs, with sheathing, brick exterior and cavity thermal insulation. Windows Vinyl casement, 2 layers 3 mm glass with 13 mm air space. Roof/ceiling Asphalt shingles on wood truss with R40 glass fibre,
Double layer 13 mm gypsum board ceiling.
Floor Hardwood
Other Light weight drapes.
Table 1. Oakview, NE second-floor bedroom.
Oakview NE N 3.76 m 3.33 m 1.09 m 0.94 m 0.74 m 2.24 m 1.47 m 1.47 m fixed operable fixed fixed
2.41 m ceiling
Figure 6. Oakview, plan of NE bedroom and window dimensions. North and east walls were exposed to aircraft noise as well as the roof/ceiling.
63 125 250 500 1000 2000 4000 0 10 20 30 40 50 Measured Calculated +Corrections NR, dB Frequency, Hz
Figure 7. Oakview NE, comparison of measured and calculated noise reductions (NR). ‘Calculated’ indicates simple calculations only; ‘+Corrections’
indicates vertical angle correction for north wall and horizontal angular view correction for east wall are included.
63 125 250 500 1000 2000 4000 0 10 20 30 40 Measured Roof East North Total L e v e l, dBA Frequency, Hz
have a mass-air-mass resonance at about this frequency, which significantly limits the effectiveness of such windows. Figure 8 also illustrates the relative importance of the intruding aircraft sound transmitted through each exterior surface of the room. These results are all for uncorrected calculations because the Figure 7 results did not indicate that the corrections were a significant improvement. The dominant sound path is through the north wall and this path is largely due to transmission through the large window in this wall. The second most important path is through the east wall with its smaller window, which again represents the weak link in that façade. Transmission through the roof is only predicted to be significant at very low frequencies.
Aircraft noise transmission into this room is very much dominated by transmission through the two windows. Any improvements to the sound transmission loss of these windows would significantly reduce indoor sound levels. The sound insulation of the walls and roof/ceiling construction is significantly over-designed relative to the limiting properties of the conventional window designs.
The sound insulation of buildings against exterior noise is often simplified to overall A-weighted noise reductions (NR). These are given for the NE bedroom of the Oakview house in Table 2 above. When the horizontal angular view correction is applied, there is only a very small change. However, applying both the horizontal angular view correction for the east wall and the vertical angle correction for the north façade leads to a larger change. Comparison of the overall A-weighted level reductions in Table 2 and the more detailed results in Figures 7 and 8 indicates the simple A-weighted level reductions are misleading. The A-weighted level reductions suggest that applying both corrections leads to the best agreement. However, the more detailed results help us to understand that this is due to positive errors at one frequency being compensated for by negative errors at other frequencies. NR, dBA difference re measured, dBA Measured 28.2 Simple calculations 26.8 -1.4 Horizontal 0-90, degrees 27.2 -1.0 Vertical 30 + H 0-90 28.9 0.7
Table 2. Measured and predicted A-weighted level differences for Oakview NE bedroom. (“Horizontal 0-90, degrees” includes only the correction for the reduced angular view at the east façade and “Vertical 30 +H 0-90” includes both the horizontal angular view correction and the vertical angle correction for the north façade).
3.1.2 North-west Bedroom
The NW bedroom had a large window on the north side facing the passing aircraft. The west wall was exposed to outdoor sounds but included no windows (see Figures 4 and 9). The exterior wall construction was 2” by 6” wood studs with a single layer of gypsum board on the inside and a brick exterior over gyplap sheathing. The ceilings of these upper rooms consisted of a double layer of gypsum board.
The plan of the room is included in Figure 9 and the construction details in Table 3. The measured and predicted noise reductions for the NW bedroom are compared in Figure 10.
Floor area, m2 14.1 m2 Room volume, m3 34.0 m3 Window area, m2 2.14 m2 Average RT, s 0.7 s
Walls Single layer of 13 mm gypsum board on 2” by 6” wood studs, with sheathing, brick exterior and cavity thermal insulation. Windows Vinyl casement, 2 layers 3 mm glass with 13 mm air space. Roof/ceiling Asphalt shingles on wood truss with R40 glass fibre,
Double layer 13 mm gypsum board ceiling.
Floor Hardwood
Other Light weight drapes.
Table 3. Oakview, NW second-floor bedroom.
Oakview NW N 3.38 m 4.17 m 1.19 m 1.80 m fixed operable fixed
Window
2.41 m ceiling
Figure 9. Oakview, plan of NW bedroom and window dimensions. North and west walls were exposed to aircraft noise as well as the roof/ceiling.
63 125 250 500 1000 2000 4000 0 10 20 30 40 50 Measured Calculated +Corrections NR, dB Frequency, Hz
Figure 10. Oakview NW, comparison of measured and calculated noise reductions (NR). ‘Calculated’ indicates simple calculations only; ‘+Corrections’
indicates vertical angle correction for north wall and horizontal angular view correction for west wall are included.
63 125 250 500 1000 2000 4000 0 10 20 30 40 Measured Roof West North Total L e v e l, dBA Frequency, Hz
Figure 11. Oakview NW, comparison of measured and calculated indoor A-weighted levels. ‘Total’ is total predicted level, ‘Roof’, ‘West’, and ‘North’ are
Again predictions were made for both simple calculations without corrections and also with an added correction. In this case the only correction made was for the 30 degree vertical angle of the incident aircraft noise on the north façade of the room. As in the previous results for the NE bedroom, the measured attenuations are underestimated at high frequencies due to inadequate indoor aircraft sound levels. (That is, the indoor aircraft sound levels were not accurately measurable above other sounds). Agreement between measured and calculated noise reductions without corrections is excellent at most frequencies. The 30 degree vertical angle correction does not improve the agreement between measured and predicted results.
Figure 11 shows the measured and predicted indoor sound levels. Again all results have been A-weighted to indicate their expected subjective importance to indoor listeners. Indoor levels were dominated by aircraft noise transmitted through the north façade and this was largely due to sound transmission through the window. This explains the peak in the indoor sound levels at 250 Hz as again due to the mass-air-mass resonance of the conventional double glazed windows. Sound transmission through the roof and west walls is seen to be only significant at very low frequencies. The overall sound insulation is limited by the use of a conventional window design because the sound energy
transmitted through the window is much greater than through the other surfaces. A significant improvement to the sound insulating properties of the windows would greatly improve the overall effect and would lead to reduced indoor sound levels.
The overall A-weighted level reductions for the Oakview NW bedroom are given in Table 4 below. They indicate a similar magnitude of reductions as found in the NE bedroom of this house but they do not help to understand the details of the comparison of measured and predicted noise reductions.
NR, dBA Difference re measured, dBA
Measured 29.2
Simple calculations 29.6 0.5
Vertical 30, degrees 31.6 2.5
Table 4. Measured and predicted A-weighted level differences for Oakview NW bedroom. (“Vertical 30, degrees” includes the vertical angle correction for the north façade).
3.2 Summerhill
The Summerhill house is shown in the photograph of Figure 5. In it measurements were made in two bedrooms on the north side of the second floor of the building. The rooms were of more complex geometries than those in the Oakview house. The NE bedroom shown in the plan of Figure 12 had a peaked or ‘cathedral’ style ceiling with the north and west facades as well as the roof exposed to aircraft noise. The east wall of the room was not an exterior wall. The NW bedroom had an approximately semicircular exterior wall exposed to the north and to the west as illustrated in the photograph of Figure 5 and the plan of Figure 15. The construction details for each room are given in Tables 5 and 8 and were similar to those for the Oakview house.
63 125 250 500 1000 2000 4000 0 10 20 30 40 50 Measured Calculated +Corrections NR, dB Frequency, Hz
Figure 13. Summerhill NE, comparison of measured and calculated noise reductions (NR). ‘Calculated’ indicates simple calculations only; ‘+Corrections’
indicates vertical angle correction for north wall and horizontal angular view correction for west wall are included.
63 125 250 500 1000 2000 4000 0 10 20 30 40 Measured Roof West North Total L e v e l, dBA Frequency, Hz
Figure 14. Summerhill NE, comparison of measured and calculated indoor
Summerhill NE N
fixed fixed fixed operable
0.74 m 1.19 m 0.74 m 0.28 m 0.43 m Window 3.18 m 3.76 m 4.72 m 0.99 m 1.07 m 1.37 m height 3.35 height 2.67 m height 2.43 2.41 m 2.67 m 3.35 m Room section 1.47 m
Figure 12. Summerhill, plan of NE bedroom and window dimensions. North and west walls were exposed to aircraft noise as well as the roof/ceiling.
Floor area, m2 17,4 m2 Room volume, m3 51.0 m3 Window area, m2 3.92 m2 Average RT, s 0.5 s
Walls Single layer of 13 mm gypsum board on 2” by 6” wood studs, with sheathing, brick exterior and cavity thermal insulation. Windows Vinyl casement, 2 layers of 3 mm glass with 13 mm air space. Roof/ceiling Asphalt shingles on wood truss with R40 glass fibre,
Double layer 13 mm gypsum board ceiling.
Floor Carpet
3.2.1 Summerhill North-east Bedroom
Figure 13 illustrates the comparisons of measured and predicted 1/3 octave band noise reduction values for the NE bedroom of the Summerhill house. Other than the problems at high frequencies (due to inadequate signal-to-noise), the simple calculations agree very well with the measured noise reductions. Again these results do not support the use of the 30 degree vertical angle correction for the north façade of this room.
The predicted and measured indoor sound levels are compared in Figure 14. As in the previous results these indoor levels are A-weighted to represent their relative importance to listeners in this room. Predicted and measured indoor levels agree well and are
dominated by a peak at about 250 Hz. The indoor levels are largely due to sound
transmitted through the north wall and most of this energy entered through the windows. The sound energy transmitted through the west wall and the roof only contributes
significantly to the total at lower frequencies.
Table 6 above gives the overall A-weighted noise reductions for the Summerhill NE bedroom. These results agree with the more detailed results in suggesting that the simple calculations give the best agreement with measured values.
NR, dBA Difference re measured , dBA
Measured 31.3
Simple calculations 31.2 -0.1
V30 and H090 33.3 2.0
Table 6. Measured and predicted A-weighted level differences for Summerhill NE bedroom.
3.2.2 Summerhill North-west Bedroom
The NW Summerhill bedroom is described in the plan of Figure 15 and the construction details of Table 8. Because the exposed exterior wall was curved and hence faced both north and west, no corrections were included in the predicted noise reductions for this room. Figure 16 shows the comparison of measured and predicted noise reductions as a function of 1/3 octave band frequency. Agreement between measured and predicted values is quite good at important mid-frequencies. The measured noise reductions have a significant dip at 250 Hz that is not as large in the predicted values.
Figure 17 shows that the A-weighted indoor levels have a strong peak at this same frequency and that this frequency would be the loudest component of the aircraft noise heard in this room. This has been identified previously as most likely due to the mass-air-mass resonance of the type of windows included in this room and may be a more
important issue in this room because of the orientation of the windows relative to the passing aircraft. Figure 17 also shows that sound transmitted through the roof would only be significant at very low frequencies.
Floor area, m2 14.9 m2 Room volume, m3 35.9 m3 Window area, m2 2.14 Average RT, s 0.4 s
Walls Single layer of 13 mm gypsum board on 2” by 6” wood studs, with sheathing, brick exterior and cavity thermal insulation. Windows Vinyl casement, 2 layers 3 mm glass with 13 mm air space. Roof/ceiling Asphalt shingles on wood truss with R40 glass fibre,
Double layer 13 mm gypsum board ceiling.
Floor Carpet
Other Light weight drapes.
Table 8. Summerhill, NW second-floor bedroom.
Summerhill NW N 3.76 m 3.05 m 2.95 m 2.03 m 1.57 m 0.94 m 2.921 m 0.89 m
0.48 m all five windows have these F F F O O F = fixed O = operable 2.41 m ceiling Windows
Figure 15. Summerhill, plan of NW bedroom and window dimensions. The north and west facing curved wall was exposed to aircraft noise as well as the roof/ceiling.
63 125 250 500 1000 2000 4000 0 10 20 30 40 50 Measured Calculated NR, dB Frequency, Hz
Figure 16. Summerhill NW, comparison of measured and calculated noise reductions (NR). ‘Calculated’ indicates simple calculations only.
63 125 250 500 1000 2000 4000 0 10 20 30 40 Measured Roof West Total L e v e l, dBA Frequency, Hz
Figure 17. Summerhill NW, comparison of measured and calculated indoor A-weighted levels. ‘Total’ is total predicted level, ‘Roof’, and ‘West’ are
predicted levels for transmission through each exterior surface of the room, all without corrections.
NR, dBA Difference re. measured, dBA
Measured 29.7
Simple calculations 32.9 3.2
Table 7. Measured and predicted A-weighted level differences for Summerhill NW bedroom.
Table 7 compares overall A-weighted noise reductions for the Summerhill NW bedroom. The 3.2 dBA prediction error can be explained by reference to Figure 17 as due to the large difference in the measured and predicted indoor levels at 250 Hz.
3.3 Brown Area House
The Brown Area house is shown in the photograph of Figure 18 and in the floor plan of Figure 19. Aircraft passed by the north façade of this house. Sound insulation
measurements were made in the NE and NW bedrooms on the upper floor of the house.
3.3.1 Brown Area House, North-east Bedroom
The NE bedroom floor plan is given in Figure 20 and the construction details are given in Table 9. The north and east walls of the room were exposed to aircraft noise as well as the roof/ceiling. The measured and predicted noise reductions are compared in Figure 21. The simple calculations considered only the areas and transmission loss values of each façade component. The results with corrections include estimates of the reduced
horizontal angular view for the east wall and for the 80 degree vertical angle of incidence for the north wall. As a second step the vertical angle correction was extended to higher frequencies (i.e. 2500 Hz) and the resulting predictions are also included in Figure 21. The results in Figure 21 suggest that the most successful predictions were obtained with the corrections extended to higher frequencies (2.5 kHz rather than 1.25 kHz). The vertical angle correction in the IBANA-Calc software was developed from measurements at a test house at Ottawa airport [2] that suggested that it was not appropriate above 1250 Hz. This empirically derived correction was limited by the range of available conditions found in the Ottawa measurements. The current results suggest that the vertical angle correction could be applied to higher frequencies. For these extended predictions the largest differences between measured and predicted values are at low frequencies. The measured and predicted indoor A-weighted levels are compared in Figure 22. The dominant predicted indoor A-weighted levels occur in a peak at 125 Hz. This peak does not occur in the measured levels. This same difference between predictions (based on laboratory transmission loss measurements) and field measurements was observed in the Ottawa Airport test house. The significant dip at about 125 Hz found in the laboratory tests of many wood stud walls did not occur in the measurements at the test house. This same difference is thought to explain the differences between measured and predicted values in Figure 22.
The measured indoor levels shown in Figure 22 are most influenced by aircraft noise transmitted through the window. Of course, these results do not include a mass-air-mass
aircraft NW Bedroom NE Bedroom Upper floor of 2 story part single story of house Outdoor microphone
N
Figure 19. Plan of Brown area house near Vancouver airport. Figure 18. North face of Brown area house near Vancouver airport.
Floor area, m2 12.71 m2 Room volume, m3 31.01 m3 Window area, m2 1.58 m2 Average RT, s 0.24 s
Walls Single gypsum 13 mm board on 2” by 4” wood studs, stucco exterior and cavity insulation.
Windows Aluminum slider, 1 layer 3 mm glass.
Roof/ceiling Asphalt shingles on wood truss with R20 glass fibre, Single layer 13 mm gypsum board ceiling.
Floor Carpet
Other Bed and other furnishings .
Table 9. Brown area house, north-east second floor bedroom. NE bedroom 3.38 m 1.80 m 3.76 m 2.44 m Bed 1.80 m
Operable Fixed Operable 0.88 m
Window
Figure 20. North-east bedroom of Brown area house near Vancouver airport. North and east walls were exposed to aircraft noise as well as the roof/ceiling.
63 125 250 500 1000 2000 4000 0 10 20 30 40 50 Measured Calculated +Corrections +Higher frequencies NR, dB Frequency, Hz
Figure 21. Brown house NE, comparison of measured and calculated noise reductions (NR). ‘Calculated’ indicates simple calculations only; ‘+Corrections’
indicates vertical angle correction for north wall and horizontal angular view correction for east wall are included.
63 125 250 500 1000 2000 4000 0 10 20 30 40 Measured Roof East North Total L e v e l, dBA Frequency, Hz
Figure 22. Brown house NE, comparison of measured and calculated indoor A-weighted levels. ‘Total’ is total predicted level, ‘Roof’, ‘East’, and ‘North’ are
NR, dBA Difference re. measured, dBA
Measured 31.7
Simple calculations 30.7 -1.0
V80-H090 28.1 -3.5
Table 10. Measured and predicted A-weighted level differences for Brown house NE bedroom. (“V80-H0-90”, indicates predicted results including corrections for the reduced horizontal angular view at the east façade and the 80 degree vertical angle of incidence correction for the north façade).
Table 10 gives the overall A-weighted noise reductions for the NE bedroom of the Brown area house. These results suggest that the simple calculations give the most accurate predictions. However, the more detailed results in Figure 21 suggest that at most frequencies the predictions with added corrections are better. Again the overall A-weighted reductions can be deceptive because they combine positive and negative differences to produce apparent better overall agreement.
3.3.2 Brown Area House, North-east Bedroom
The plans of the NW bedroom of the Brown area house are given in Figure 23 and the construction details are found in Table 11. For this bedroom only the north wall and the roof/ceiling were exposed to aircraft noise. Figure 24 compares measured and predicted noise reductions for the NW bedroom. The results are similar to the NE bedroom in that the predictions with corrections extended to higher frequencies agree best with
measurements at most frequencies. There are again large differences at low frequencies, which are explained as due to the differences in measured transmission loss values at low frequencies between laboratory and field conditions.
Figure 25 compares measured and predicted A-weighted indoor sound levels. The predicted values including corrections (horizontal angular view for the west wall and vertical angle for the north wall) have a large peak at 125 Hz that is not found in the measured levels. This is due to the difference between the laboratory measurements (on which the predictions are based) and field measurements in this low frequency region.
NR, dBA Difference re. measured, dBA
Measured 30.6
Simple calculations 29.8 -0.7
V80 25.6 -5.0
Table 12. Measured and predicted A-weighted level differences for Brown house NW bedroom. (“V80”, indicates predicted results include a correction for the 80 degree vertical angle of incidence correction for the north façade).
The overall A-weighted level reductions for the NW bedroom of the Brown area house are given in Table 12. They indicate that the predictions based on the simple calculations are most accurate. However, examination of the results in Figure 24 and 25, indicate that
Floor area, m2 7.59 m2 Room volume, m3 18.52 m3 Window area, m2 1.58 m2 Average RT, s 0.33 s
Walls Single gypsum 13 mm board on 2” by 4” wood studs, stucco exterior.
Windows Aluminum slider, 1 layer 3 mm glass.
Roof/ceiling Asphalt shingles on wood truss with R20 glass fibre, Single layer 13 mm gypsum board ceiling.
Floor Carpet
Other Upholstered furniture and other furnishings .
Table 11. Brown area house, north-west second floor bedroom. NW bedroom 2.77 m 1.80 m 2.74 m 1.80 m 0.88 m Fixed Operable 2.44 m Window
Figure 23. North-west bedroom of Brown area house near Vancouver airport. North wall and roof/ceiling were exposed to aircraft noise.
63 125 250 500 1000 2000 4000 0 10 20 30 40 50 Measured Corrections +Corrections +Higher frequencies NR, dB Frequency, Hz
Figure 24. Brown house NW, comparison of measured and calculated noise reductions (NR). ‘Calculated’ indicates simple calculations only;
‘+Corrections’ indicates vertical angle correction for north wall is included.
63 125 250 500 1000 2000 4000 0 10 20 30 40 Measured Roof North Total L e v e l, dBA Frequency, Hz
Figure 25. Brown house NW, comparison of measured and calculated indoor A-weighted levels. ‘Total’ is total predicted level, ‘Roof’, and ‘North’ are
Figure 26. South face of Vancouver airport building. VA AM EH MC Outdoor microphone
N
AircraftYVR Building
10 m open office work areacause of the large difference between measured and predicted overall A-weighted noise reductions.
3.4 Vancouver Airport (YVR) Building
The south façade of the Vancouver Airport building is shown in the photograph of Figure 26. The floor plan showing the arrangement of the four offices that were measured is given in Figure 27. Two of the offices, EH and MC, were on the south side of the
building facing the aircraft that were taking off parallel to this façade of the building. The other two offices, VA and AM were on the east side of the building and thus had a
restricted angular view of the aircraft. All windows were nominally identical having fixed double glazing consisting of two layers of 6 mm glass separated by a 13 mm air space. One office (VA) had one window and the others at two windows. Table 13 gives the various areas, room volumes and average reverberation times for the 4 offices.
Office
-
> VA AM EH MCExterior wall East
Perpendicular to flight path. East Perpendicular to flight path. South Parallel to flight path. South Parallel to flight path. Floor area, m2 10.1 14.1 12.1 13.9 Volume, m3 25.6 35.6 30.4 35.1 Window area, m2 2.46 4.86 4.86 4.86 Reverberation time, s 0.22 0.32 0.24 0.28
Table 13. Details of the four offices measured in the Vancouver Airport Building. Predictions were made based on simple calculations of the areas and transmission loss values of the windows and also with a correction for the restricted horizontal angular view of the aircraft from the east-facing offices. Because the calculations included only the area and transmission loss of the windows, they assumed that other transmission paths were negligible. The walls were concrete panels with thermal insulation in the wall cavity and interior gypsum board surfaces. The roof was constructed of large concrete ‘T’-sections with a suspended ceiling below and thermal insulation and roofing membranes on top. It was estimated that the transmission loss values of the wall and roof
constructions were vastly superior to the windows and so neglecting their contribution to the indoor sound levels (in spite of their larger areas) seemed to be an acceptable
assumption. There may, however, have been other flanking paths. The ventilation ducts seemed to be a possible flanking path but no inlets or outlets could be found on the roof of the building or on the sides facing the aircraft.
Figure 28 shows comparisons of measured and predicted noise reductions for the VA office. Both predictions are in approximate agreement with the measured noise
reductions, but the prediction based on simple calculations seems to best fit the measured values. This may not be an indication of the appropriateness of the corrections because the same trend for predicted noise reductions to exceed measured values was found for all
may relate to the effects of possible flanking paths such as via the ventilation system or possibly through the roof and wall structure.
Figure 29 compares measured and predicted indoor A-weighted sound levels for the VA office. The predictions are again in reasonable agreement with measurements with a large peak at 200 Hz. This is presumably the mass-air-mass resonance of the double glazing used in these fixed windows and the frequency of the peak is well predicted from the laboratory data for this type of double glazing.
Table 14 shows the measured and predicted overall A-weighted level reductions for the VA office along with those for the other offices.
NR, dBA Difference re. measured, dBA VA office Measured 38.0 Simple calculations 37.5 -0.6 H 0-90 40.0 2.0 AM office Measured 34.3 Simple calculations 35.2 0.9 H 0-90 36.9 2.6 EH office Measured 33.1 Simple calculations 35.7 2.6 MC office Measured 33.8 Simple calculations 35.7 2.0
Table 14. Measured and predicted A-weighted level differences for the Vancouver Airport building
offices.(“H 0-90” indicates predictions included corrections for the restricted horizontal angular view from the east façade of the building).
The location of the AM office is shown in the floor plan of Figure 27. The related surface areas and room volume are included in Table 13. The measured and predicted noise reductions are plotted in Figure 30. As for the VA office, two predicted results are given. One was for simple calculations based on the areas and transmission loss values of the windows. The second includes corrections for the restricted angular view of the passing aircraft. As in the previous case (office VA), the corrections do not improve the
agreement of predicted values with measurements.
Figure 31 compares measured and predicted indoor A-weighted levels for the AM office. These again show measured and predicted indoor levels to peak at 200 Hz due to the transmission loss characteristics of the double glazed windows. The overall A-weighted noise reductions, shown in Table 14, indicate best agreement for the predictions based on simple calculations. However the differences between the measured and predicted values including corrections (2.0 and 2.6 dBA) are the same as the errors for the other two offices that do not include any corrections. Thus, it may be that the corrections are
63 125 250 500 1000 2000 4000 10 20 30 40 50 60 Measured Calculated +Corrections NR, dB Frequency, Hz
Figure 28. YVR-VA office, comparison of measured and calculated noise reductions (NR). ‘Calculated’ indicates simple calculations only; ‘+Corrections’ indicates horizontal angular view correction for east wall is included.
63 125 250 500 1000 2000 4000 0 10 20 30 40 Measured Calculated +Corrections L e v e l, dBA Frequency, Hz
Figure 29. YVR-VA office, comparison of measured and calculated indoor A-weighted levels. ‘Measured’ is the total measured, ‘Calculated’ is for simple
63 125 250 500 1000 2000 4000 10 20 30 40 50 60 Measured Calculated +Corrections NR, dB Frequency, Hz
Figure 30. YVR-AM office, comparison of measured and calculated noise reductions (NR). ‘Calculated’ indicates simple calculations only; ‘+Corrections’
indicates horizontal angular view correction for east wall is included.
63 125 250 500 1000 2000 4000 0 10 20 30 40 Measured Calculated +Corrections L e v e l, dBA Frequency, Hz
Figure 31. YVR-AM office, comparison of measured and calculated indoor A-weighted levels. ‘Measured’ is the total measured, ‘Calculated’ is for simple calculations, and ‘+Corrections’ includes the horizontal angular view
2.6 dBA. This might be the ventilation system or alternatively transmission through the wall and/or roof construction that is common to all four offices.
The location of the EH office on the south side of the building facing the passing aircraft is shown in the floor plan of Figure 27. The surface areas and room volume are included in Table 13. The measured and predicted noise reductions for this office are given in Figure 32. No corrections were made in making these predictions. Predicted noise
reductions tend to be a little greater than measured values at most frequencies. Again this may be due to considering only transmission through the windows.
Figure 33 compares measured and predicted A-weighted indoor sound levels. These results show a strong peak in the indoor levels at 200 Hz due to the properties of the double-glazing. The peak in the predicted values, based on laboratory measurements, is sharper than the measured results for this office as observed for the other offices. This may be due to differences in damping caused by different mounting of the glass. The overall A-weighted noise reductions shown in Table 14 indicate that measured indoor levels were 2.6 dBA greater than predicted.
The location of the MC office is shown on the floor plan of Figure 27 and as for the previous office is on the south side of the building facing the passing aircraft. The surface areas and room volume are included in Table 14. Figure 34 compares measured and predicted values of noise reductions. The results are very similar to those for the EH office and indicate higher predicted than measured noise reductions at most frequencies. Again this may be due to considering only transmission through the windows.
The comparison of measured and predicted indoor A-weighted levels shown in Figure 35 for the MC office is also similar to that for the previous office. Measured indoor levels tend to be a little greater at most frequencies than predicted values. There is a large peak in measured and predicted values at 200 Hz due to the mass-air-mass of the double glazing used.
The overall A-weighted noise reductions, shown in Table 14, indicate that measured indoor levels were 2.0 dBA greater than predicted levels. This is similar to the results for the other offices if you assume that the with-corrections calculations (horizontal angular view) are most appropriate for the VA and AM offices. Since the only corrections made were for the reduced horizontal angular view from the VA and AM offices on the east side of the building, the corrections seem essential.
As suggested earlier, the similar differences suggest some common sound path that has been ignored in the calculations. This could be transmission through the wall panels, through the roof structure or via the ventilation system. No ventilation system inlets or outlets could be found that would be exposed to aircraft noise but details of the duct system were not available. The sound transmission loss of the wall panels is not known and is not easily estimated. Although the panels were made of concrete they were of varied thickness and included sealed joints between the panel sections. When the differences between measured and predicted indoor levels are calculated for all four offices, very similar difference characteristics result. These indicate that the possible unknown other sound path contributes most in the lower frequencies between 80 and 250
63 125 250 500 1000 2000 4000 10 20 30 40 50 60 Measured Calculated NR, dB Frequency, Hz
Figure 32. YVR-EH office, comparison of measured and calculated noise reductions (NR). ‘Calculated’ indicates simple calculations only.
63 125 250 500 1000 2000 4000 0 10 20 30 40 Measured Calculated L e v e l, dBA Frequency, Hz
Figure33. YVR-EH office, comparison of measured and calculated indoor A-weighted levels using simple calculations.
63 125 250 500 1000 2000 4000 10 20 30 40 50 60 Measured Calculated NR, dB Frequency, Hz
Figure 34. YVR-MC office, comparison of measured and calculated noise reductions (NR). ‘Calculated’ indicates simple calculations only.
63 125 250 500 1000 2000 4000 0 10 20 30 40 Measured Calculated L e v e l, dBA Frequency, Hz
Figure 35. YVR-MC office, comparison of measured and calculated indoor A-weighted levels using simple calculations.
Hz. This might well be due to transmission through the wall or roof panels, but this could only be accurately verified with laboratory measurements of these systems.
4. Discussion
Combining the results from the various test sites identifies several topics where further discussion leads to more general conclusions. In some cases these relate to the more fundamental issues of predicting the sound insulation in situ in buildings exposed to actual aircraft noise from measurements of similar constructions in the laboratory. They also relate to the use of the optional corrections included in the IBANA-Calc software, possible improvements to the software and to more general issues.
4.1 Differences between laboratory and field transmission loss measurements
The results of the comparisons in this report point to two areas where laboratory and field measurements of sound insulation seem to systematically differ. They both relate to lower frequency resonance phenomena that determine sound transmission over a particular narrow range of frequencies. Both the magnitude and width of the resonance dip in the measured noise reductions can vary between laboratory and field conditions. This may be because sound transmission at such resonance frequencies is more strongly dependent on the angle of incidence of the sound than at other frequencies. In the laboratory, sound transmission loss measurements are made with test samples located between two reverberation chambers. These chambers are designed to have diffuse sound fields in which sound would be incident on the test specimens from a wide range of angles. In the field, aircraft noise is incident on each window for a particular more limited range of angles depending on the orientation of the window relative to the aircraft flight path.
One such resonance phenomenon is the mass-air-mass resonance (MAM) of double glazed windows. This is a simple resonance due to the combination of the masses of the two layers of glass and the stiffness of the contained air. Eight of the 10 rooms that were measured had double glazed windows. The four rooms in the Toronto houses had
standard double glazed windows consisting of two layers of 3 mm glass separated by a 13 mm air space with a measured MAM resonance frequency of approximately 250 Hz. The fixed double glazed windows at the Vancouver airport building consisted of two layers of 6 mm glass separated by a 13 mm air space with a measured MAM resonance frequency of approximately 200 Hz in the laboratory measurements. In all cases the overall sound insulation was least effective at this MAM resonance frequency, so that small errors in predicting expected noise reductions at this frequency would significantly affect the overall predicted indoor noise levels.
In three of the four Toronto houses, the windows were a dominant feature of the wall facing the passing aircraft. In the fourth room the windows were in an approximately semicircular exterior wall so that each of the 5 windows was at a different angle relative to the passing aircraft. In the first three cases, the predicted resonance dip was several dB greater in magnitude than in the measured results in the field situations. In the fourth case, where the windows were at various angles relative to the flight track, the measured MAM resonance dip was approximately 7 dB greater than predicted.
In the Vancouver Airport building offices, the measured and predicted noise reductions were again different near the MAM resonance frequency of the windows. For these
windows facing the aircraft, the differences were greater than for the windows in the wall perpendicular to the flight path.
There seems to be considerable evidence that the critical noise reduction of windows at their MAM resonance frequency is different in the field than predicted from laboratory measurements and that these differences vary with the orientation of the window relative to the flight path. It is obviously important to better understand these differences so that more accurate predictions of the sound insulation of windows can be made. This is particularly important because windows are often the weak link in the sound insulation of a building façade and the MAM resonance of the windows leads to the highest levels of transmitted sound.
The other critical resonance phenomenon is the major low frequency resonance of wood stud walls that typically occurs at about 125 Hz. In laboratory measurements [1,10], this resonance usually limits the overall sound insulation of this type of a wall to aircraft noise type sound sources. Measurements at the Ottawa Airport test house showed that these resonance dips were much reduced in the field measurements [2]. The same difference between laboratory and field results is seen in the Brown Area house results. The predicted indoor levels have a strong peak at 125 Hz because of this resonance dip in the laboratory measurements of this wall construction. This is predicted to be the
dominant indoor sound component. The measured indoor levels indicated noise levels at 125 Hz that are more than 10 dB less than predicted and that this is not the dominant sound component. This phenomenon is not evident in the Toronto houses because they all had wood stud walls with brick exteriors that transmitted much less sound energy than those of the Vancouver house.
The results from the Vancouver house and the previous results from the Ottawa Airport test house both indicate large differences between laboratory and field measurements at frequencies near this principal structural resonance of common wood stud walls. These differences may also be related to differences in angles of incidence between laboratory and field situations. Alternatively they may be influenced by the different edge or mounting conditions for the walls that also differ greatly between laboratory and field situations.
Obtaining a better understanding of sound transmission at these two types of low frequency resonance could solve the largest sources of prediction errors for predicting indoor sound levels from aircraft noise.
4.2 Use of optional corrections in IBANA-Calc
The results in this report provide some limited evaluations of the appropriateness of two of the optional corrections included in the IBANA-Calc software. The corrections were empirically derived from a limited range of conditions at the Ottawa Airport test house [2]. Further evaluation is needed to better define their usefulness.
The horizontal angular view correction was used in a number of cases where an exposed exterior wall was perpendicular to the flight path. This seems to be an obviously
justifiable correction and none of the results in this report would contradict its
appropriateness. In the house cases, where there was a wall perpendicular to the flight path, the dominant sound path was through another wall/window. Thus the horizontal
angular view correction only had a small effect on the overall indoor levels. In these cases it is difficult to be sure that the correction is precisely optimum, but there is no indication of substantial errors. The Vancouver airport office sites also support the validity of the horizontal angular view correction but this is partly a circular justification because these results influenced the details of the calculation procedure for this correction that were incorporated in the IBANA-Calc software [2].
The evidence to support the use of the vertical angle correction is more mixed. For the Toronto houses, a 30 degree vertical angle correction was included. This results in a relatively small change but there was not a systematic improvement in the agreement of predictions with measurements when this correction was added. For the Vancouver house tests, an 80 degree vertical angle correction was successfully tried. This resulted in improved agreement between measured and predicted values and would certainly support the appropriateness of this correction. However, it is also possible that in this extreme case with an 80 degree vertical angle, the effective reduction in indoor sound levels is due to the partial screening of the north wall and window of this house by the roof overhang. Perhaps the vertical angle correction is by coincidence approximately correct to explain this other possible phenomenon. With only one measurement site and one such vertical angle it is not possible to determine the more general validity of this correction for other large vertical angles. However, for this one situation there is a strong indication that the correction is approximately the correct magnitude and that it should be extended to higher frequencies than are currently implemented in the software.
At this point the best recommendations to users would be to: (1) continue to use the horizontal angular view correction where appropriate, (2) to use the vertical angle correction for vertical angles greater than 60 degrees (the reference angle for the
correction), and (3) to not use the vertical angle correction for vertical angles less than 60 degrees.
4.3 Changes to IBANA-Calc
The most significant limitation to the IBAN-Calc software is the lack of laboratory data for various constructions. These include older wall constructions, older single glazed windows and various components of commercial and high rise buildings.
Clearly there is also a need to further evaluate the optional corrections for a wider range of conditions than has been possible until now. Because it is difficult to find houses exposed to high levels of aircraft noise, this might be better solved using a helicopter noise source that could be flown by a test house in a controlled manner to create various angles of incidence.
If the differences between laboratory and field measurements of sound transmission at low frequency resonances (as discussed in Section 4.12 above) were better understood, it would be possible to incorporate corrections into the software to account for these differences.
4.4 General problems
higher noise areas close to large airports. Other approaches such as more controlled tests using a helicopter as a noise source could be considered to solve this problem.
5. Conclusions
Even for the more complex situations that were evaluated in this report, the IBANA-Calc software provided surprisingly accurate predictions of the measured noise reductions of buildings exposed to aircraft noise. Where there are larger differences between measured and predicted results, they can be explained as due to a several specific limitations in our knowledge.
In the discussion section (4.2 above), it was concluded that users should apply the horizontal angular view correction for walls and windows with restricted views of the aircraft pass by, and that the vertical angle of incidence correction should be applied for vertical angles greater than the 60 degree reference value. Applying the vertical angle corrections for low vertical angles (~30 degrees) did not provide clear evidence of improved predictions. The various measurement sites included in this report did not provide opportunities to evaluate the appropriateness of the other optional corrections. When the above recommendations are followed the measured and predicted overall A-weighted noise reductions tended to agree quite well. The differences between measured and predicted overall A-weighted noise reductions that were obtained following these recommendations are summarised in Table 15 below.
Site Predicted NR difference re measured NR, dBA Oakview NE -1.0 Oakview NW 0.5 Summerhill NE -0.1 Summerhill NW 3.2 Brown NE -3.5 Brown NW -5.0 YVR-VA 2.0 YVR-AM 2.6 YVR-EH 2.6 YVR-MC 2.0
Table 15. Differences between predicted and measured overall A-weighted noise reductions (NR) from Tables 2, 4, 6, 7, 10, 12 and 14.
For the first three Toronto house results in Table 15, the errors are no more than 1 dBA. In the fourth Toronto house the error is 3.2 dBA due to a large difference in the predicted and measured effect at the MAM resonance of the windows in this nearly semicircular room. The errors are larger (-3.5 and -5.0 dBA) for the two Brown Area house results because of the large differences between laboratory and field measurements of the low frequency resonances in wood stud walls. The errors for the four Vancouver airport offices were 2.0 or 2.6 dBA. These were thought to be largely due to the unknown properties (and hence ignored) of the elements of the construction other than the windows.
Where conditions are more straight-forward and where there are not significant problems with low frequency resonance phenomena, such as in the first three Toronto house cases,