Publisher’s version / Version de l'éditeur:
Vous avez des questions? Nous pouvons vous aider. Pour communiquer directement avec un auteur, consultez la Questions? Contact the NRC Publications Archive team at
PublicationsArchive-ArchivesPublications@nrc-cnrc.gc.ca. If you wish to email the authors directly, please see the first page of the publication for their contact information.
https://publications-cnrc.canada.ca/fra/droits
L’accès à ce site Web et l’utilisation de son contenu sont assujettis aux conditions présentées dans le site LISEZ CES CONDITIONS ATTENTIVEMENT AVANT D’UTILISER CE SITE WEB.
5th Structural Specialty Conference of the Canadian Society for Civil Engineering
[Proceedings], pp. ST-198-1 - ST-198-10, 2004-06-01
READ THESE TERMS AND CONDITIONS CAREFULLY BEFORE USING THIS WEBSITE. https://nrc-publications.canada.ca/eng/copyright
NRC Publications Archive Record / Notice des Archives des publications du CNRC : https://nrc-publications.canada.ca/eng/view/object/?id=4f079197-ccf4-40cf-b682-53b634eb610a https://publications-cnrc.canada.ca/fra/voir/objet/?id=4f079197-ccf4-40cf-b682-53b634eb610a
NRC Publications Archive
Archives des publications du CNRC
This publication could be one of several versions: author’s original, accepted manuscript or the publisher’s version. / La version de cette publication peut être l’une des suivantes : la version prépublication de l’auteur, la version acceptée du manuscrit ou la version de l’éditeur.
Access and use of this website and the material on it are subject to the Terms and Conditions set forth at
Field performance monitoring and evaluation of concrete repair
systems on a highway bridge
Field performance monitoring and evaluation of concrete repair
systems on a highway bridge
Cusson, D.; Hoogeveen, T.; Qian, S.
NRCC-46967
A version of this document is published in / Une version de ce document se trouve dans :
5
thStructural Specialty Conference of the Canadian Society for Civil Engineering,
Saskatoon, Saskatchewan, June 2-5, 2004, pp. ST-198-1 – ST-198-10
FIELD PERFORMANCE MONITORING AND EVALUATION OF
CONCRETE REPAIR SYSTEMS ON A HIGHWAY BRIDGE
D. Cusson, T. Hoogeveen and S. Qian National Research Council, Ottawa, Canada
ABSTRACT: The Institute for Research in Construction (IRC) and the Ministry of Transportation of
Ontario (MTO) formed a partnership in 1999 with five suppliers of concrete repair systems to evaluate their long-term performance under field conditions. The fieldwork consisted of repairing corrosion-damaged barrier walls of a highway bridge using seven different concrete repair systems, and installing embedded instrumentation for their continuous monitoring. The field performance of the repaired barrier walls was evaluated for 3 years in two different ways: (i) in-situ non-destructive evaluation methods, and (ii) remote monitoring with embedded sensors. In this paper, only the results of the remote monitoring are presented and discussed. It was found that corrosion of the reinforcement in the repaired concrete barrier walls can be delayed by the use of proprietary repair systems.
1. INTRODUCTION
Numerous laboratory studies have been conducted to determine the performance of repair concretes (Emberson and May 1990), however, significant discrepancies between laboratory results and field performance of concrete repairs in concrete highway structures are frequently observed (Gulis et al. 1998). Field performance is the governing criterion for the selection of concrete patching systems for repair; however, the lack of representative data and suitable guidelines makes the selection process difficult. Field trials, from which selection of repair systems, construction procedures and durability of repairs can be evaluated, are therefore necessary.
The Institute for Research in Construction (IRC) and the Ministry of Transportation of Ontario (MTO) established a partnership in 1999 with five suppliers of concrete repair systems to evaluate their long-term performance under field conditions. The fieldwork consisted of repairing the 24-year old corrosion-damaged concrete barrier walls of a highway bridge near Renfrew (Ontario) using six different concrete repair systems, and installing embedded instrumentation in seven test sections of the South barrier wall for continuous monitoring. Two distinct methods were used to assess the field performance of the repaired walls over a 3-year period. The first method included non-destructive condition surveys for corrosion, cracking and delamination conducted twice yearly by the MTO team over the entire surface of the barrier walls. The second method consisted of remotely monitoring the performance of the repaired walls using embedded sensors installed by the NRC team in the concrete patches and substrate concrete. Key parameters such as temperature, relative humidity, electrochemical potential, electrical resistance and mechanical strain were recorded twice daily at selected locations in the barrier walls. Only the results of the remote monitoring with embedded instrumentation will be presented and discussed in this paper.
2. DESCRIPTION OF BRIDGE STRUCTURE AND CONCRETE REPAIR SYSTEMS
The concrete structure selected for the study was a 2-lane, 3-span, 60-m long concrete deck bridge. The bridge, owned by the MTO, is located on Hwy 17, east of Renfrew, Ontario, and was built in 1975. Because of easy access during the repair and monitoring phases, the direct exposure to de-icing salts and the extent of corrosion damage, the barrier walls were selected for the application of concrete repair systems and in-situ evaluation. The extent of concrete deterioration due to chloride contamination and resulting reinforcement corrosion were representative of many highway structures exposed to typical environmental conditions in Ontario.
The barrier wall on each side of the deck consists of ten 6-m long sections separated by control joints. The barrier wall is 800 mm high, and has a thickness varying along the height from 250 to 450 mm. Its reinforcement consists of 20-mm uncoated black steel reinforcing bars. The average thickness of concrete cover to the reinforcement was measured to be 40 mm. The repair work consisted of the removal of deteriorated concrete and appropriate surface preparation by MTO, and the application and curing of the concrete repair systems by the suppliers in the test sections and by MTO in the control section. Table 1 describes the concrete repair systems evaluated, and provides laboratory results from field-cast cylinders tested at 28 days. In each of the 7 test sections selected on the South barrier wall, one of the patches and its surrounding area were instrumented with different embedded sensors. More information on the repair and monitoring strategies used, the location and description of the embedded instrumentation, and the testing program conducted during this study can be found elsewhere (Cusson et al. 2000).
Table 1: Generic Description of the Concrete Repair Systems Evaluated
Repair System Code # Generic Description ASTM C39 Compressive Strength (MPa) ASTM C666 Freeze-thaw Resistance (% length ch.) CRD C163 Water Permeability (10-12 m/s)
Ctl - conventional repair concrete (control) 31 0.02 2.4
2 - rebar coating
- proprietary repair concrete
- post-treatment with water-based coating
36 0.87 62
3 - proprietary air-entrained self levelling concrete 46 0.01 ≈ 0
5,12 - pre-treatment with corrosion inhibitor
- proprietary repair concrete incl. corr. inhibitor - post-treatment with corr. inhibitor
51 0.04 ≈ 0
6 - rebar coating
- proprietary repair concrete - curing agent
46 0.02 ≈ 0
10 - rebar coating
- proprietary repair mortar incl. corr. inhibitor - post-treatment with penetrating corr. inhibitor
25 0.01 170
3. ANALYSIS OF FIELD DATA
Key parameters such as temperature, relative humidity, electrochemical potential, electrical resistance and mechanical strain were recorded twice daily in the instrumented sections of the South barrier wall of the bridge during the last 3 years. The data are presented as monthly averages over a 3-year period. This has the effect of smoothing the curves by eliminating the daily variations, and instead focusing on the longer-term seasonal fluctuations of the various parameters.
3.1 Assessment of Environmental Conditions
Temperature influences all processes involved in corrosion. A two-fold higher corrosion rate can be caused by a 10°C increase in temperature (Shiessl and Raupach, 1990). Moreover, the moisture level in concrete also influences reinforcement corrosion as it affects the rate of carbonation, chloride penetration, electrical resistivity, and availability of oxygen. It is therefore important to have adequate information on the prevailing environmental conditions. This information ensures adequate analysis of the parameters that govern the performance of barrier walls, such as corrosion potential, electrical resistivity, strain, etc. 3.1.1 Temperature
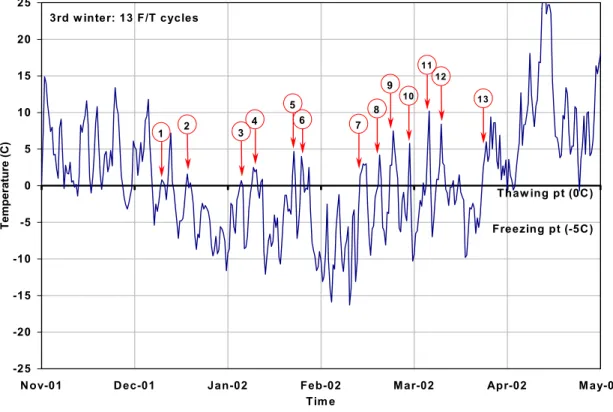
The temperature measured in the concrete displayed a seasonal pattern between –20°C and +30°C. No significant temperature differences were observed between different test sections at any given time. Daily temperature fluctuations of up to 10°C were recorded in the concrete. The concrete temperature data were also used to estimate the number of freeze/thaw (F/T) cycles that occurred in the concrete barrier wall during the 3 winters of the project. Assuming that capillary water in conventional concrete freezes at about -5°C (Neville, 1996) and thaws at 0°C, it was estimated that 7, 8, and 13 freeze/thaw cycles occurred annually in the barrier wall during the three winter periods, respectively. Figure 1 shows such estimation for the 3rd winter. Based on this limited information and assuming similar trends in ambient temperature, the repaired barrier walls would experience 300 F/T cycles over 32 years. It is important to note that uncontrolled freeze-thaw cycles measured in the field cannot be compared directly to the controlled F/T cycles measured in the laboratory (ASTM C666), as there are significant differences in the range and rate of temperature changes.
-25 -20 -15 -10 -5 0 5 10 15 20 25
N ov-01 D ec-01 Jan-02 Feb-02 M ar-02 Apr-02 M ay-02
Tim e Temperature (C) 3rd w inter: 13 F/T cycles Thaw ing pt (0C ) Freezing pt (-5C ) 1 2 3 4 5 6 7 8 9 10 11 13 12
3.1.2 Relative Humidity
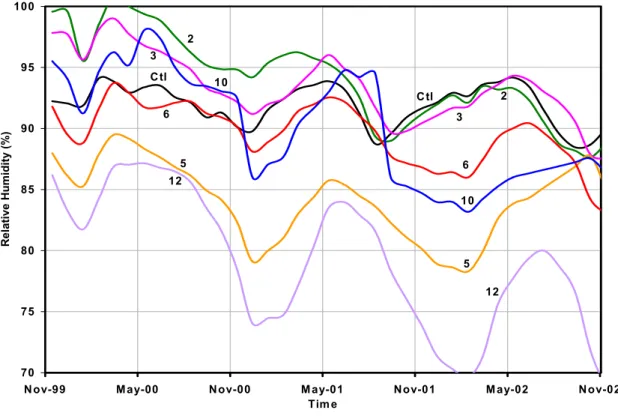
Measured values of relative humidity (RH) are affected by daily and seasonal temperature cycles. In order to remove the effect of temperature on RH, the measured RH was normalized according to a procedure suggested by Pruckner and Gjorv (2001). Figure 2 presents the monthly average of RH measured in the concrete patches. As shown, the concrete RH decreased in all sections from Nov. 1999 to Nov. 2002, showing a typical seasonal trend. The highest concrete RH values were measured typically in the months of May-June. Two trends are observed: (i) Sections 2, 3, 6, 10 and the control section displayed higher RH values decreasing from 90-100% in Nov. 1999 to 85-90% in Nov. 2002; (2) Sections 5 and 12 displayed lower RH values decreasing from 85-90% in Nov. 1999 to 75-80% in Nov. 2002. This observation is confirmed with the measurements of electrical resistivity. The low RH in the patch of Sections 5 and 12 could be the result of significant internal drying (perhaps due to low w/c ratio) combined with very low permeability. The lab results (Table 1) are in line with this assumption.
70 75 80 85 90 95 100
N ov-99 M ay-00 N ov-00 M ay-01 Nov-01 M ay-02 N ov-02
Tim e R e lative H u mid ity (%) C tl C tl 12 5 5 12 6 6 2 2 3 3 10 10
Figure 2. Monthly average of relative humidity in concrete patches
It is usually accepted that the corrosion rate of the reinforcement is small in dry concrete (RH < 70%), or in fully saturated concrete due to low oxygen concentration at the steel-concrete interface. The reinforcement in concrete with partially saturated pores (75% < RH < 95%) is most vulnerable to corrosion, since oxygen and water are present in sufficient quantities. In this study, the RH measured in the concrete of all sections were in the critical range of 75-95% for long periods of time.
3.2 Assessment of Corrosion Progress
The progress of corrosion was assessed by three main sets of measurements: variations in time of half-cell potential and electrical resistivity at a given location, which provide an indication of the risk of corrosion; and differences in half-cell potential between the patches and their surrounding substrate at a given time, which provide an indication of macro-cell corrosion.
3.2.1 Electrochemical Potential
A set of four manganese dioxide (MnO2) electrodes, installed in the repair concrete and its surrounding
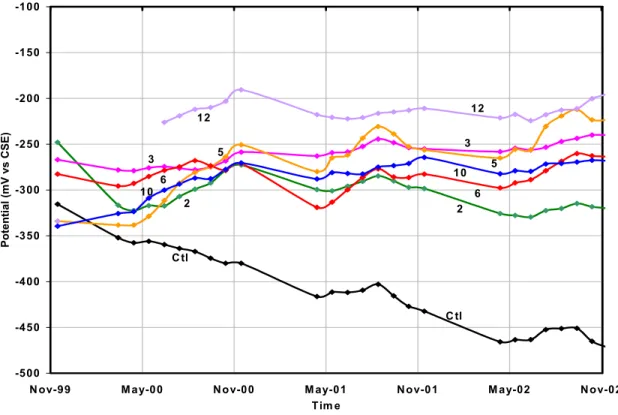
area, provided a profile of half-cell potential along the length of a reinforcing bar, indicating whether a potential gradient was forming in the repaired area and its surrounding (RE1 and RE2 in the substrate; RE3 and RE4 in the patch). These reference electrodes were calibrated annually with external copper sulphate electrodes (CSE) to compensate for any potential shift that might occur. Figure 3 shows the monthly average of the corrosion potential measured in the patch at electrode RE4 over the 3-year period. The monthly averages of potential for the cold winter months were not included in the figure, because the potential readings were substantially disturbed due to the frozen electrolyte in the concrete pores. A linear interpolation was therefore used in Figure 3 between the remaining monthly averages, removing the undesired effect of freezing on the corrosion potential.
-500 -450 -400 -350 -300 -250 -200 -150 -100
N ov-99 M ay-00 N ov-00 M ay-01 N ov-01 M ay-02 N ov-02
Tim e Potential (mV vs C SE) C tl C tl 12 5 5 12 6 6 2 2 3 3 10 10
Figure 3. Monthly average of corrosion potential in concrete patches (RE4)
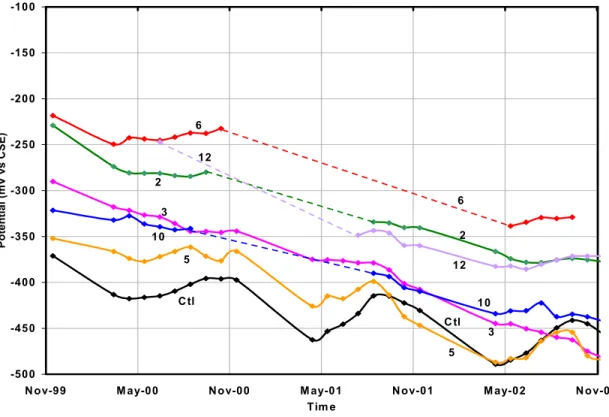
As can be seen in Figure 3, the corrosion potential in the control section shifted substantially towards more negative values, from -320 mV in Nov. 1999 to -470 mV three years later. In all other sections, the corrosion potential remained virtually unchanged with values between -200 mV and -350 mV, a range indicating that corrosion is uncertain. This was most likely the effect of rebar passivation in the patch due to the high alkalinity of the repair concrete. In that regard, there was higher risk of corrosion in the patch of the control section than in the patch of the other sections, in which the concrete density and/or corrosion inhibiting ability seemed to reduce the risk of corrosion. Figure 4 presents the monthly average of the corrosion potential measured in the substrate at electrode RE1 over the 3-year period. The curves clearly show that the corrosion potentials of the substrate in all test sections significantly shifted towards more negative values (by more than 100 mV) from Nov. 1999 to Nov. 2002.
-500 -450 -400 -350 -300 -250 -200 -150 -100
N ov-99 M ay-00 N ov-00 M ay-01 N ov-01 M ay-02 N ov-02
Tim e Potential (mV vs CSE) C tl 12 5 6 2 3 10 6 12 2 3 10 5 C tl
Figure 4. Monthly average of corrosion potential in concrete substrates (RE1)
When a concrete patch is installed on a chloride-contaminated concrete substrate, the reinforcement corrosion potential will become less negative in the patch and more negative in the nearby substrate due to the difference in chloride content. As a result, the reinforcing steel in the patch acts as a cathode, and the steel in the substrate acts as an anode, causing macro-cell corrosion. Therefore, the difference between the potential in the patch and that in the surrounding substrate represents the driving force for macro-cell corrosion. The results in Figures 3 and 4 reveal two trends. The first trend is represented by the control section with potential shifts of 150 mV towards more negative values in the patch, combined with a negligible difference in corrosion potential between the patch and substrate. This translates into an increased risk of corrosion in both the repair and its surrounding substrate. The second trend is represented by all other test sections with a stable corrosion potential in the patch, combined with an increasing difference in corrosion potential between the patch and substrate. Although the patch may not corrode in the short term, it seems that the risk of corrosion in the surrounding concrete will increase over time.
3.2.2 Electrical Resistivity
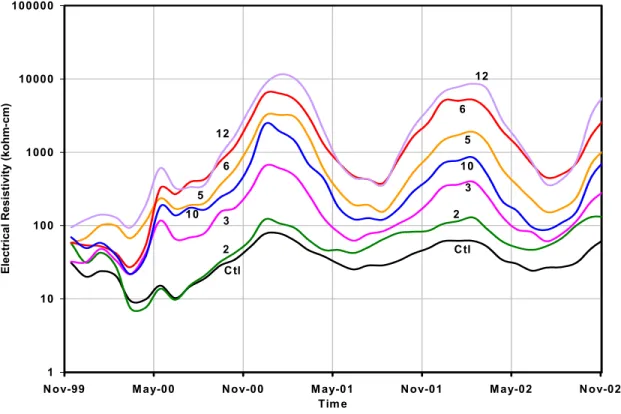
In general, the larger the electrical resistivity of the concrete, the smaller the reinforcement corrosion rate. The embedded probes installed in the patch and substrate concretes measure electrical resistance in ohms (Ω). Based on a special calibration procedure, these resistance values were converted into resistivity values, in Ω-cm, in order to get meaningful comparisons. Figure 5 presents the monthly average of electrical resistivity for the monitored concrete patches in the barrier wall. Values of electrical resistivity ranged from 10 kΩ-cm to 10,000 kΩ-cm depending on the environmental conditions at the time, and the repaired sections monitored. Considering that dry conventional concrete has a known electrical resistivity close to 1,000 kΩ-cm, values as high 10,000 kΩ-cm seem reasonable for high-density, low permeability repair concrete in dry conditions. The trends observed for electrical resistivity are in agreement with the measured RH values (but inversely proportional). Due to continuous drying, an overall increase in electrical resistivity by almost an order of magnitude is observed from Nov. 1999 to Nov. 2002,
corresponding to an overall decrease of approximately 10 % in RH for the same period. The concrete patches in Sections 2 and the control section have the lowest resistivity values overall (and highest RH values), while in Sections 5 and 12, they have the highest resistivity values overall (and lowest RH values). A wide seasonal variation of resistivity is also observed, with high resistivity corresponding exactly to low RH and low temperature measured in the winter time. This wide variation of resistivity is explained by the significant effect of temperature and RH on the electrical resistivity of concrete, especially during winter when the electrolyte in the concrete pores is frozen leading to very high values of concrete resistivity. Typical values reported in the literature may not match these high seasonal fluctuations since field surveys are usually not conducted under freezing temperatures.
1 10 100 1000 10000 100000
N ov-99 M ay-00 N ov-00 M ay-01 N ov-01 M ay-02 N ov-02
Tim e E lectrical R esistivity (ko h m -cm) C tl 12 5 6 2 3 10 12 6 10 3 2 C tl 5
Figure 5. Monthly average of electrical resistivity in concrete patches
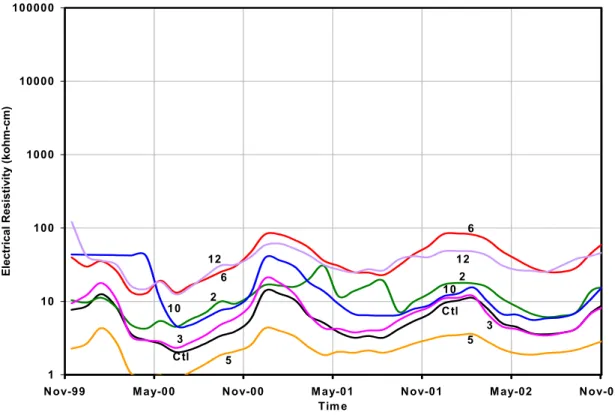
Figure 6 illustrates the monthly average of electrical resistivity of the concrete substrate in different sections. The values ranged from 1 kΩ-cm to 100 kΩ-cm depending on salt content and the environmental conditions at the time considered. As expected, the resistivity and its variation in the substrate between different sections are smaller than for the concrete patches. The narrow range of values is explained by the fact that the substrate concrete in the different sections has the same mix design. The low values may be related to the high porosity and high de-icing salt content of the substrate, which was placed in 1975. A comparison between Figures 5 and 6 shows that all concrete patches have higher resistivity values than their surrounding substrate concrete at all times. This is attributed to lower porosity and lower de-icing salt content of the patches compared to the substrate concrete. Figures 5 and 6 also reveal that the seasonal variations of electrical resistivity are more pronounced in the concrete patches than in the substrate (same trend in RH data). Electrical resistivity, although influenced by RH and temperature, is also affected by the amount of chlorides in the pore solution of the concrete. The high chloride content in the substrate leads to a decrease in the overall resistivity and also its seasonal variation from summer to winter periods. To explain this last finding, one has to consider these facts: (i) frozen water in the concrete pores significantly increases the concrete electrical resistivity, and (ii) chloride-contaminated concrete has a lower freezing point, and may not freeze entirely. This would explain why the substrate concrete displayed lower peaks
1 10 100 1000 10000 100000
N ov-99 M ay-00 N ov-00 M ay-01 N ov-01 M ay-02 N ov-02
Tim e El ect ri cal Resi st iv it y ( k ohm-c m) 12 6 10 3 2 C tl 5 12 6 2 10 C tl 5 3
Figure 6. Monthly average of electrical resistivity in concrete substrates
3.3 Assessment of Volume Stability
Volume stability was assessed with different types of strain gauges embedded in the concrete barrier wall. Vertical transverse cracking was detected by horizontal strain gauges installed on the longitudinal reinforcement of the barrier wall. Delamination of the repair concrete was detected by short horizontal strain gauge units embedded in the repair concrete in the transverse direction (i.e. perpendicular to the main interface with the substrate).
The measurements for each test section confirm that the main component of the total strain in the long term is the thermal strain. In the transverse direction, no sudden deviations from the thermal strain expected in the patches were observed. It may be concluded that no delaminations had formed in any of the instrumented patches between 1999 and 2002. In the longitudinal direction, however, sharp deviations from the expected thermal strain were observed in many patches, indicating vertical cracking in the control section (Dec. 2000), Section 12 (July 2001), Section 5 (Dec. 2001), Section 6 (April 2002) and Section 2 (August 2002).
4. OVERALL PERFORMANCE EVALUATION OF REPAIR SYSTEMS
The durability of a repaired concrete structure will ultimately depend on the ability of a repair system to perform under the environmental conditions and agents that interact with each other. In order to assess the overall performance of the repair systems in delaying corrosion, a practical approach was developed. Three representative sets of corrosion-related field measurements were selected. For each selected set of measurements, the repair systems were given a score of 2 (excellent performance), 1 (acceptable performance) or 0 (poor performance). To determine the overall performance of each repair system in the field, its individual scores from the selected tests were added together, assuming equal weights for all measurements. As a result, a repair system with a high score is considered to be very effective.
4.1 Performance Criteria Used
Half-cell potential: To assess the risk of corrosion of the patch, the change in half-cell potential in the
patch from Nov. 1999 to Nov. 2002 was calculated. A positive change was given a score of 2 (very low risk of corrosion). A negative change smaller than 150 mV was given a score of 1 (low to moderate risk of corrosion), and a negative change larger than 150 mV was given a score of 0 (high risk of corrosion). The threshold value of 150 mV was taken from the ASTM C876 Standard, where it is the difference between 350 mV (90% probability of corrosion) and 200 mV (10% probability of corrosion). Note that the change in potential may also be affected by the oxygen concentration in the patch, which is difficult to assess.
Potential difference: To assess the macro-cell corrosion around the patch, the difference in half-cell
potential between the patch and substrate was calculated at an age of approximately 3 years (Sept. 2002). A value smaller than 100 mV was given a score of 2 (low macro-cell corrosion), a value between 100 mV and 150 mV was given a score of 1 (moderate macro-cell corrosion), and a value larger than 150 mV was given a score of 0 (excessive macro-cell corrosion).
Electrical resistivity: To assess the risk of corrosion of the patch, the value of electrical resistivity in the
patch measured near the end of the 3-year project was used (Sept. 2002, with a monthly average temperature of 20°C). A value greater than 20 kΩ-cm was given a score of 2 (low risk of corrosion), a value between 10 kΩ-cm and 20 kΩ-cm was given a score of 1 (moderate risk of corrosion), and a value smaller than 10 kΩ-cm was given a score of 0 (high risk of corrosion). These threshold values were taken from Bungey (1989).
4.2 Overall Performance in Delaying Corrosion
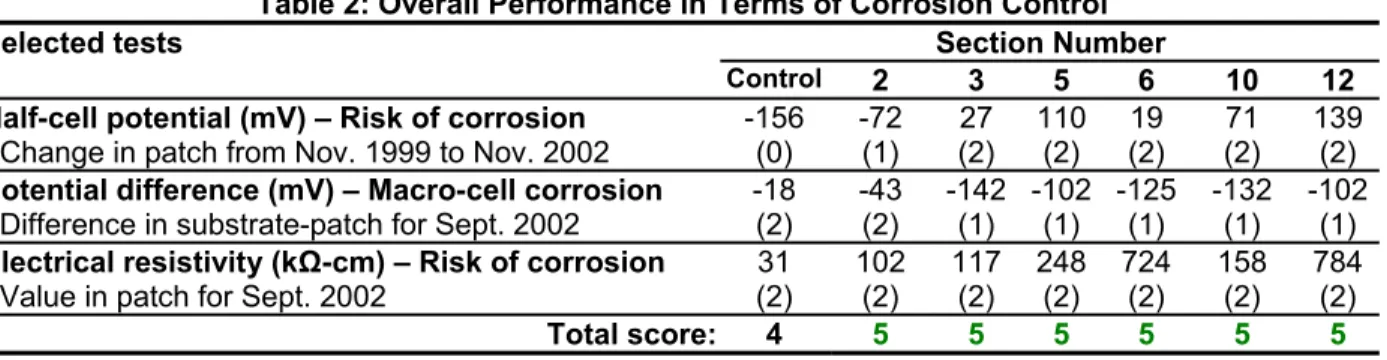
The results of the selected field tests are presented in Table 2 for each repair system, along with their respective scores (placed in parentheses underneath each test result).
Table 2: Overall Performance in Terms of Corrosion Control Section Number Selected tests
Control 2 3 5 6 10 12
Half-cell potential (mV) – Risk of corrosion
- Change in patch from Nov. 1999 to Nov. 2002
-156 (0) -72 (1) 27 (2) 110 (2) 19 (2) 71 (2) 139 (2)
Potential difference (mV) – Macro-cell corrosion
- Difference in substrate-patch for Sept. 2002
-18 (2) -43 (2) -142 (1) -102 (1) -125 (1) -132 (1) -102 (1)
Electrical resistivity (kΩ-cm) – Risk of corrosion
- Value in patch for Sept. 2002
31 (2) 102 (2) 117 (2) 248 (2) 724 (2) 158 (2) 784 (2) Total score: 4 5 5 5 5 5 5
In terms of corrosion control, field monitoring of half-cell potential and electrical resistivity indicated that all proprietary repair systems performed better than the repair concrete of the control section, after 3 years of monitoring. Overall, all repair systems performed similarly (same total scores). It is possible though, that the repair concretes with the highest values of electrical resistivity will have a lower risk of corrosion in the patch reinforcement in the future.
5. CONCLUSIONS AND RECOMMENDATIONS
The proprietary repair systems were subjected to harsh environmental conditions, including annual temperature fluctuations from -20°C to +30°C, numerous freeze-thaw and wet-dry cycles, de-icing salt contamination and traffic-induced vibration over a period of three years. The main conclusions from the analysis of the data obtained by remote monitoring can be summarised as follows:
1. The use of remote monitoring with different types of sensors embedded in the concrete repair systems and their surrounding areas for performance evaluation proved successful. Remote monitoring provided reliable and timely data for performance evaluation.
2. The corrosion potential indicated that increasing macro-cell corrosion occurred in all test sections, except the control section in which no effect was seen after 3 years. Two trends were observed: (1) the control section has a time-increasing risk of corrosion in both the patch and its surrounding substrate; and (2) all other test sections have a time-increasing risk of corrosion in the substrate concrete.
3. The electrical resistivity in the patch increased by an order of magnitude in all test sections from 1999 to 2002 due to overall drying – an advantage for keeping the corrosion current low. In each test section, the resistivity measured in the substrate was significantly lower than the resistivity of the patch, due to higher porosity and salt content in the substrate. It was also found that patches with an electrical resistivity higher than that of the substrate had lower probability of developing reinforcement corrosion in the patch area, but had similar risk of corrosion in the surrounding substrate.
4. In terms of corrosion control, the field monitoring indicated that all proprietary repair systems performed better than the repair concrete of the control section, after 3 years of monitoring. Although shrinkage cracking was detected in most patches, no signs of delamination were found.
5. A three-year period of evaluation allowed for the observation of initial changes and certain trends in the performance of proprietary and conventional repair systems of the bridge barrier walls. A longer period of time, however, is necessary to confirm the above conclusions.
As a recommendation, the measured performance results indicated that a concrete repair system with a low water permeability, high electrical resistivity, and high tensile strength is likely to perform well in delaying reinforcement corrosion and concrete spalling, provided that shrinkage cracking is prevented.
6. ACKNOWLEDGMENTS
The authors acknowledge the close collaboration of the following project partners: MTO’s Materials Engineering and Research Office, MTO’s Eastern Region; Roger Willoughby of NRC’s Industrial Research Assistance Program; and Noel Mailvaganam of NRC’s Institute for Research in Construction. The financial support from Axim Concrete Technologies, King Packaged Materials, Master Builders Technologies, Sika Canada, Silcrete Technologies and The Regional Municipality of Peel is also thankfully acknowledged.
7. REFERENCES
Bungey, J.H. 1989. The Testing of Concrete in Structures, 2nd ed., Chapman and Hall, New York, USA. Cusson, D., Hoogeveen, T., Repette, W., Qian, S., Berszakiewicz, B., Pianca, F., Willoughby, R.,
Mailvaganam, N. 2000. Remote Monitoring of Concrete Repairs on a Highway Bridge, 28th Annual Conference of the CSCE, London, Canada, 8p.
Emberson, N.K., Mays, G.C. 1990. Significance of Property Mismatch in the Patch Repair of Structural Concrete Part 1: Properties of Repair Systems, Magazine of Concrete Research, 42(152), 147-160. Gulis, E.W., Lai, D., Tharambala, B. 1998. Performance and Cost Effectiveness of Substructure
Rehabilitation/Repair Strategies - Draft Report, Ministry of Transportation, Ontario, Canada.
Neville, A.M. 1996. Properties of concrete, 4th ed., Longman Group Limited, Essex, England.
Pruckner, F., Gjorv, O.E. 2001. Measurements of Relative Humidity in Concrete, 3rd Int. Conf. on Concrete Under Severe Conditions, Ed.: N. Banthia, K. Sakai & O.E. Gjorv, Vancouver, Canada, 1489-1496.
Shiessl, P., Raupach, M. 1990. Influence of Concrete Composition and Microclimate on the Critical Chloride Content in Concrete, In: Corrosion of Reinforcement in Concrete, Ed.: C.L. Page, K.W.J. Treadaway, & P.B. Bamforth, Society of Chemical Industry, Elsevier Applied Science, London, England, 49-58.