HAL Id: hal-00921305
https://hal.archives-ouvertes.fr/hal-00921305
Submitted on 20 Dec 2013HAL is a multi-disciplinary open access archive for the deposit and dissemination of sci-entific research documents, whether they are pub-lished or not. The documents may come from teaching and research institutions in France or abroad, or from public or private research centers.
L’archive ouverte pluridisciplinaire HAL, est destinée au dépôt et à la diffusion de documents scientifiques de niveau recherche, publiés ou non, émanant des établissements d’enseignement et de recherche français ou étrangers, des laboratoires publics ou privés.
Modelling of the dense fluidized bed of very small
particles
Pascal Fede, Renaud Ansart, Olivier Simonin, S. Lagarde, Isabelle Ronga
To cite this version:
Pascal Fede, Renaud Ansart, Olivier Simonin, S. Lagarde, Isabelle Ronga. Modelling of the dense fluidized bed of very small particles. 8th International Conference on Multiphase Flow - ICMF 2013, May 2013, Jeju, South Korea. pp. 1-8. �hal-00921305�
O
pen
A
rchive
T
OULOUSE
A
rchive
O
uverte (
OATAO
)
OATAO is an open access repository that collects the work of Toulouse researchers and
makes it freely available over the web where possible.
This is an author-deposited version published in :
http://oatao.univ-toulouse.fr/
Eprints ID : 10526
To cite this version : Fede, Pascal and Ansart, Renaud and Simonin,
Olivier and Lagarde, S. and Ronga, Isabelle. Modelling of the dense fluidized
bed of very small particles. (2013) In: 8th International Conference on
Multiphase Flow - ICMF 2013, 26 May 2013 - 31 May 2013 (Jeju, Korea,
Republic Of).
Any correspondance concerning this service should be sent to the repository
administrator:
[email protected]
81h International Conference on Multiphase Flow
ICMF 2013, Jeju, Korea, May 26-31, 2013
Modelling of the dense fluidized bed of very small particles
P. Fede1•2, R. Ansad, O. Simonin1•2, S. Lagarde4, 1. Ronga4 1
Université de Toulouse; INPT, UPS; IMFT; 31400 Toulouse, France 2
CNRS; Institut de Mécanique des Fluides de Toulouse; 31400 Toulouse, France 3
Université de Toulouse; INPT, UPS; LGC; 31400 Toulouse, France
4AREVA- CEZUS, 291 Route de l'Electro-Chimie, 38560 Jarrie, France
pascal. fede@imft.
fr
Keywords: Two-fluid model, Fluidized bed, LES
Abstract
N owadays the numerical simulation of a fluidized bed made of particles with a very small diameter (about a few microns) is challenging. Recently it has identified that the bad predictions of such fluidized bed come essentially from the using of unadapted grids, generally too coarse. A coarse grid is unable for capturing very small structures of solid appearing in such fluidized bed. For performing numerical simulation with reasonable grid in terms cell size and, consequently, in terms of cell number it is possible to use a subgrid model for representing the effect of small structure on the large scale particle motion. In the present study we propose a posteriori test of a subgrid model for the drag in the case of 3-dimensional numerical simulation of an isothermal fluidized bed. The numerical predictions are compared with pressure drop. The sensitivity with respect to the model constant is check as well as the effect of boundary condition for the solid phase. The results show that without the subgrid model ali particles are entrained and the fluidized becomes empty. In contrast, with the subgrid model, the behaviour of a classical dense fluidized bed is observed.
Introduction
Dense fluidized beds are used in a wide range of industrial process as for examples for the combustion of biomass, polymerization of olefin, or fluorination of uranium. Sorne of these processes involve particles having a very small diameter (about a few microns).
Several approaches exist for the numerical simulation of particulate flows but due to the huge number of particles and the complexity of the geometry of industrial applications the Euler-Euler multi-fluid approach is commonly used. However it as been shown that for sorne type of particles (typically Geldart A type particle or very small particles) the Euler-Euler multi-fluid approach fails (Agrawal et al., 2001; Yang et al., 2003; Heynderickx et al., 2004; Andrews et al., 2005; Igci et al., 2008; Wang et al., 2009; Parmentier et al., 2012). The studies have emphasized the role played by the meso-scale solid structure on the overall dynamic behaviors. These structures are cancelled out when the grid is too coarse.
Recently, a novel modelling approach has been developed for overcoming this limitation. Similarly than the LES for single phase flow, the approach solves the filtered equations of the multi-fluid model and the subgrid contributions are taken into account by additional terms. Parmentier et al. (2012) proposed a model for the subgrid drag contribution. The model has been assessed by a priori test. In the present paper we propose to do a posteriori test of the model on a pilot scale fluidized bed for which we experimental data are available. The considered powder is a binary mixture of very small particles.
Nomenclature
g gravitational constant (m/s2)
Pk pressure (N/m2)
dP Particle diameter (rn)
Dreac diameter of the reactor (rn)
Uk,i mean velocity of phase k (mis)
Greek /etiers
ak Volume fraction of phase k (m.3)
Pk Density of phase k (kg!m3)
rfp
Particle response time (s)Subscripts
k Material phase (k=g: gas, k=p: particles)
Mathematical approach
The modelling approach is based on the two-fluid model formalism that involves mean separate transport equations of mass, momentum and energy for each phase. Interactions between phases are coupled through interphase transfers. The transport equation for disperse phase fluctuations, q~
developed in the frame of kinetic theory of granular media supplemented by the interstitial fluid effect and the interaction with the turbulence (Balzer et al. (1995), Gobin et al. (2003)), are resolved with taking into account inter-particle collisions on the dispersed phase hydrodynamic. The effect of the fluctuations of the gas velocity at small scales is neglected. Conceming the transfers between the phases with non-reactive isothermal
flow, drag force was only taken into account for the transfer ofmomentum.
By applying a filter on the set of equations of the standard Euler-Euler multi-fluid model we obtain the following filtered Euler-Euler multi-fluid model. The filtered volume fraction ofthe phase kwrites
iik(x, t)
=
J
ak(r, t)G(x- r)drwhere iik is the filtered volume fraction of the phase k, and
G(x-r) is the filter satisfying
f
G(r)dr=
1. The filtered velocity flk,i of the phase k is defined byiik(x, t)flk,i(x, t)
=
J
ak(r, t)Uk,i(r, t)G(x- r)drApplying the filtering process to the standard Euler-Euler we get filtered mass balance equation:
a
a (
_ )
at (iikPk)
+
ax. iikpkUk,i=
01 and the filtered momentum equation
aakpkflk,i a [- - - ] - - ap sgs
at
+
ax· akpkUk,iUk,i - -ak ax· - CfJk,i1 t
+
iikPkBi - sgs+
lk,i+
lk,ia [-
sgs]+
ax· akpkak,ij 1-
arsgs
_ ar
ii _ _ 1_ï _ axj axjThe term cp~~s represents the correlation between the volume fraction of phase k and gas pressure. A Reynolds stress contribution coming from the gas or particle phase velocity fluctuations
a:JJ
is defined by the following equation:- sgs
The terms lp,i and Ip,i are the filtered and sub-grid momentum exchange. As we consider polydisperse flow we have momentum gas-particle exchange but also between particle species.
Ïp,i
=
Îtp,i+
Ïpp,i1sg_s
=
1sg~+
1sg~p,t tp,t pp,t
where the subscript fp indicates the fluid-particle exchange and pp the particle-particle exchange. The subgrid contribution of the particle-particle momentum exchange is an open issue. In the present study we assume this contribution negligible.
The filtered and subgrid drag contribution are both defined as - _ Vr,i ltp,i
=
-aPpP -;:;p itP sgs - a;p;il;.,t -Itp,i - iF - ltp,i tPwhere the fluid-particle relative velocity writes Vr,i
=
Up,i - Ut,i and ifp the particle response time scale
1 3 Pt (lvrl)
-=----cd
ifp 4pP dp
and the drag coefficient is modelled by Wen & Yu's (1965) correlation.
Following Ozel et al. (2010), Parmentier (2010), Parmentier
et al. (2011) and Ozel (2012), we propose to decompose the filtered drag force in two contributions: the difference between filtered gas and particle velocities, Vr,i
=
flp,i-flt,i> and a sub-grid drift velocity Vd,i· Then, the filtered
drag force is written as
apPpVr,t iipPp (- - - )
--'---::---'- = - - -
iF iFu . -ut.-
p,t ,t vd. ,ttP tP
The sub-grid drag contribution is then written
sgs _
iipPp-Itp,i - - iF vd,i
tP
Parmentier (2011) proposed to model the sub-grid drift velocity as:
Vd,a
=
Kaah(iip)[(Ll*)Vr,awhere the subscript a is employed for indicating no implicit summation. The fonctions h(iip) and f(Ll*) are fitted from data ofhighly resolved multi-fluid simulations.
h(iip)
=
-tanh(iiP)j
a,
(1-~)
2
[1-
Ch
2
~
ch1 amax amax amax
+Ch3(~)
2]
a maxwith Ch1 = 0.1 , Ch2 = 1.88 and Ch3 = 5.16 . The
maximum volume fraction of solid phase amax is set to
0.64. The dependence of model on the filter width is given by:
.1*2
f(Ll*) = c2
+
.1•2f
The model constant has been determined as Ct
=
6.13 10-2• The normalized size of the mesh is chosen as .1
.1*= --==
ip.JBDH
with i
=
Ppd~
the particle response rime according to the p 18J.ltStokes law and DH the hydraulic diameter of the bed. The characteristic length scale of the considered cell is defined from the volume of the cell Veel! as
.1=
3_,jvcell
The model constant Kaa is dynamically adjusted in each cell by dynamic procedure similar than the one in the single-phase flow Large Eddy Simulation (see Parmentier, 2011). This model has been implanted is NEPTUNE_CFD.
Numerical simulations overview
The fluidized bed is composed of a cylindrical column of a few centimetres (-30cm) in diameter and the height of the column is approximately 5 times the diameter. At the top of the fluidized bed the section is reduced. Hexahedra are used for meshing the geometry (see Figure 1).
The top of the geometry is an outlet for both the gas and the particles. The bottom of the column being the fluidization grid it is an inlet for the gas and a wall for the particles. The fluidization velocity is set to 11 cm/s.
The wall boundary condition is friction for the gas. As we proposed to check the effect of the wall boundary condition for the particle we have used pure slip and no slip boundary conditions (Fede et al., 2009; Fede et al., 2010).
L
.
Figure 1: Mesh of the of the geometry.
The gas is air in standard thermodynamic conditions
(p8 = 1.2kgfm3 and
fl.g = 1.8510-5Pa.s). The powder is a mixture of two particle species each considered as monodispersed. The material properties of the solid phases
are given in Table 1.
Solid #1 #2
Density (kg/m3) 4600 1 800
Mass(kg) 16 4
Diameter (J,Lm) 17 15
Settling velocity normalized
0,37 0,11
by Duidization velocity
Table 1: Material properties of sohd phases.
The particle density ratio is about 3 and the mass ratio about 4. The mean diameter of the solid#1 is about 17 microns and for the solid#2 about 15 microns.
At t
=
Os the solid is uniformly distributed in the reactorover a given height but representing the solid mass given by Table 1. We perform numerical simulation during 20 physical seconds for destabilizing and mixing the solid phase. After that time-averaged statistics are computed during 100 physical seconds.
The numerical simulations have been carried out using an unsteady Eulerian multi-fluid approach implemented in the
unstructured para11elized code NEPTUNE_ CFD
Vl.08@Tlse. NEPTUNE_ CFD is a multiphase flow
software developed in the fra.mework of the NEPTUNE project, financially supported by CEA (Commissariat à l'Energie Atomique), EDF (Electricité De France), IRSN (Institut de Radioprotection et de Sûreté Nucléaire) and AREVA NP (Neau et al., 2010). The simulations have been carried out with 8 cores of a cluster SGI Altix ICE8200-EX based on Intel Xeon X5560 Quad Core processors.
0.2
81h International Conference on Multiphase Flow
ICMF 2013, Jeju, Korea, May 26-31, 2013
---e---No Sabsrid modcl, IOHdlll
6 No Sabirid mode\ IOüdiZ
---Wilb.SuJtwridnllllld.,8Dlidll
" w .. ._..._...,.
oo~~~~~~~~-~~~~~~~~~
Time
Figure 2: Time-evolution of the solid mass in the fluidized bed. Comparison between the simulation with (black-filled symbols) and without (empty symbols) subgrid model.
Solid vol. frac.
L
.
0
.
28~
0.21 0.14 0.07 0.00L
.
Figure 3: Time-averaged solid volume fraction (left: solid#l and right: solid#2) computed with subgrid model and no-slip wall boundary condition.
Results and Discussion
Figure 2 shows the rime-evolution of the solid mass in the
reactor. The solid masses are normalized by the solid mass at t "" Os and we compare the data obtained in the numerical simulations with and without the subgrid model. After a few seconds, we observe that the mass of solid phases decrease in case without subgrid model. More, at
t = BOs the Figure 2 shows that the reactor becomes nearly
empty. In contrast, with the subgrid model the solid mass in
the reactor is nearly constant as in the experiment (no
elutriation or entrainment). Figure 2 obviously shows the need of subgrid model for the numerical simulation of
Figure 4: Time-averaged mean particle velocity of solid# Simulations performed with subgrid model and no slip wall boundary condition for solid phases.
Time-averaged mean solid volume fractions from the numerical simulation with subgrid model are shown by Figure 3. As expected, we observe larger values of solid#l compared to solid#2. For both solid phases, we observe that the solid volume fraction is more important close to the wall and at the bottom of the reactor. The maximum value of solid#l volume fraction is nearly 28%.
Figure 4 shows time-averaged mean particle velocity. As already shown by Fede et al. (2009) we observe a large scale mixing system located at the bottom of the reactor. As the geometry is three-dimensional the mixing structure is an annulus. At the centre of the reactor, Figure 4 shows an upward solid flow of solid whereas close to the wall the particulate flow is downward.
Figure 3 shows that the bed height is nearly equal to the diameter of the reactor. This result is confirmed by Figure 5
showing the vertical distribution of the gas pressure measured at the wall. The Figure 5 compares the results obtained with free slip and no slip wall boundary condition for the particles and with the experimental data. Between 0.2 and one diameter we observe a linear profile of the pressure distribution. Under 0.2 diameter the behaviour is still linear but the slope is modified. Such a description of the vertical gas pressure distribution in dense fluidized bed is quiet standard. We observe sorne difference with the experimental data but the trend is satisfactory.
Fede et al. (2009) investigated the effect of the wall boundary condition for the solid on the hydrodynamic of dense pressurized fluidized bed. They showed that depending on the boundary condition for the solid the overall hydrodynamic may be modified. Then we have estimated the effect of boundary condition on our case. In the literature we found several types of particle wall
boundary conditions representing the physics of particle bouncing. Free slip wall boundary condition represents
elastic bouncing of spherical particles on a smooth wall. At
the opposite, no slip boundary condition can be interpreted as a bouncing of spherical particle on rough wall with buge
roughness; or as the bouncing of non spherical particle on a
smooth wall. Between this two extremes boundary
conditions have been derived for taking into account
1.5 0.5 D - - N o a l i p F10eSlip D I!Kperimmt D D p-p ,.r [Pa]
Figure 5: Gas pressure vertical distribution measured at the wall. The solid and dashed lines correspond to numerical simulations performed with subgrid model and two kinds of boundary conditions for solid phase. The symbols are pressure drop measured in experiment.
----e----Solid#l, No 1tip
---.:...--SolidN2, No llip ~ SolidiH,Frooolip ~Solidii2,Prooalip 0.2\
--=-
j
'"::::::~~~-~---'----,. ~~ ~ 0.1 --~~-5~~~-0~.2~5~~~70~~~~0.2~5~~~0.5 r/D_ - - - G - - - - Solid#l, F1C041ip - - - . Q . . - . - - Solidt#2,P.xw--slip - -Solidj;l,No-stip - - - -SolicW2, No-eUp 0.2 0.1 ~~-5~~~-0~.2~5~~~70~~~~0.2~5~~~0.5 r/D.,_Figure 6: Effect of the boundary condition of solid phases on time-averaged mean solid volume fraction of solid#l and solid#2. Simulations performed with subgrid model.
6 4 >~ 2
--~"' 0 -2 - - - B - - Gas ---A---- Solid#l -4 ---'15'--- Solid#2 ~0~.5~~~-~0.~25~~~~0~~--~0~.2~5~~~~0.5 r/D...., 6 4 >~ 2 --~"' 0 -2 - - - e - - Gas ---A---- Solid#l -4 ---v---- Solid#2 ~0L.5~~~-~0.~25~~~~0~~--~0~.2~5~~~~0.5 r/D,..,Figure 7: Time-averaged radial profile of mean vertical gas and solid velocities. Simulations performed with subgrid model and no slip wall boundary condition for the particles.
particle-wall friction (Sakiz & Simonin, 1999) or bouncing of spherical particles on a rough wall (Konan et al., 2006, Konan et al., 2009). Earlier, Johnson & Jackson (1987) derived mixed boundary conditions these are very often employed for the numerical simulation of fluidized bed. However, the main drawback of such boundary condition is that it is based on a specularity coefficient for which we do not have any realistic value. In the present paper we have on1y checked the effect of free slip and no slip wall boundary conditions in order to evaluate the importance of the boundary condition on the simulation of reactor involving very small particles.
Fede et al (2009) showed that no slip wall boundary condition leads to increase the bed height. They explained such a result by the fact that no slip wall boundary condition decreases the rotating velocity of the recirculation loop. Figures 5 shows that in our numerical simulations the vertical pressure profile and, consequently, the bed height are not affected by the wall boundary condition for the
-1
81h International Conference on Multiphase Flow
ICMF 2013, Jeju, Korea, May 26-31, 2013
- - - e - - Gas ---A---- Solid# 1 ---v---- Solid#2 -~~.5~~~-~0.~25~~~~0~~--~0~.2~5~~~~0.5 r/D""' -1 - - - B - - Gas ---A---- Solid#l ---v---- Solid#2 -~L.5~~~-~0.~25~~~~o~~--~o~.2~5~~~~o.5 r/D""'
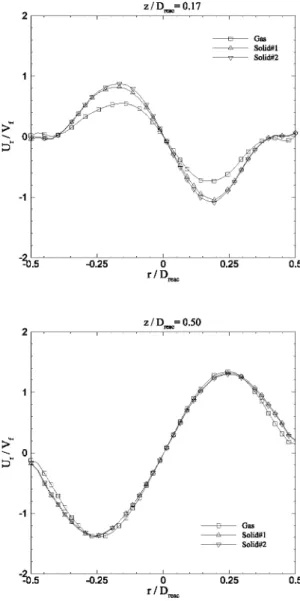
Figure 8: Time-averaged radial profile of mean radial gas and solid velocities. Simulations performed with subgrid model and no slip wall boundary condition for the particles.
NJ-~
NJ-r!
0.8 ----B---- z/Drœc:=0.17 ---A----z 1 D.._ = 0.50 0·7~o~.5~~~-~o.~25~~~-o~~---"-c-o.2~5c"-~~~o.5 r/D....,Figure 9: Time-averaged radial profile of particle agitation of both solid phases. Simulations performed with subgrid model and no slip wall boundary condition for the particles.
400 200 -200 -400 -0.25 400 200 -200 -400
----B----Gas - upward flux
---A---- Solid#l-upward flux ---'V---- Solid#2 -upward flux
--- Gas - downward flux _______.______ Solid#l-downward flux
---T---- Solid#2 -downward flux
0
r/D,...
----B----Gas -upward flux
0.25
---A---- Solid#l -upward flux
--- Solid#2 -llJ'W'IlÙ flux
--- Gas - downward flux
_______._______ Solid#l-downward flux
---T--- Solid#2 -downward flux
0.5
~O%L.5~~~-0~.~25~~~-0~~~~0.2~5~~~~0.5
r/D,...
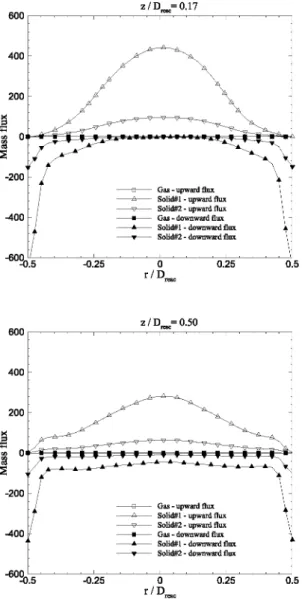
Figure 10: Radial profile of upward and downward mass flux of gas and particles. Simulations performed with subgrid model and no slip wall boundary condition for the particles.
solids. This trend is confirmed by Figure 6 showing the radial profile of mean solid volume fraction. Indeed, we do not observe any effect of the wall boundary condition on the radial distribution of the solid.
Figure 6 shows the radial profile of solid volume fraction at the bottom of the bed rfDreac
= 0.17 and at
rfDreac=
O.S. In a general manner the shapes of the profiles are nearly identical but as expected the mean solid volume fractions are not the same. For both solid we observe that in the near wall regions and at the centre of the reactor, in average, the solids are more present. This typical trend of dense fluidized bed cornes from the macroscopic recirculation motions (see Figure 3).
Figures 7 & 8 show the radial profile of vertical and radial component of mean gas and solid velocities. As expected Figure 7 shows that the vertical gas velocity is larger than the solid ones. At the centre of the reactor we observe an
1.1
--!t
0.9 - - - à - - Solid#l --- Solidil2 0·~o'-=.s~~~_cc-o.'oc2sc"-~~--co~~~~oo-.2!ccsc"-~~~o.s r/D,... 1.1!!
-- 1ç
--!t
0.9 ----8--- Solid#l ~ Solid#2 0·~o'-=.s~~~_cc-O.'oc2sc"-~~--co~~~~oo-.2!ccsc"-~~~o.s r/D,...Figure 11: Radial profile of particle segregation in the fluidized bed. Simulations performed with subgrid model and no slip wall boundary condition for the particles.
upward gas velocity up to 6 times the fluidization velocity and up to 4 times the fluidization velocity for the solid vertical velocities. In the near wall region we observe downward velocities for both the gas and solids. At
rfDreac
=
0.5 the profiles are found flatter.The radial profiles of radial velocities are given by Figure 8. In the bottom part of the reactor (rfDreac
=
0.17) we observe that the radial velocities are negative meaning that the gas and the particles move away from the wall. In contrast, for r /Dreac=
0.5 the radial velocity indicates that the gas and particles move towards the wall. Such behaviour is in accordance with our previous remarks on the presence of a macroscopic mixing recirculation annulus.At the bottom part of the reactor we observe that the radial velocity of the gas is smaller than the solid ones.
Figures 7 & 8 show that the solid#l and solid#2 mean vertical and radial velocities are identical. This phenomenon
0.5 ---A---- Solid#l-cen.tre ---v---- Solid#2 -centre ________.______ Solid#l-wall ---.--- Solid#2 - wall 0o~~~o~.5~~~1~~~1~.5~~~2~~~2.5
( a.p 1
a;')
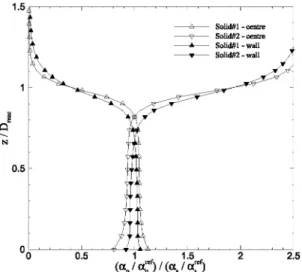
1 (a., 1 a.~')Figure 12: Vertical profile of particle segregation in the fluidized bed. Simulations performed with subgrid model and no slip wall boundary condition for the particles.
cornes from the large solid volume fractions. In such a dense flow, the collision time scale is much smaller than any characteristics time scale of the fluidized bed. It means that the momentum exchange by the collisions is large and leads to the solid phases to have nearly the same mean velocity (Fede et al., 2011).
Figure 9 shows the ratio of the two particle agitation. This figure indicates that the particles species have different temperature and then the presence of particle-particle collision between the two species. Even is the shape of the radial profiel differs from the bottom to the top of the fluidized, we observe that the intensity is nearly constant around [0.8; 0.5] at the centre and 0.86 near the wall.
Figure 10 shows the gas and solid upward and downward mass fluxes. At the centre of the reactor the main upward mass flux is the one of solid#l. The downward solid flux is essentially located near the walls. The solid#1 is also the one controlling the downward solid mass flux.
For analysing the solid phase segregation, we define the normalized solid volume fraction of p-particles:
ret
aP aP
- x - -
a rets a5
where a;et is the solid volume fraction for a uniform fluidization. When this quantity is larger than one it means that the solid ''p" is more present than in case of a homogeneous fluidization. In contrast, for a value less than one the solid is not the majority.
Figure 11 shows radial profile of normalized solid volume fraction. At rfDreac
=
0.17 and rfDreac= 0.50 the
solid#1 is a little bit the more present. The vertical distribution of this quantity measured at the centre of the reactor (empty symbols) and near the wall (black-filled symbols) is shown by Figure 12.
81h International Conference on Multiphase Flow
ICMF 2013, Jeju, Korea, May 26-31, 2013
1.5 D 0.5 D D 0oL_~~~~1~oo=o~~~~=2o~o~o~~~~3~ooo p-p ref [Pa]
Figure 13: Effect of the constant of subgrid model on the time-averaged gas pressure measured at the wall. Simulations performed with subgrid model.
Effect of model's parameter
We have shown in the section dedicated to the mathematical modelling that the subgrid model has on1y one parameter. Te effect of this parameter on the vertical gas pressure distribution is shown by Figure 13. When the model parameter is divided by ten we do not have effect. In contrast, when the model parameter is multiply by ten we observe on that the slope of the pressure is increasing. When the model has been derived, Parmentier et al. (20 11) fit the model on highly-resolved Euler-Euler simulation. However the numerical simulation were two-dimensional so we may wondering if the value of the constant changes in case of three-dimensional simulation.
Conclusions
A posteriori test of subgrid drag model proposed by Parmentier et al (20 11) has been done by numerical simulation of 3-dimensionnal dense fluidized. The results have been compared with pressure drop measured on experiment. The numerical simulations have been performed for a binary mixture of particles.
We have shown that without subgrid model the numerical simulation are realistic because the reactor because empty quickly. In contrast with the subgrid model for the drag, the solid mass in the reactor is constant. The comparison of the pressure drop in experiment and in numerical simulation is satisfactory.
With the subgrid model, we have observed a standard hydrodynamic of a dense the fluidized bed. A large scale macroscopic mixing is observed. The solid volume fraction is larger close to the wall. At the centre of the reactor we have an upward flow whereas near the walls we found a downward flow. In our specifie case, the particle segregation (in terms of polydispersion) is not present but not too important.
The effect of the boundary condition and the sensibility to the subgrid model's parameter has been investigated. The boundary conditions for the particulate phase are not significant because we found same results with free slip and with no slip boundary conditions. In contrast by multiplying the model 's parameter by ten leads to higher bed. This implies more investigations.
Acknowledgements
This work was granted access to the HPC resources of CALMIP under the allocation P0111 (Calcul en Midi-Pyrénées).
References
Agrawal, K., Loezos, P., Syamlal, M., Sundaresan, S., 2001. The role of mesoscale structures in rapid gas-solid flows. Journal ofFluid Mechanics 445, 151-185.
Andrews, A.I., Loezos, P.N., Sundaresan, S., 2005. Coarse-grid simulation of gas-particle flows in vertical risers. Industrial & Engineering Chemistry Research 44, 6022-6037.
Balzer, G., Boëlle, A., Simonin, 0., Eulerian Gas-Solid Flow Modelling of Dense Fluidized Bed, FLUIDIZATION VIII, Proc. International Symposium of the Engineering Foundation, pp 409-418, 1995.
Fede, P.; Moula, G.; Ingram, A.; Dumas, T., Simonin, 0., 3D Numerical Simulation And PEPT Experimental Investigation Of Pressurized Gas-solid Fluidized Bed Hydrodynamic Proceedings of ASME 2009 Fluids Engineering Division Summer Meeting, 2009
Fede, P.; Neau, H.; Simonin, 0., Ghouila, 1., 3D Unsteady Numerical Simulation of the Hydrodynamic of a Gas Phase Polymerization Pilot Reactor 7th International Conference on Multiphase Flow, ICMF 2010, Tampa, FL, May 30- June 4,2010
Fede, P.; Simonin, O. & Ghouila, 1. 3d Numerical Simulation Of Polydisperse Pressurized Gas-solid Fluidized Bed Proceedings of ASME 2011 Fluids Engineering Division Summer Meeting, 2011
Gobin, A., Neau, H., Simonin, 0., Llinas, J.R., Reiling, V., Selo, J.L., Fluid Dynamic Numerical Simulation of a Gas Phase Polymerisation Reactor, Int. J. for Numerical Methods in Fluids 43, 1199-1220, 2003.
Heynderickx, G.J., Das, A.K., Wilde, J.D., Marin, G.B., 2004. Effect of clustering on gas-solid drag in dilute flows. Industrial & Engineering Chemistry Research 43, 4635-4646.
Igci, Y., Andrews, A.T., Sundaresan, S., Pannala, S., O'Brien, T., 2008. Filtered two-fluid models for fluidized gas-particle suspensions. AIChE Journal 54, 1431-1448.
Johnson, P. C. & Jackson, R. Frictional-collisional constitutive relations for granular materials, with application to plane shearing J. Fluid Mech., 1987, 176, 67- 93
Konan, N. A.; Lain, S.; Simonin, O. & Sommerfeld, M. Comparison Between Euler-Euler and Euler-Lagrange Computation of Gas-Solid Turbulent Flow in a Horizontal Channel With Different Wall Roughness Proc. 7th International Symposium on Numerical Methods for Multiphase Flows, ASME-FEDSM, 2006.
Konan, N.; Kannengieser, O. & Simonin, O. Stochastic modeling of the multiple rebound effects for particle-rough wall collisions International Journal of Multiphase Flow, 2009, 35, 933 - 945
Neau, H.; Laviéville, J. & Simonin, O. NEPTUNECFD High Parallel Computing Performances for Parti cie-Laden Reactive Flows 7th International Conference on Multiphase Flow, ICMF 2010, Tampa, FL, May 30- June 4, 2010 Ozel, A., Parmentier, J.-F., Simonin, 0., Fede P., A priori Test of Effective Drag Modelling for Filtered Two-Fluid Model Simulation of Circulating and Dense Gas-Solid Fluidized Beds, 7th International Conference on Multiphase Flow, ICMF 2010, Tampa, FL, May 30- June 4, 2010 Ozel, A., Fede, P., Simonin, 0., A priori Test of Effective Drag Modelling for Filtered Two-Fluid Model Simulation of Circulating and Dense Gas-Solid Fluidized Beds, 7th International Conference on Multiphase Flow, ICMF 2010, Tampa, FL, May 30- June 4, 2010
Parmentier, J.-F., Simonin, O. & Delsart, O. A functional subgrid drift velocity model for filtered drag prediction in dense fluidized bed AIChE Journal, Wiley Subscription Services, Inc., A Wiley Company, 2011, 1-15
Sakiz, M. & Simonin, O. Development and Validation of Continuum Parti cie Wall Boundary Conditions U sing Lagrangian Simulation of a Vertical Gas-Solid Channel Flow Proc. ASME Fluids Engineering Division Summer Meeting, FEDSM99-7898, 1999.
Simonin, 0., Continuum Modelling ofDispersed Two-Phase Flows, in Combustion and Turbulence in Two-Phase Flows, Lecture Series 1996-02, von Karman Institute for Fluid Dynamics, Rhode Saint Genése (Belgium), 1996
Wen, Y. & Yu, Y. Mechanics of Fluidization Chemical Engineering Symposium Series, 1965,62, 100-111
Yang, N., Wang, W., Ge, W., Li, J., 2003. CFD simulation of concurrent-np gas-solid flow in circulating fluidized beds with structure-dependent drag coefficient. Chemical Engineering Journal96, 71-80
Wang, J., van der Hoef, M., Kuipers, J., 2009. Why the two-fluid model fails to predict the bed expansion characteristics of geldart a particles in gas-fluidized beds: A tentative answer. Chemical Engineering Science 64, 622 -625.