HAL Id: hal-00514406
https://hal.archives-ouvertes.fr/hal-00514406
Submitted on 2 Sep 2010
HAL is a multi-disciplinary open access
archive for the deposit and dissemination of
sci-entific research documents, whether they are
pub-lished or not. The documents may come from
teaching and research institutions in France or
abroad, or from public or private research centers.
L’archive ouverte pluridisciplinaire HAL, est
destinée au dépôt et à la diffusion de documents
scientifiques de niveau recherche, publiés ou non,
émanant des établissements d’enseignement et de
recherche français ou étrangers, des laboratoires
publics ou privés.
Suboptimal sensor subset evaluation in a P300
Brain-Computer Interface
Hubert Cecotti, Bertrand Rivet, Marco Congedo, Christian Jutten, Olivier
Bertrand, Emmanuel Maby, Jérémie Mattout
To cite this version:
Hubert Cecotti, Bertrand Rivet, Marco Congedo, Christian Jutten, Olivier Bertrand, et al..
Subopti-mal sensor subset evaluation in a P300 Brain-Computer Interface. EUSIPCO 2010 - 18th European
Signal Processing Conference, Aug 2010, Aalborg, Denmark. 5 p. �hal-00514406�
SUBOPTIMAL SENSOR SUBSET EVALUATION IN A P300
BRAIN-COMPUTER INTERFACE
H. Cecotti
1, B. Rivet
1, M. Congedo
1, C. Jutten
1, O. Bertrand
2, E. Maby
2, J. Mattout
21GIPSA-lab CNRS UMR 5216 Grenoble Universities
F-38402 Saint Martin d’Heres, France
2INSERM, U821, Lyon, F-69500, France
Institut Federatif des Neurosciences, Lyon, F-69000, France Universite Lyon 1, Lyon, F-69000, France
ABSTRACT
A Brain-Computer Interface (BCI) is a specific type of human-computer interface that enables the direct com-munication between human and computers by analyzing brain activity. Oddball paradigms are used in BCI to generate event-related potentials (ERPs), like the P300 wave, on targets selected by the user. This paper deals with the choice of a reduced set of sensors for the P300 speller. A low number of sensors allows decreasing the time for preparing the subject, the cost of a BCI and the P300 classifier performance. A new algorithm to select relevant sensors is proposed, it is based on the backward elimination with a cost function related to the signal to signal-plus-noise ratio. This cost function offers bet-ter performance and avoids further mining evaluations related to the P300 recognition rate or the character recognition rate of the speller. The proposed method is tested on data recorded on 20 subjects.
1. INTRODUCTION
A Brain-computer interface (BCI) is a direct commu-nication pathway between a human brain and an ex-ternal device. Such systems allow people to commu-nicate through direct measurements of brain activity, without requiring muscular movement [3]. BCIs may be the only means of communication for people who are affected by severe motor disabilities like spinal cord in-juries and amyotrophic lateral sclerosis (ALS) [4]. Pat-tern recognition and signal processing techniques are used for the classification and the detection of specific brain responses. Most of the effective solutions use ma-chine learning models [10, 13]. Whereas neuroscience knowledge guides the detection of expected signals, ma-chine learning techniques allow modeling the signal vari-ability over time and over subjects. One current chal-lenge in the BCI community is to find an optimal set of sensors for a specific subject and paradigm. The choice of a reduced set of sensors decreases the time for prepar-ing the subject/patient, the cost of a BCI, but it can also improve the performance of the classifier by select-ing a reduced and better set of input features. Several strategies exist for selecting a sensor subset. First, it is possible to select sensors based on prior knowledge from previous experiments. In such case, the choice of the sensors is fixed and may be an issue for some subjects as the sensor subset varies across subjects [8]. Indeed, it is better to personalize the sensor subset in relation to the
1 This work was funded by the ANR RoBIK and CoAdapt
projects.
user. For a set with N sensors, there exist 2N candidate subsets. We distinguish three main ways for searching the best subset: complete, random and sequential. The complete search is usually intractable as the search space grows exponentially. The random search starts with a randomly selected subset and add randomness in the se-quential approach or it generates new random subsets, like the Las Vegas algorithm [1]. The sequential search does not guarantee optimality. Several variations are described in the literature, like the greedy hill-climbing approach, the forward selection, backward elimination, and bi-directional selection.
In this paper, we will consider the backward elimina-tion. The problem that we address in this paper is how to find an efficient criterion for removing the less rele-vant sensors, i.e. how to evaluate the relevance of a par-ticular sensor subset. The consequences of the selected sensors should be then evaluated in the P300 speller. The paper is organized as follows. The P300 speller is presented in the second section. The sensor selection strategy is explained in the third section. The different criteria for the sensor evaluation are given in the fourth section. Section five is dedicated to the proposed meth-ods. Data and the protocol experiment are detailed in the sixth section. Finally, the performance of the sensor selection is discussed in the last section.
2. P300 SPELLER
A P300 speller allows people to write characters (let-ters, digits, symbols) on a computer screen. Oddball paradigms are used in BCI to generate event-related po-tentials (ERPs), like the P300 wave, on targets selected by the user. A P300 speller is based on this principle [6]. A 6 × 6 matrix containing all the available characters is presented to the user on a computer screen. To spell a character, the user has to focus on the character s/he wants to spell. When the user focuses on a cell of the matrix, it is possible to detect a P300 (a positive de-flection in voltage at a latency of about 300 ms in the EEG) after the cell has been intensified. To generate ERPs, the row and columns are intensified randomly. Row/column intensifications are block randomized in blocks of 12 (6 rows and 6 columns). The sets of 12 intensifications is repeated Nepochtimes for each charac-ter. Therefore, 2Nepoch possible P300 responses should be detected for the recognition of one character.
A P300 speller is composed of two steps, each one being a classification problem. The first classification step is to detect the presence of a P300 in the
electroen-cephalogram (EEG). The second one corresponds to the combination of a minimum of two P300 responses for de-termining the right character to spell (one row and one column). These two steps are sequential. The detection of P300 responses corresponds to a binary classification: one class represents signals that correspond to a P300 wave, the second class is the opposite. The timing of the flashing lights provide the triggers for the P300, which depends on the user. Although a P300 response can be expected at one particular latency, it is possible that the user does not produce a P300 response at the right moment as many artifacts can occur. In the character recognition step, the outputs of the P300 classification are combined to classify the main classes of the applica-tion (characters). In the oddball paradigm, a character is defined by a couple (row,column). The flashing lights are on each row and column and not on each charac-ter. The character is supposed to correspond to the intersection of the accumulation of several P300 waves. The best accumulation of P300 waves for the horizontal (resp. vertical) flashing lights determines the row (resp. the column) of the desired character.
We note V ∈ R12×Nepoch the matrix containing the
cumulated probabilities of the P300 detection for each of the 12 flashes and for each epoch.
V (i, j) = j X k=1
EP 300(P (i, k)) (1)
where P (i, j) ∈ RNf×Ne is the pattern at the epoch
j corresponding to the subject response for the flash i, (i, j) ∈ {1, . . . , 12} × {1, . . . , Nepoch}. Nf and Neare the number of sensors and the number of sampling points representing the signal, respectively. EP 300 is a classi-fier that returns a confidence value v ∈ [1; 0]: 1 (resp. 0) denotes a perfect confidence that P300 response is detected (resp. not detected).
At each epoch j, it is possible to evaluate the coor-dinate (xj, yj) of the selected character by:
xj = argmax 1≤i≤6 V (i, j) (2) yj = argmax 7≤i≤12 V (i, j). (3)
We denote by ESpeller({P (1, Nepoch), . . . , P (12, Nepoch)}) = (row, column), the selected character.
3. SENSOR SELECTION 3.1 Backward elimination
The chosen method for adaptively selecting relevant sen-sors is based on the backward elimination. It involves starting with all candidate variables and testing them one by one for their significance, deleting those that are not significant. At each iteration of the algorithm, each of the Nsremaining sensors is removed one by one, the subset of Ns−1 remaining sensors are tested and Ns per-formance scores are given. By choosing the subset with the highest score, the less relevant sensor is eliminated. A subset with a high score means that the removed sen-sor has a low impact on the performance score. In this
(a) Graphical User Interface (b) P300 evoked potentials
Figure 1: P300-BCI Speller. Fig. 1(a): Screen display, Fig. 1(b): Average P300 response on Cz
work, we eliminate the two worst sensors at each step of the algorithm, i.e. the sensors corresponding to the two subsets with the highest score. This iteration procedure is continued until two sensors only are left. The method leads us to rank the relevance of each sensor: a relevant sensor is never eliminated whereas a useless sensor is eliminated during the first steps of the algorithm. The rank of a sensor is defined by Ns/2 − i where i is the iteration where the sensor was removed.
3.2 Subset evaluation
Two types of criterion can be used for evaluating a sub-set. First, independent criteria aim at evaluating the goodness of a feature or a set of features by consider-ing the underlyconsider-ing characteristics without involvconsider-ing any classification algorithm. For instance, independent cri-teria can be based on information measures, distance measures, dependency measures, and consistency mea-sures [2]. Second, a dependency criterion requires a predetermined mining algorithm in feature selection. It uses the performance of the mining algorithm applied on the selected subset to determine which features are se-lected. In a classification problem, the accuracy is often used as a dependent criterion for feature selection. As features are selected by the classifier that will use these same selected features for classifying unseen signals, this strategy usually provides better performance as it finds features that are better suited to the task. However, such method tends to be more computationally expen-sive as they require training and testing models (with a K-fold cross validation to overcome overfitting). In a P300 speller, three main criteria can be used for the subset evaluation: the evaluation of the EEG signal, the recognition of the P300 responses (EP 300) and the evaluation of the speller, i.e. the application (ESpeller). Besides, the classification of the P300 can include a pre-processing steps for creating spatial filters (SF).
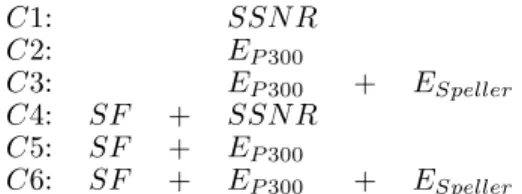
The criteria that are used during the backward elim-ination as a function for selecting the best subsets are resumed in Table 1. These criteria can be viewed as three basic criteria applied without (C1, C2, C3) or with (C4, C5, C6) spatial filtering as preprocessing. C1 and C4 correspond to the signal to signal-plus-noise ra-tio (SSNR), which can be directly compared from sig-nal properties. The other criteria needs classification results. It requires the classification of the P300 re-sponses with EP 300 (C2 and C5) or the complete char-acter recognition steps with EP 300and ESpeller(C3 and
C1: SSN R C2: EP 300 C3: EP 300 + ESpeller C4: SF + SSN R C5: SF + EP 300 C6: SF + EP 300 + ESpeller Table 1: The criteria for evaluating sensor subsets.
C6). For C2 and C5, the criterion represents the recog-nition rate of the P300 speller that is defined as the average recognition rate over every epoch. For C3 and C6, it represents the recognition rate of character for the P300 speller. It is worth mentioning that ESpeller requires EP 300. The more steps are added, the more the method gets computationally expensive. The goal here is to identify the best criterion, to analyze the impact of spatial filtering and if the performance is related to the number of processing steps.
4. METHODS
This section is dedicated to the methods that were used for creating the spatial filters, evaluating the SSNR and classifying the P300 responses.
4.1 Spatial filters
For the evaluation of the EEG signal we consider the xDAWN algorithm that is fully described in [15, 14]. This method is based on two main hypotheses. First, there exists a typical response synchronized with the target stimuli superimposed with an evoked response by all the stimuli (target and non-target). Second, the evoked responses to target stimuli could be enhanced by spatial filtering. We consider an analytical model of the recorded signals X that is composed of three parts: the P300 responses (D1A1), a response related to every superimposed evoked potentials (D2A2) and the residual noise (N )
X = D1A1+ D2A2+ N. (4) where X ∈ RNt×Ns, Ntand Nsare the number of
sam-pling points over time and the number of sensors, re-spectively. D1 and D2 are two real Toeplitz matrices of size Nt× N1 and Nt× N2 respectively. D1 has its first column elements set to zero except for those that correspond to a target. For D2, its first column ele-ments set to zero except for those that correspond to stimuli onsets. N1 and N2 are the number of sampling points representing the target (the P300 response) and superimposed evoked potentials, respectively. N is a real matrix of size Nt× Ns.
By applying spatial filters U1∈ RNs×Nf, the goal is
to enhance the signal to signal-plus-noise ratio (SSNR) of the enhanced P300 responses (D1A1U1), where Nf is the number of spatial filters
XU1 = D1A1U1+ D2A2U1+ N U1. (5) We define the SSNR in relation to the spatial filters by: SSN R(U1) =T r(U T 1AˆT1D1TD1A1U1)ˆ T r(UT 1XTXU1) (6)
where ˆA corresponds to the least mean square estima-tion of A1.
The SSNR is maximized by: ˆ
U = argmax U1
SSN R(U1). (7)
In the definition of the SSNR, we replace ˆA1by B1TX where BT
1 is a part of the least mean square estimation. Then, we apply a QR decomposition on D1= Q1R1and X = QxRx. Finally, one can express Eq. (6) as:
SSN R(V1) =T r(V T 1 (Q T xB1R T 1R1B T 1Qx)V1) T r(VT 1 V1) , (8)
where V1 = RxU1. V1 is therefore obtained from the Rayleigh quotient, whose solution is the concatenation of Nf eigenvectors associated with the Nf largest eigen-values of QT
xB1RT1R1B1TQx [7]. These vectors are esti-mated thanks to a singular value decomposition (SVD) of R1B1TQx= ΦΛΨT, Φ and Ψ being two unitary matri-ces and Λ is a diagonal matrix with nonnegative diagonal elements in decreasing order.
The solution of Eq. (7) provides the spatial filters, which are ordered in decreasing order by relevance im-pact.
ˆ
U1= R−1x Ψ (9) 4.2 SSNR
The evaluation of the SSNR depends on the application of the spatial filters. If the spatial filters are used, it is possible to directly obtain the SSNR thanks to Eq. (7). Indeed we have after simplification:
SSN R(V1) =T r(V T 1 (ΨΛ2ΨT)V1) T r(VT 1 V1) . (10)
By considering again the Rayleigh quotient for V1, the associated solution corresponds to the Nf largest eigen-values of ΨΛ2ΨT, which are Λ2. In addition, the de-nominator can be easily simplified to the trace of the identity of size Nf× Nf, as Ψ and Qxare unitary ma-trices. Therefore, the SSNR of the enhanced signal, i.e. after spatial filtering, can be defined by:
SSN R = T r(Λ2)/Nf. (11) When spatial filters are not used for the evaluation of the SSNR, the SSNR shall be calculated directly by replacing U1 by the identity I:
SSN R = T r( ˆA T
1D1TD1Aˆ1)
T r(XTX) (12) 4.3 Classifier
For the binary classification of P300 and no P300 re-sponses, we consider the Bayesian linear discriminant analysis (BLDA) [12]. This classifier has been proved efficient, it is fast to train and does not require hyper-parameters to adjust [8]. It finds a discriminant vector w such that the distance between the associated vector
of a class c and wTp is minimized when the input vec-tor p belongs to the class c. The vecvec-tor p is obtained by the concatenation of the different time-course signals. For the classification, only the four first components of the enhanced signal are considered (Nf = 4 if Ns≥ 4, Nf = Nsotherwise). This classifier is used for EP 300.
5. DATA AND PROTOCOL EXPERIMENT 5.1 Data acquisition
The EEG signal was recorded on 20 healthy subjects (average age=26 ,standard deviation=5.7) [11]. For testing the different subset evaluations methods, we con-sider two sessions: one for training the classifier, the other for testing. For the training and test sessions, the subject had to write 50 and 60 characters respectively. Each row and column in the spelling matrix was ran-domly intensified for 100ms. The delay between two consecutive intensifications was 70ms for the training (resp. 130ms for the test), leading to an interstimulus interval (ISI) of 170ms for the training session (resp. 230ms for the test). For each symbol, the number of epochs was 10 (Nepoch= 10).
5.2 Pre-processing
The EEG signals are sampled at 100Hz. Before process-ing the data, they were first filtered by bandpass filter with cut-off frequencies at 1Hz and 20Hz. The signal was then down sampled to obtain 25 sampling points per second. For each sensor, the signals were then nor-malized as to have a zero mean and standard deviation equal to one.
Although the spatial filters and the classifier can be used independently as a cost function during the back-ward elimination, we always use spatial filters for en-hancing the signals before training the classifier once the sensor subset are defined. Indeed, this method has been shown efficient in previous works [15, 14].
6. RESULTS
Figure 2 presents the accuracy on the test database for each subset evaluation method and for different sizes of subset. The selection methods that do not consider the spatial filters (C1, C2 and C3) provide the worst results (between 66.42% and 89.58% for a subset of eight sen-sors). With eight sensors, the average recognition rate of the speller is 94.92%, 94.00% and 93.00% for the se-lection with C4, C5 and C6 respectively. These results suggest that eight sensors suffice and provide good re-sults. With 32 sensors, the recognition rate of the speller is 95.83%. From 8 to 32 sensors, the gain in peformance is less than 1%, showing the relevance of the method for sensor selection. For eight sensors, the impact of the spatial filters in the sensor subset evaluation is 5.34%, 11.25% and 26.58% for C4, C5 and C6 respectively, sug-gesting that the criterion based on the SSNR is less de-pendant to the spatial filters. It also proves that spatial filtering has a critical impact on the selection of suitable sensors. Finally, C4 is sufficient for creating suboptimal sets of sensors. This criterion based of SF+SSNR can be done in one step thanks to the xDAWN algorithm. It avoids considering further steps like the EP 300 and/or
ESpeller, which increase the complexity of the sensor se-lection procedure and provide less relevant sensors.
0 8 16 24 32
40 60 80 100
Number of selected sensors (N
ss) Classification accuracy [%] C1 C2 C3 C4 C5 C6
Figure 2: Accuracy of the P300 speller in relation to the number of selected sensors, after 10 epochs.
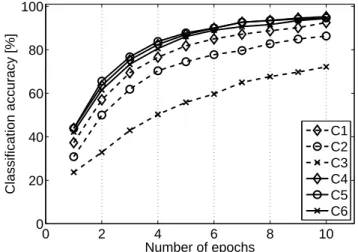
The accuracy of the P300 speller in relation to the number of epochs is presented in Fig. 3. While the per-formance naturally decreases in relation to the number of epochs, the accuracy remains acceptable till about five epochs. The best performance are always produced with C4 and C5. 0 2 4 6 8 10 0 20 40 60 80 100 Number of epochs Classification accuracy [%] C1 C2 C3 C4 C5 C6
Figure 3: Accuracy of the P300 speller in relation to the number of epochs, for 8 selected sensors.
The evolution of the sensor selection criterion over the number of selected sensors is presented in Fig. 4. The selection criterion value decreases in relation to the number of remaining sensors in the backward elimina-tion, as expected. However, we observe the inverse be-havior when there is no spatial filters. This is probably due to the large size of the input data and the low num-ber of training samples. With pre-processing, feature reduction improves the accuracy for the selected clas-sifier. The evolution of the values for C1 and C4 also decreases in relation to the number of remaining sensors during the backward elimination. In addition, the use
of spatial filters in C4 allows keeping the SSNR higher while decreasing the number of sensors. The impact of the spatial filters is higher when the number of remain-ing sensors is low as the gap between C1 and C4 is large.
0 8 16 24 32 0 20 40 60 80 100
Number of selected sensors (N
ss) Classification accuracy [%] C2 C3 C5 C6
(a) Recognition rate
0 8 16 24 32 0 0.05 0.1 0.15 0.2 0.25
Number of selected sensors (N
ss)
SSNR
C1 C4
(b) SSNR
Figure 4: Evolution of the different criteria in relation to the number of selected sensors.
7. CONCLUSION AND PROSPECTS Several strategies for the sensors subset evaluation of a P300-BCI speller have been evaluated. The best strate-gies always consider spatial filters. In addition, the two best methods are based on the evaluation of the SSNR and the P300 recognition, showing that it is useless to take into account the speller stage. While the SSNR and the P300 recognition provide both equivalent re-sults, both consider spatial filters based on the xDAWN algorithm. Hence, the SSNR is directly computed dur-ing the creation of the spatial filters whereas the P300 classification requires several training and testing. It shows that the evaluation of the SSNR with spatial fil-tering (C4), which can be done in one step, is sufficient for creating suboptimal sets of sensors, i.e. suboptimal sets of features for the classifier. This strategy allows avoiding further processing while keeping good perfor-mance.
Preliminary analysis of the ranks of each sensor ob-tained with C4 evaluation suggest that several sensors are common to every subject. For the different subsets of eight sensors, which are personalized to each subject,
five sensors are common to half of the subjects. These sensors are mostly located on the occipital area, con-firming previous works suggesting that occipital sites are relevant [5, 9]. Further works will treat the selection of universal sensor locations, a common subset that pro-vides high accuracy for the majority of individuals.
REFERENCES
[1] Algorithms and Theory of Computation Handbook. CRC Press LLC, 1999.
[2] N. Abe, M. Kudo, J. Toyama, and M. Shimbo. Classifier-independent feature selection on the basis of divergence criterion. Pattern Anal. Appl., 9(2):127–137, 2006.
[3] B. Z. Allison, E. W. Wolpaw, and J. R. Wolpaw. Brain-computer interface systems: progress and prospects. Expert Review of Medical Devices, 4(4):463–474, 2007. [4] N. Birbaumer and L. G. Cohen. Brain-computer
inter-faces: communication and restoration of movement in paralysis. Journal of Physiology-London, 579(3):621– 636, 2007.
[5] H. Cecotti and A. Gr¨aser. Time delay neural net-work with Fourier Transform for multiple channel de-tection of steady-state visual evoked potential for brain-computer interfaces. In Proc. EUSIPCO, 2008. [6] L. Farwell and E. Donchin. Talking off the top of your
head: toward a mental prosthesis utilizing event-related brain potentials. Electroencephalogr. Clin. Neurophys-iol., 70:510–523, 1988.
[7] G. H. Golub and C. F. Van Loan. Matrix Computation. 3rd ed. Johns Hopkins University Press, 1996.
[8] U. Hoffmann, J. Vesin, K. Diserens, and T. Ebrahimi. An efficient P300-based brain-computer interface for disabled subjects. Journal of Neuroscience Methods, 167(1):115–125, 2008.
[9] D. J. Krusienski, E. W. Sellers, D. McFarland, T. M. Vaughan, and J. R. Wolpaw. Toward enhanced P300 speller performance. Journal of Neuroscience Methods, 167:15–21, 2008.
[10] F. Lotte, M. Congedo, A. Lecuyer, F. Lamarche, and B. Arnaldi. A review of classification algorithms for EEG-based brain-computer interfaces. Journal of Neu-ral Engineering, 4:R1–R13, 2007.
[11] E. Maby, G. Gibert, P.-E. Aguera, M. Perrin, O. Bertrand, and J. Mattout. The OpenViBE P300-Speller scenario: a thorough online evaluation. In Hu-man Brain Mapping Conference, 2010.
[12] D. J. C. MacKay. Bayesian interpolation. Neural Com-put., 4(3):415–447, 1992.
[13] K.-R. M¨uller, M. Tangermann, G. Dornhege, M. Krauledat, G. Curio, and B. Blankertz. Ma-chine learning for real-time single-trial EEG-analysis: From brain-computer interfacing to mental state monitoring. J Neurosci Methods, 167(1):82–90, 2008. [14] B. Rivet, A. Souloumiac, V. Attina, and G. Gibert.
xDAWN algorithm to enhance evoked potentials: appli-cation to brain-computer interface. IEEE Trans Biomed Eng., 56(8), 2009.
[15] B. Rivet, A. Souloumiac, G. Gibert, and V. Attina. P300 speller brain-computer interface: Enhancement of P300 evoked potential by spatial filters. In Proc. EU-SIPCO, 2008.