HAL Id: hal-01411472
https://hal.sorbonne-universite.fr/hal-01411472
Submitted on 7 Dec 2016
HAL is a multi-disciplinary open access archive for the deposit and dissemination of sci-entific research documents, whether they are pub-lished or not. The documents may come from teaching and research institutions in France or abroad, or from public or private research centers.
L’archive ouverte pluridisciplinaire HAL, est destinée au dépôt et à la diffusion de documents scientifiques de niveau recherche, publiés ou non, émanant des établissements d’enseignement et de recherche français ou étrangers, des laboratoires publics ou privés.
Hydration in silica based mesoporous materials: a DFT
model
Maciej Gierada, Ivan Petit, Jaroslaw Handzlik, Frederik Tielens
To cite this version:
Maciej Gierada, Ivan Petit, Jaroslaw Handzlik, Frederik Tielens. Hydration in silica based mesoporous materials: a DFT model. Physical Chemistry Chemical Physics, Royal Society of Chemistry, 2016, pp.32962-32972 �10.1039/C6CP05460A�. �hal-01411472�
Hydration in Silica Based Mesoporous Materials; A DFT
Model
Maciej Gieradaa,* Ivan Petitb, Jarosław Handzlika, Frederik, Tielensb,*
a Faculty of Chemical Engineering and Technology, Cracow University of Technology,
ul. Warszawska 24, 31-155 Kraków, Poland
b Sorbonne Universités, UPMC Univ Paris 06, UMR 7574, Laboratoire Chimie de la Matière Condensée,
Collège de France, 4 place Jussieu, 75252 Paris Cedex 05, France
AUTHOR INFORMATION Corresponding Author:
ABSTRACT
MCM-41 material is very commonly used as a support for catalysts. However, theoretical investigations are significantly limited due to the lack of appropriate models that well and accurately describe the real material and enable effective computation at the same time. In this work, our aim is to obtain calculable models at the DFT level of MCM-41 which are as close as possible to the real material. In particular the hydration degree has been investigated, and we present and characterize here for the first time a model for the MCM-41 unit cell filled with explicit solvent water molecules. This is particularly important, because the models developed here are aimed to be further applied in theoretical ab initio/DFT studies of adsorption or as a support for modelling active sites in catalysts.
INTRODUCTION
Silicon dioxide or silica is the most common mineral on Earth. Its application is therefore very attractive and stimulated in many applications, beside its use in construction materials such as cement and glass, it is important in catalysis in which it is used as a support and in chromatography, electronic devices, but also in food, pharmaceutical applications and in biomineralization.1 Different reviews summarize its chemical
properties.2–4 An important feature of silica is the existence of a large variety of polymorphs composed of
SiO4 tetrahedra. The high flexibility of the Si-O-Si bond, with a bending energy barrier about 4 kJ/mol5 is
responsible for the great number of existing polymorphs, either natural or synthetic: several crystalline forms such as quartz, cristobalite, tridymite, diatomite, and edingtonite, noncrystalline glasses or sol-gel phases, and micro/mesoporous materials. In this study we focus on the amorphous polymorphs, which alike other amorphous materials are a challenge for modeling.
The silica surface shows undercoordinated atoms, such as three coordinated Si atoms, terminal oxygens, and strained Si-O-Si bridges in small size 2 and 3-membered rings. These silica defects react with water in ambient conditions to form surface hydroxyl groups called silanols3,6,7 which can make the surface
hydrophilic. In contrast, a non-defective clean SiO2 surface is hydrophobic.8–11
Due to the amorphous nature of silica, the classical diffraction techniques cannot be used to give structural information. Yet its surface exhibits a rich diversity of chemical groups.
There are different types of silanols that exist on top of silica surface which are schematically presented in the Figure 1. The first general distinction is between the single and geminal silanols. Single silanols are bound to a Si atom involved in three Si-O-Si siloxane groups, whereas geminal silanols complete the coordination sphere of a Si atom involved in two siloxane groups. Silanols can be also associated with H-bond interaction with other silanols or siloxane bridges. Although many authors9,10,12–14 discriminate
vicinal silanols as one of the existing types of SiOH groups, their exact definition is sometimes different in different papers9,12 and spectroscopic characterization is rather poorly established. Because of that, we
are not distinguishing and discussing vicinal silanols in this paper. We treat vicinal silanols as single, since they have one -OH group attached to Si atom, in contrast to geminal silanols (Fig. 1).
The most important chemical functions of amorphous silica, surface silanols on the surface, have been characterized mainly by means of vibrational spectroscopies and NMR: IR15,16, Raman17,18 and 29Si MAS,
CP-MAS9,19–22 and 1H MAS23–30 NMR.
The silanol SiO-H stretching frequencies of H-bonded silanols are observed around 3550 cm-1, while
isolated silanols vibrate between 3747-3750 cm-1.2,3,15 Theoretical studies have complemented the lack of
information using different approaches. First, force field calculations have allowed to propose large size models (several thousands of atoms) of amorphous silicas, which have been validated with experimental data such as Si-O-Si angles, Si-O bond lengths, and ring size distributions.31–41 The bulk, surfaces, and
their reactivity toward water to generate a hydroxylated surface have also been studied.14,31,32,42–50 Second,
ab initio calculations combined or not with classical MD (molecular dynamics) to understand adsorption
sites and the chemical reactivity of the anhydrous surface14,44 and hydroxylated amorphous silica14,49 have
been performed as well.
An interesting example of amorphous silica are the mesoporous ordered materials, such as MCM-41.51–53
This material is described by a hexagonal array of roughly cylindrical, straight, unconnected pores which diameter can be engineered. Mesoporous structures usually have a high surface area, as well as a high pore volume, which make them very attractive as catalytic supports. MCM-41 can also be used to adsorb different molecules, including biomolecules, in confined spaces.54 Nowadays, this material is very
commonly used as a support for nano-objects. However, theoretical investigations are significantly limited due to the lack of appropriate models that well and accurately describe the real material and enable effective computation at the same time.
In this work, our aim is to obtain calculable models of MCM-41 which are as close as possible to the real material. This is particularly important, since we aim to use the developed models here to be further applied in theoretical studies of adsorption or as a support for modelling active sites in catalysts. In 2008 one of us presented, characterized and verified a full DFT amorphous hydroxylated silica model,55 which was
recently successfully employed in computational studies of Cr,56–58 Mo,59 W,60 V,61 Nb62 and Au63,64 oxide
centers on SiO2. Other examples of applications were also investigated in the field of adsorption of
bio-organic molecules,65–67 surfactants,68 and ionic liquids.69,70 Here, we are using this previously developed
silica slab55 to prepare mesoporous structures. Although some models of MCM-41 material were postulated
in the literature so far, all of them, beside one, are limited to molecular mechanics and kinetic Monte Carlo techniques.71–74 Only Ugliengo et al.75,76 studied MCM-41 at DFT level (B3LYP), however, the model
developed by the authors is characterized by the high silanol density (7.2 OH nm-2), which seems to be too
high to account for adequate representation of the real MCM-41 surface. That model has been recently redefined including dispersion interactions and used in the static77,78 and AIMD78 studies of drug molecules
adsorption in confined spaces, however, the silanol density remain unchanged. One should note that small cluster models of mesoporous material studied at B3LYP level were also published,79 but they are far from
being realistic.
In this work, six realistic models of MCM-41 mesoporous material, characterized by different degrees of hydroxylation, expressed as a function of their silanol density, are reported. More specifically, models with the 5.8, 5.8 with H2O inside the pores, 4.8, 3.6, 2.3 and 1.7 OH nm-2 (models A, B, C, D, E and F,
respectively) are studied. Those models describe MCM-41 surface at different temperatures and/or water vapor pressures. It is worth to emphasize here that such a comprehensive and extensive DFT study on modeling of MCM-41 structure have never been done before.
COMPUTATIONAL DETAILS
The geometry optimization was performed using Pardew-Burke-Ernzerhof (PBE) functional80
implemented in Vienna Ab Initio Simulation Package (VASP).81–83 This functional was previously
successfully used to model amorphous silica structure.55 The electron-ion interaction was described by the
projector augmented-wave (PAW) method.84,85 Standard PAW atomic parameters were used with a cutoff
energy of 400 eV. To account for dispersion interactions, single point energy calculation were performed at PBE-D3(BJ) level.86,87 To determine harmonic vibrational frequencies, Hessian matrix was calculated
by the finite difference method, i.e., each relaxed ion was displaced in the direction of each Cartesian coordinate and the Hessian was determined from the forces. Taking the limited computational power into account, as well as the size of our models, only silanols, i.e., Si-OH groups, was considered in the Hessian matrix. For the graphic presentation of the models developed, Materials Studio 5.5 software was applied.88
To obtain model B, where water molecules are inside the pores, Packmol package89,90 was used. Packing
procedure were done with the initial water-water and water-MCM-41 distance of 2 and 3 Å, respectively. In some cases, several H2O molecules had to be displaced manually, in order to obtain optimizable
geometry of the whole system. Then, a full relaxation of such model were performed with the fixed unit cell parameters.
The dehydroxylation energy Edeh(T0) of removing water molecules from the high hydroxylated surface
to obtain models with lower silanol density was calculated adopting the following equation (1):
∆𝐸𝑑𝑒ℎ(𝑇0) = 𝐸𝑖(𝑇0) + 𝑛𝐸𝑤𝑎𝑡𝑒𝑟(𝑇0) − 𝐸𝐴(𝑇0) (1)
where Ei(T0) and EA(T0) are the PBE-D3(BJ) energies at T = 0 K of partially dehydroxylated (C-F) and
dehydroxylation step and Ewater(T0) is the PBE-D3(BJ) energy at T = 0 K of an isolated water molecule
calculated using the same unit cell dimensions as in the case of MCM-41 models.
To account for temperature and water partial pressure dependence, the Gibbs energies Gdeh(T,p) were
estimated assuming that differences between the Gibbs energies for condensed phases are equal to the differences in their calculated electronic energies and only contributions to enthalpy and entropy of gas water molecule are included (equation 2), following the procedure described by Digne et al.91:
∆Gdeh(T, pH2O) = ∆Edeh(T0) + n [∆gwater(T, p0) + RTln (ppH2O
0 )] (2)
where p0 = 1 atm, T0 = 0 K, R – gas constant and gdeh(T,p0) is the Gibbs energy correction for H2O
molecule calculated from statistical thermodynamics using PBE functional80 combined with
def2-QZVPPD basis set92 implemented in Gaussian 09 set of programs.93
AIMD simulations were also carried out with the package CP2K/Quickstep,94 consisting in
Born-Oppenheimer MD (BOMD) PBE electronic representation including Grimme (D3) correction for dispersion,86 GTH pseudopotentials,95,96 a combined Plane-Wave (300 Ry density cutoff) and TZVP basis
sets. The BOMD are performed using the NVT ensemble. The Nosé-Hoover thermostat is used to control the average temperature at 300 K. Trajectories are accumulated 8 ps (whom 3 ps of equilibration) with a time step of 0.5 fs.
RESULTS AND DISCUSSION The structural properties
Table 1. Properties of the models of MCM-41 material
Model Exp.
property A B F
unit cell parameters (Å) a = 36.29 b = 36.96 c = 11.60 a = 36.29 b = 36.96 c = 11.60 a = 36.29 b = 36.96 c = 11.60 angles (°) = 90.46 = 91.60 = 61,36 = 90.46 = 91.60 = 61,36 = 90.46 = 91.60 = 61,36 pore diameter (Å) 27-32 27-32 28-33 25-40b wall thickness (Å) 6-8 6-8 5-8 7-30c wall density (g cm-3) 2.8 2.8 2.5 2.7-3.0d 2.15e
T-site density (T-site nm-3) 8.6 8.6 8.6
T-site density of the wall (T-site nm-3) 25.4 25.4 24.1 27d molecular formula Si117O269H70 117 SiO2 35 H2O Si117O482H496 117 SiO2 35 H2O + 213 H2O Si117O244H20 117 SiO2 10 H2O
mass of unit cell (g mol-1) 7660 11498 7210
silanols density nm 5.8 5.8 1.7 number of silanols 70 70 20
single 62 62 20
geminal 8 8 0
silanols involved in H-bonda 40 67 7
a H-bond cutoff (O-H distance): 2.20 Å; b Ref 51–53,79,97–103; c Ref 51–53,79,98,99,102,103; d Ref
72 e Ref 104
Experimental studies show that pore diameter of MCM-41 material can be tailored in a wide range of values starting from 15 up to 100 Å,51 depending on different factors, such as the surfactant used, pH of
the solution, etc. However, typically the pore diameter for MCM-41 is 25 – 40 Å.51–53,97–103 Taking these
data into account, we designed the pores in our models with a diameter (including silanols) between 27 – 33 Å. This range also well corresponds to other theoretical studies.71–75 Hence, our first model of
MCM-41 material (A) was obtained by connecting three identical, slightly modified amorphous silica slabs55 and
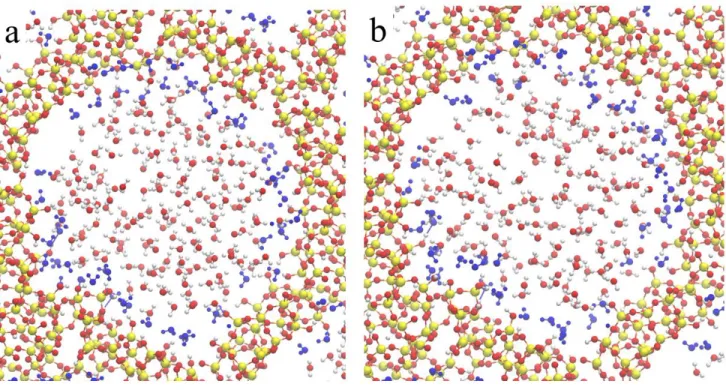
putting them into one hexagonal supercell (initial parameters a = b = 40 Å, c = 13 Å, = 60°), forming a Y-type structure with an angle between the slabs of about 120° (Figure 2). The empty space between three junctions (not connected slabs) was replaced by the SiO2 entities – forming a materialized connection
within the junction areas and creating mainly four, five and six-membered -O-Si-O-Si-O- rings since they dominate on the surface of hydroxylated amorphous silica. This was performed manually. To obtain an optimizable model, some atoms were removed, added or there positions were changed. Eventually, the model constructed counts 456 atoms including 117 SiO2 units and 35 H2O molecules (Si117O269H70). Then,
the positions of all atoms were fully relaxed together with the unit cell dimensions, in order to minimalize energy of our new structure. Finally, the obtained model is characterized by the unit cell parameters of about 36 Å × 37 Å × 12 Å. The detailed information is given in the Table 1, whereas Figure 3 shows the hexagonal array of cylindrical pores obtained after multiplication of the unit cell.
Figure 2. Detailed view of atoms belonging to the unit cell: model A (5.8 OH nm-2), model B (5.8 OH nm-2 with water adsorbed
inside the pores) and model F (1.7 OH nm-2) of MCM-41 mesoporous material.
Figure 3. Hexagonal array of the cylindrical pores in the model A of MCM-41 mesoporous material: (A) 2D top view of the
4x4x1 unit cell, (B) 3D view of the 3x2x4 unit cell
It is well known that the walls of the real MCM-41 material are amorphous. Our models represent that feature, since we used our previously developed silica slab55 which is amorphous. This previous model is
used here as a building block and accounts for the experimentally encountered ring size distribution, Si-O-Si and O-Si-O-Si-O angles, silanols density, and silanols distribution of amorphous silica.
The wall thickness of our model A varies between 6 – 8 Å, which is comparable with the experimental data (7 – 30 Å).51–53,98,99,102,103 Moreover, based on Monte Carlo simulations and experimental
investigations, Maddox et al.71 suggested that the wall thickness of MCM-41 material is approximated to
be smaller than 10 Å.
As far as the T-site (SiO4 tetrahedron) density is concerned, a value of 8.6 T-site nm-3 is calculated, which
correlates well with the models proposed by Ugliengo et al.75 (8.2 T-site nm-3). It is also in accordance with
previous models obtained through molecular mechanics or kinetic Monte Carlo simulation.71–74
Nevertheless, T-site density of the wall was also measured, i.e., density without including the volume of the pores, yielding 25.4 T-site nm-3. This value is in agreement with the experimentally determined density
for MCM-41 (27 T-site nm-3).72 The calculated T-site density of the wall corresponds to wall density of
A B F
a
b
about 2.8 g cm-3.105 The wall density of MCM-41 reported in other experimental72,104 and theoretical72,74
works are found to be in a range of 2.15 – 3.0 g cm-3, thus close to the results of our calculations.
An important structural property, that each model of amorphous silica should well predict, is the distribution of the siloxane ring sizes. Our model contains mainly four, five and six-membered rings, however, one can find some larger rings, i.e., containing seven and higher amount of SiO4tetrahedra
(Figure 4). The small three-membered rings are also present but they are (should be) in minority due to their high reactivity. As expected, two-membered rings are not seen, since they are too strained.4,55,106
The average Si-O-Si distance in model A is about 1.64 Å, in agreement with the experimental data. For amorphous silica, the experimentally measured Si-O-Si distance is about 1.62 Å107 whereas for MCM-41
it is about 1.60 – 1.61.108–110
Similarly like in the case of our amorphous silica slab,55 the Si–O–Si angles range from nearly 103° up to
almost 180°. Smaller angles are related to the smaller rings, or they are caused by the deformation of the four- five- and six-membered ones. These results correlate well with the broad distribution of the Si–O–Si angle.5,108,109
The crucial feature of each type of silica, including also MCM-41, is the characteristics of the surface silanols, since they are responsible for chemical properties of the surface. Model A, with a surface silanol density of 5.8 OH nm-2, corresponds to our previous amorphous silica slab.55 The reported surface silanol
density fits to the experimentally estimated amount of silanol groups on a hydroxylated surface of amorphous silicas at ambient conditions (4.1 – 6.1 OH nm-2).12,111 It is also close to the values reported
explicitly for MCM-41 material at room temperature (RT), which is in the range of 4.4 ± 0.5 OH nm-2.13
Our next model (B) with 4.8 OH nm-2 fits even better to the experimentally determined silanols density,
however, the one with 5.8 OH nm-2 can be defined as a fully hydroxylated MCM-41 structure that is stable
at RT and spontaneously decomposes at elevated temperatures to give surface with 4.8 OH nm-2 (vide
infra). In contrast, Ugliengo et al.75 developed MCM-41 model having 7.2 OH nm-2
, whichseems to be too
high to account for adequate description of hydroxylated surface of this mesoporous silica material, especially at higher temperatures.
As far as different silanols types is concerned, about 89% of all Si-OH groups in the model A are single silanols and 11% are geminal (Table 1), in accordance with the experimental estimation of germinal silanols (13%) on the surface of amorphous silica at 453 K12,111. Among all 70 silanols, 40 are involved in
H-bond contact (57%), which is also consistent with the experimental data (61%).12,111 The Si-OH distances
on selected sites in the different models are reported in Figure 5. The effect of dehydroxylation and thermodynamics
To simulate surface of MCM-41 material at different temperatures and water partial pressures, we developed models with 4.8, 3.6, 2.3 and 1.7 OH nm-2 (models C-F), by removing 6, 13, 21, and 25 water
molecules, respectively, relatively to the model A. The partial dehydroxylated models of MCM-41 material (C-F) were not arbitrary modelled, but can always be obtained from more hydroxylated ones by elimination of several H2O molecules. The nearest hydroxyls were condensed first to form siloxane bridges and H2O
molecules. We started removing silanols that were involved in H-bond interaction and then - if it was necessary, non-H-bonded silanols - until the desired silanol coverage was achieved. Hence, we obtained
our dehydroxylated models based on distance criteria only. Similar approach was used by other authors as well.14,75
Dehydroxylation of silica surface, including mesoporous structures, occurs over a wide range of temperature,12,13,111,112 so, the energy of each dehydroxylation step depends on the local environment of the
leaving silanol group. Otherwise, all silanols would condense in a much narrower range. In particular, the amount of water molecules released form the surface as a result of silanols condensation should affect dehydroxylation energy, i.e., the more dehydroxylated model, the higher Edeh. Indeed, according to our
calculations (Table 2), the average energy required to remove H2O molecule from the model A (5.8 OH
nm-2) to give model C (4.8 OH nm-2) is 42 kJ/mol, whereas to obtain the calcined model (model F) (1.7
OH nm-2) from model A is 137 kJ/mol. One should note that Ugliengo et al.75 observed similar trend for
dehydroxylation of silica surface.
Table 2. Average dehydroxylation energy normalized per H2O molecule (avEdeh, kJ mol-1) for each dehydroxylation step. The
first four rows are the average energies relatively to model A. The last three rows are the average energies for each step reaction avEdeh A C + 6 H2O 42 A D + 13 H2O 81 A E + 21 H2O 128 A F + 25 H2O 137 C D + 7 H2O 115 D E + 8 H2O 205 E F + 4 H2O 180
Figure 6 Diagrams (Gibbs energy of dehydroxylation vs. temperature) showing stability of each dehydroxylated models of
MCM-41 material at different water partial pressure: a) 10-2 atm, b) 10-5 atm c) 10-9 atm.
b c
Figure 6 shows the stability of each dehydroxylated model of MCM-41 studied, in terms of Gibbs energy of dehydroxylation as a function of temperature and pressure. The water partial pressure equivalent to ambient air water partial pressure was chosen equal to 10-2 atm.113 Additionally, the stability of each model
is also presented at 10-5 atm and 10-9 atm. Considering dehydroxylation at 10-2 atm (Figure 5 a),
dehydroxylation of model A may occur to generate a surface with 4.8 OH nm-2 (model C), which is stable
above 460 K. At about 620 K, formation of the surface having 3.6 OH nm-2 (D) becomes
thermodynamically favored. Further temperature increasing up to above about 800 K facilitates formation of more dehydroxylated model E with the silanols density of 2.3 OH nm-2. Finally, the calcined surface
(model F), characterized by the silanols coverage of 1.7 OH nm-2, is stable above 820 K. These results are
in good agreement with the experimental studies of Zhuravlev12,111 on amorphous silica, as well as Gallas
et al.13 explicitly for MCM-41. One should note that surface of amorphous silica is not the same as surface
of mesoporous material, however, the silanols coverage at different temperatures in both cases are quite close to each other. Additionally, for MCM-41 the most of data are related to the silanols density after high-temperature calcination, which is usually carried out at about 800-900 K. For that temperatures, experimentally determined silanols density is about 1.6 - 2.3 OH nm-2,13,79,100,102,114 however, 0.8 OH nm -2,115 as well as up to 3 OH nm-2 112 is also reported. At lower water partial pressure (Figure 6 b, c), which
are more typical in experimental studies13,79, stability of our models are shifted towards lower temperatures.
One should note that the presented values are reported for equilibrium state which might be hardly achievable during experiments.
The basic properties of each dehydroxylated models do not change significantly. Because of that, we will only discuss here the calcined model F (Figure 2).
After releasing 25 water molecules form A the pore size diameter (including silanol groups) becomes slightly longer, wall density is smaller, whereas wall thickness remains almost unchanged (Table 1). This is in agreement with the high number of silanol pairs which were removed from the surface. Experimental studies suggest12,111 that most of silanols that still remain on the surface after high temperature calcination
are isolated (non-H-bonded). This well agrees with our results (Table 1) where among all 20 silanols, only 35% are involved in H-bond contact with neighboring siloxane bridges. Additionally, none of the silanols interact with other Si-OH groups, because they are well dispersed now. According to our model, geminal silanols are not presented on the surface at high temperature, in agreement with the experimentally determined dominance of single silanols.78
Silanols condensation increases number of -O-Si-O-Si-O- rings in the MCM-41 material. Our calculations suggest, that after high-temperature calcination, mainly three-, four- and five- membered rings are formed, whereas number of larger rings remains almost unchanged, in comparison to the model A (Figure 4). A
few strained two-membered rings are also present. Nevertheless, the ring size distribution is similar to that for the model A with 5.8 OH nm-2.
The solvated model
Having prepared several models of MCM-41 material, which describe properties of this mesoporous silica at different temperatures, next we study this system with water molecules adsorbed inside the pores. To this end, the pores of previously developed model A (stable at RT) were filled with 213 water molecules randomly oriented and located. The number of water molecules corresponds to the experimentally determined amount of H2O adsorbed in cylindrical pores of MCM-41 material (about 0.5g H2O/1g
MCM-41) 115. Hence, including the average pore size diameter of about 30 Å, the density of water in the pores is about 0.7 g cm-3. The obtained value is quite close to the results of other studies.113 Then, the whole
system was fully relaxed with fixed unit cell dimensions. As a result, model B with the molecular formula Si117O482H496 (1095 atoms in unit cell) were obtained (Figure 2). In this model, the same unit cell
dimensions, silanols density, silanols type distribution, pore diameter, wall thickness, wall density and geometric parameters was found as for model A (Table 1).
As expected, most of the 30 non-interacting silanols of the model A are now (model B) involved in H-bond contact with water molecules, either as a donor or an acceptor of hydrogen H-bond. After filling the pores with the water molecules, most of the remaining 40 silanols, which were involved in H-bond interaction with other silanols or siloxane bridges in the model A, still remain interacting with each other (model B). Nevertheless, some of them are also able to create new H-bond with water molecules, finally giving 37 silanols on a total 70, on which the water is adsorbed. Further analysis showed that 7 silanols are able to interact with two water molecules at once and none with more than two. Water molecule can be also adsorbed on two neighboring silanols (two H2O molecules in our model). It is clear that as far as the
water silica interface is concerned a molecular dynamics study should be performed similar to our former studies on a silica slab model.105,116
The average binding energy of H2O molecule in the model B is 54 kJ/mol, whereas in recent paper55 it was
46-50 kJ/mol. Hence, the results obtained for MCM-41 models and silica slab are comparable. Taking dispersion interaction into account, the average binding energy of H2O in the model B is 64 kJ/mol.
The vibrational properties
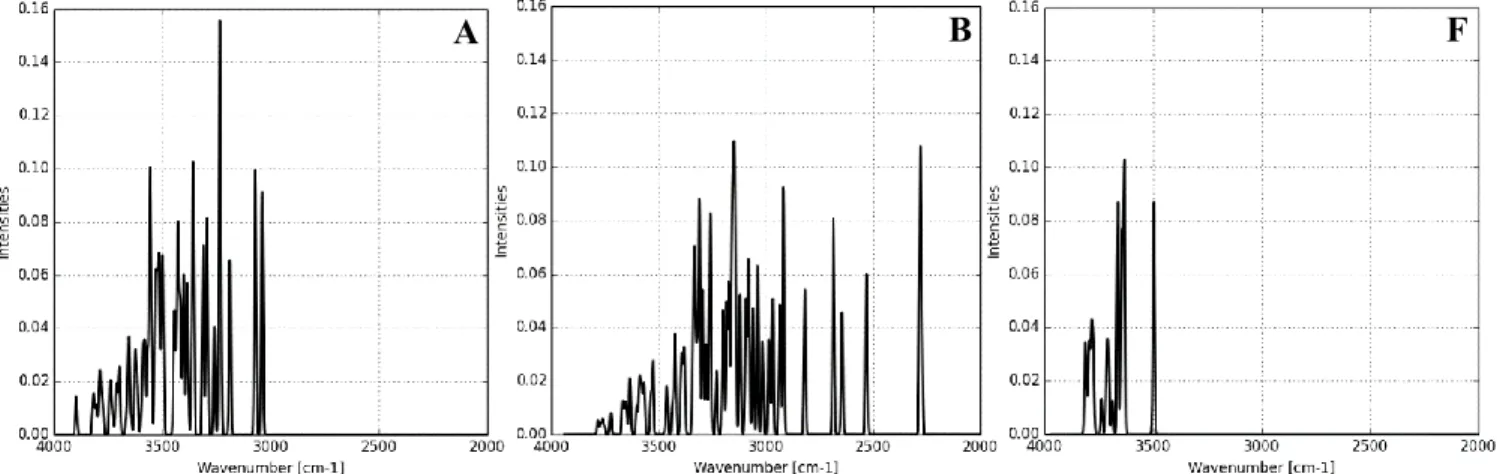
In order to further verify our models of MCM-41 material, we have simulated the IR spectra of systems A, B and F in the extended OH stretching frequencies region (4000 – 2000 cm-1). The obtained results are
we do not scale nor fit the frequencies like it was done elsewhere,75,77,78 so, quantitative comparison with
experiments is a difficult task. On the other hand, more important is the qualitative comparison. In that case, our results simulate very well experimental data, since the position of all bands are in a good agreement with experiments.
Starting from the simulated spectra of model A, it is seen that the OH stretching vibrations occur between 3821 – 3033 cm-1, which can be divided into three domains. The highest values (3821 – 3787 cm-1) are
calculated for non H–bonded silanols. Then, we observe a domain (3787 – 3699 cm-1) corresponding to
either H-bonded acceptor or non-H-bonded silanols. The third domain is the broadest, and lies between 3699 and 3033 cm-1, and corresponds to the H-bonded donor silanols. Additionally, it is also worth to
mention, that each –OH moiety of H-bonded geminal silanols do not vibrate with the same wavenumber, due to different interaction with neighboring silanols. Our results correlates very well with the spectra of real MCM-41 material. Experimentally, sharp bands are observed between 3747–3737 cm-1 which are
assigned to non-H-bonded silanols13,112,118–120, the bands at around 3715 cm-1118,119 to H-bonded acceptor
silanols, whereas the broadest bands, with the maximum at around 3536–3520 cm-1 are assigned to
H-bonded silanols, either acceptors or donors13,118,119.
Figure 7. Simulated IR spectra of model A (5.8 OH nm-2), model B (5.8 OH nm-2 with water adsorbed inside the pores) and
model F (1.7 OH nm-2) of MCM-41 mesoporous material.
For model B (Figure 7) the simulated spectra becomes broader (3776–2207 cm-1). Not surprising, since the
H-bond network is much complex now due to the presence of water. Again, the calculated vibrational frequencies can be divided into three domains. The non-H-bonded silanols vibrate at 3776–3759 cm-1,
whereas silanols that are acceptors of H-bonds, either from other silanols or adsorbed water molecules vibrate at 3759–3525 cm-1. The third domain, occurring over wide range of wavenumbers (3525–2207 cm -1) corresponds to the silanols that are donors of H-bonds to other silanols, siloxane bridges or water
molecules. Hence, after filling the pores of MCM-41 material by water, the OH stretching vibrations becomes redshifted as one may expected. One should note that the bands of H-bonded silanols overlap by
with the signal from water aggregates adsorbed on the surface. The latter are experimentally detected between 3600–2700 cm-1.117
In the case of the model representing MCM-41 material after high-temperature calcination (Figure 2, model F), narrow spectra are simulated (Figure 7), with the OH stretching frequencies region of 3826–3503 cm -1. The bands at 3826–3791 cm-1 correspond to non-H-bonded single silanols, whereas at 3791–3503 cm-1
to silanols being donor of H-bond to siloxane bridges.
Ab Initio Molecular Dynamics investigation of the interfacial water layer.
In the static models, after optimization, no information is given on the mobility of the water molecules inside the channels. In order to shed some light on the dynamical properties of water, we performed a AIMD including dispersion corrections. One of the questions to ask is: Can we rationalize the water mobility towards its positon in the channel? Previously, the water/SiO2 interface has been studied in detail
at the AIMD level106,117 and at the FFMD level45-48. It is not the aim here to develop this point in detail,
however some remarks are interesting to be mentioned. When DFT results are compared with empiric FF results important differences are observed. Especially the interaction of the water molecules with the surface silanol groups. In DFT studies the “ice like structure” of the first water layer at the surface is observed whereas in FF the water molecules are found to be more mobile. Nevertheless, one should mention here the experimentally observed high affinity of water towards the hydroxylated silica surface, especially observed in when water is competing with amino acids.67 In order to find any explanation one
should answers to questions involving the following parameters: Time scale, FF and functional quality, size of the model, confinement, the silanol density and distribution. Here we present in short our results on the MCM-41 model which agrees, without any surprise with the Silica slab model.55,117
The first water layer is strongly adsorbed on the silica wall of the MCM-41 channel having a silanol density of 5.8 OH/nm-2, as can be seen in Figure 8, the blue colored water molecules in the model stay close to the
Figure 8. Snap shot of the MD at 300K a) when potential energy equilibration is reached (after 3 ps), b) after 6,5 ps equilibration.
The mobility of the first shell of water around the silica is qualitatively very low as is shown in Fig 8. The water molecules of the first shell displayed in blue at the time 3 ps after the equilibration. The snapshot after 6.5 ps shows that the water shell is almost identical to the one after 3 ps.
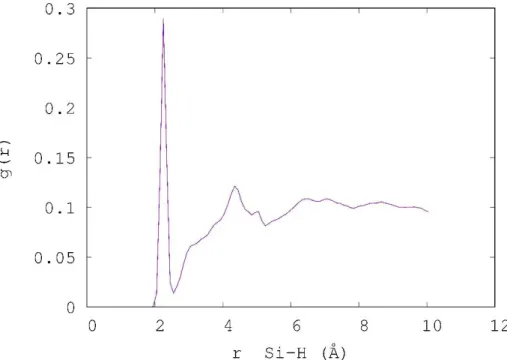
In Figure 9 the distance distribution between silicon and hydrogen atoms is presented. The fist peak around 2.3 correspond to the Si-H distance of the silanol groups. The second peak between 3.3 and 4.5 corresponds to the fist shell of hydration. Its bright is interpreted by the large number of different of silanol groups involving several kinds of hydrogen bonds.
Figure 9.Distance distribution between Si and H atoms in the hydrated model.
The distance distribution between the O and H atoms is presented in Fig 10. The peak around 1 Å corresponds to the SiO-H covalent bonds, the second around 1.8 Å to the hydrogen bonds (water - water and silanol and water), the third at 3.3 Å to Si-O1-H1 … O2-H2 distance.
More details of the AIMD analysis concerning the radial distribution functions can be found in the Supplementary Information.
CONCLUSION
In this work, a series of periodic models are presented to describe properties of MCM-41 mesoporous silica – an important material and a popular catalyst support. We have prepared and verified six models of MCM-41 that follow temperature dependence of silanols density. In particular, models with 5.8, 5.8 with water inside the pores, 4.8, 3.6, 2.3 and 1.7 OH nm-2 have been developed. We have shown that our models
represent very well the surface of real MCM-41 silica, as evidenced by the comparison with available experimental data, and are improved compared with earlier published models70–74. The simulated IR spectra
additionally confirms that our models are realistic. For the first time such comprehensive theoretical studies, including the high level of theory and AIMD, have been performed for MCM-41 material. Comparing our models of MCM-41 material to that published by Ugliengo et al.74 it is worth to note that
in our model the unit cell dimensions as well as the number of atoms belonging to the cell is smaller, and thus more suited for applicative calculations due to less demanding computational power. Hence, we believe the models developed in this work can be applied in further studies of adsorption processes or they can be used in the modelling of the catalyst supports, because they are realistic and enable effective computation in reasonable time.
ACKNOWLEDGEMENTS
This work was supported in part by the National Science Centre, Poland, Project. No. 2015/19/N/ST4/00007 and 2015/19/B/ST4/01836, and by French state funds managed by the ANR within the Investissements d'Avenir programme under reference ANR-11-IDEX-0004-02, and more specifically within the framework of the Cluster of Excellence MATISSE led by Sorbonne Université. HPC resources from GENCI-[CCRT/CINES/IDRIS] (Grant 2015-[x2015082022]) and the CCRE of Université Pierre et Marie Curie are also acknowledged. Other computational resources from PL-Grid Infrastructure are acknowledged as well.
NOTES
The coordinates of all the structures developed in this work are available in the Supplementary Information.
REFERENCES
1 T. Bakos, S. N. Rashkeev and S. T. Pantelides, Phys. Rev. Lett., 2002, 88, 055508–1–055508–4. 2 A. P. Legrand, The Surface Properties of Silicas, Wiley, New York, 1998.
3 R. K. Iler, The Chemistry of Silicas, Wiley, New York, 1979.
4 A. Rimola, D. Costa, M. Sodupe, J. F. Lambert and P. Ugliengo, Chem. Rev., 2013, 113, 4216– 4313.
5 F. Tielens, F. De Proft and P. Geerlings, J. Mol. Struct. THEOCHEM, 2001, 542, 227–237. 6 L. T. Zhuravlev, Langmuir, 1987, 3, 316–318.
7 M. Nishijima, K. Edamoto, Y. Kubota, S. Tanaka and M. Onchi, J. Chem. Phys., 1986, 84, 6458. 8 V. Bolis, B. Fubini, L. Marchese, G. Martra and D. Costat, J. Chem. Soc. Faraday Trans., 1991, 87,
497–505.
9 D. W. Sindorf and G. E. Maciel, J. Am. Chem. Soc., 1983, 105, 1487–1493. 10 A. S. D’Souza and C. G. Pantano, J. Am. Ceram. Soc., 2002, 85, 1499–1504.
11 S. Wendt, M. Frerichs, T. Wei, M. S. Chen, V. Kempter and D. W. Goodman, Surf. Sci., 2004, 565, 107–120.
12 L. T. Zhuravlev, Colloids Surfaces A, 2000, 173, 1–38.
13 J. P. Gallas, J. M. Goupil, A. Vimont, J. C. Lavalley, B. Gil, J. P. Gilson and O. Miserque, Langmuir, 2009, 25, 5825–5834.
14 A. Comas-Vives, Phys. Chem. Chem. Phys., 2016, 18, 7475–7482. 15 B. A. Morrow and A. J. McFarlan, J. Phys. Chem., 1992, 96, 1395–1400.
17 B. Riegel, I. Hartmann, W. Kiefer, J. Groβ and J. Fricke, J. Non-Cryst. Solids, 1997, 211, 294–298. 18 A. Pasquarello and R. Car, Phys. Rev. Lett., 1998, 80, 5145–5147.
19 G. E. Maciel and D. W. Sindorf, J. Phys. Chem., 1980, 102, 7607–7608.
20 S. Léonardelli, L. Facchini, C. Fretigny, P. Tougne and A. P. Legrand, J. Am. Chem. Soc., 1992, 114, 6412–6418.
21 A. Tuel, H. Hommel, A. P. Legrand and E. sz. Kováts, Langmuir, 1990, 6, 770–775. 22 C. C. Liu and G. E. Maciel, J. Am. Chem. Soc., 1996, 118, 5103–5119.
23 H. Eckert, J. P. Yesinowski, L. A. Silver and E. M. Stolper, J. Phys. Chem., 1988, 92, 2055–2064. 24 C. E. Bronnimann, R. C. Zeigler and G. E. Maciel, J. Am. Chem. Soc., 1988, 110, 2023–2026. 25 I.-S. Chuang and G. E. Maciel, J. Am. Chem. Soc., 1996, 118, 401–406.
26 D. R. Kinney, I.-S. Chuang and G. E. Maciel, J. Am. Chem. Soc., 1993, 115, 6786–6794. 27 D. Freude, M. Hunger and H. Pfeifer, Chem. Phys. Lett., 1982, 91, 307–310.
28 S. Haukka, E.-L. Lakomaa and A. Root, J. Phys. Chem., 1993, 97, 5085–5094.
29 D. F. Shantz, J. S. auf der Günne, H. Koller and R. F. Lobo, J. Am. Chem. Soc., 2000, 122, 6659– 6663.
30 J. Trébosc, J. W. Wiench, S. Huh, V. S.-Y. Lin and M. Pruski, J. Am. Chem. Soc., 2005, 127, 3057– 3068.
31 B. P. Feuston and S. H. Garofalini, J. Appl. Phys., 1990, 68, 4830–4836. 32 S. H. Garofalini, J. Non-Cryst. Solids, 1990, 120, 1–12.
33 L. V. Woodcock, C. A. Angell and P. Cheeseman, J. Chem. Phys., 1976, 65, 1565–1577. 34 T. F. Soules, J. Chem. Phys., 1979, 71, 4570–4578.
35 S. K. Mitra, M. Amini, D. Fincham and R. W. Hockney, Philos. Mag. Part B, 1981, 43, 365–372. 36 J. D. Kubicki and A. C. Lasaga, Am. Mineral., 1988, 73, 941–955.
37 E. S. Savoy and F. A. Escobedo, J. Colloid Interface Sci., 2016, 465, 233–241. 38 H. Heinz, Curr. Opin. Chem. Eng., 2016, 11, 34–41.
39 F. S. Emami, V. Puddu, R. J. Berry, V. Varshney, S. V. Patwardhan, C. C. Perry and H. Heinz,
Chem. Mater., 2014, 26, 2647–2658.
40 F. S. Emami, V. Puddu, R. J. Berry, V. Varshney, S. V. Patwardhan, C. C. Perry and H. Heinz,
Chem. Mater., 2016, 28, 406–407.
41 S. Nedd, T. Kobayashi, C. H. Tsai, I. I. Slowing, M. Pruski and M. S. Gordon, J. Phys. Chem. C, 2011, 115, 16333–16339.
42 V. A. Bakaev and W. A. Steele, J. Chem. Phys., 1999, 111, 9803–9812. 43 E. A. Leed and C. G. Pantano, J. Non-Cryst. Solids, 2003, 325, 48–60.
45 D. Laage and W. H. Thompson, J. Chem. Phys., 2012, 136, 044513–1–044513–7.
46 A. C. Fogarty, E. Duboué-Dijon, D. Laage and W. H. Thompson, J. Chem. Phys., 2014, 141, 18C523–1–18C523–10.
47 P. C. Burris, D. Laage and W. H. Thompson, J. Chem. Phys., 2016, 144, 194709.
48 S. Xiao, F. Figge, G. Stirnemann, D. Laage and J. A. McGuire, J. Am. Chem. Soc., 2016, 138, 5551– 5560.
49 A. A. Hassanali and S. J. Singer, J. Phys. Chem. B, 2007, 111, 11181–11193.
50 C. S. Ewing,S. Bhavsar,G. Veser,J. J. McCarthy,and J. K. Johnson, Langmuir 2014, 30,
5133−5141
51 J. S. Beck, J. C. Vartuli, W. J. Roth, M. E. Leonowicz, C. T. Kresge, K. D. Schmitt, C. T. W. Chu, D. H. Olson, E. W. Sheppard, S. B. McCullen, J. B. Higgins and J. L. Schlenker, J. Am. Chem. Soc., 1992, 114, 10834–10843.
52 C. T. Kresge, M. E. Leonowicz, W. J. Roth, J. C. Vartuli and J. S. Beck, Nature, 1992, 359, 710– 712.
53 P. T. Tanev and T. J. Pinnavaia, Science, 1995, 267, 865–867. 54 M. Hartmann, Chem. Mater., 2005, 17, 4577–4593.
55 F. Tielens, C. Gervais, J. F. Lambert, F. Mauri and D. Costa, Chem. Mater., 2008, 20, 3336–3344. 56 H. Guesmi and F. Tielens, J. Phys. Chem. C, 2012, 116, 994–1001.
57 J. Handzlik, R. Gryboś and F. Tielens, J. Phys. Chem. C, 2013, 117, 8138–8149. 58 M. Gierada, P. Michorczyk, F. Tielens and J. Handzlik, J. Catal., 2016, 340, 122–135.
59 H. Guesmi, R. Gryboś, J. Handzlik and F. Tielens, Phys. Chem. Chem. Phys., 2014, 16, 18253– 18260.
60 H. Guesmi, R. Gryboś, J. Handzlik and F. Tielens, RCS Adv., 2016, 6, 39424–39432.
61 M. M. Islam, D. Costa, M. Calatayud and F. Tielens, J. Phys. Chem. C, 2009, 113, 10740–10746. 62 D. C. Tranca, A. Wojtaszek-Gurdak, M. Ziolek and F. Tielens, Phys. Chem. Chem. Phys., 2015, 17,
22402–22411.
63 A. Wojtaszek, I. Sobczak, M. Ziolek and F. Tielens, J. Phys. Chem. C, 2009, 113, 13855–13859. 64 A. Wojtaszek, I. Sobczak, M. Ziolek and F. Tielens, J. Phys. Chem. C, 2010, 114, 9002–9007. 65 D. Costa, A. Tougerti, F. Tielens, C. Gervais, L. Stievano and J. F. Lambert, Phys. Chem. Chem.
Phys., 2008, 10, 6360.
66 D. Costa, F. Tielens, L. Stievano and J. F. Lambert, AIP Conf. Proc., 2009, 1102, 251–256.
67 N. Folliet, C. Gervais, D. Costa, G. Laurent, F. Babonneau, L. Stievano, J. F. Lambert and F. Tielens,
F. Mauri, G. Laurent, C. Bonhomme, C. Gervais, F. Babonneau and T. Azaïs, J. Am. Chem. Soc., 2011, 133, 16815–16827.
69 M.-A. Neouze, M. Kronstein, M. Litschauer, M. Puchberger, C. Coelho, C. Bonhomme, C. Gervais and F. Tielens, Chem. - A Eur. J., 2014, 20, 15188–15196.
70 M.-A. Neouze, M. Kronstein and F. Tielens, Chem. Commun., 2014, 50, 10929–10936. 71 B. P. Feuston and J. B. Higgins, J. Phys. Chem., 1994, 98, 4459–4462.
72 M. W. Maddox, J. P. Olivier and K. E. Gubbins, Langmuir, 1997, 13, 1737–1745. 73 S. Schacht, M. Janicke and F. Schüth, Micropor. Mesopor. Mater., 1998, 22, 485–493.
74 C. Schumacher, J. Gonzalez, P. A. Wright and N. A. Seaton, J. Phys. Chem. B, 2006, 110, 319–333. 75 P. Ugliengo, M. Sodupe, F. Musso, I. J. Bush, R. Orlando and R. Dovesi, Adv. Mater., 2008, 20,
4579–4583.
76 B. Coasne and P. Ugliengo, Langmuir, 2012, 28, 11131–11141.
77 M. Delle Piane, M. Corno, A. Pedone, R. Dovesi and P. Ugliengo, J. Phys. Chem. C, 2014, 118, 26737–26749.
78 M. Delle Piane, M. Corno and P. Ugliengo, Theor. Chem. Acc., 2016, 135, 53–63.
79 M. Ide, M. El-Roz, E. De Canck, A. Vicente, T. Planckaert, T. Bogaerts, I. Van Driessche, F. Lynen, V. Van Speybroeck, F. Thybault-Starzyk and P. Van Der Voort, Phys. Chem. Chem. Phys., 2012, 15, 642–650.
80 J. P. Perdew, K. Burke and M. Ernzerhof, Phys. Rev. Lett., 1996, 77, 3865–3868. 81 G. Kresse and J. Hafner, Phys. Rev. B, 1993, 47, 558–561.
82 G. Kresse and J. Furthmüller, Comput. Mater. Sci., 1996, 6, 15–50. 83 G. Kresse and J. Furthmüller, Phys. Rev. B, 1996, 54, 11169–11186.
84 P. E. Blöchl, O. Jepsen and O. K. Andersen, Phys. Rev. B, 1994, 49, 16223–16233. 85 G. Kresse and D. Joubert, Phys. Rev. B, 1999, 59, 1758–1775.
86 S. Grimme, J. Antony, S. Ehrlich and H. Krieg, J. Chem. Phys., 2010, 132, 154104–154123. 87 S. Grimme, S. Ehrlich and L. Goerigk, J. Comput. Chem., 2011, 32, 1456–1465.
88 Materials Studio v. 5.5, Accelrys Software, Inc.: San Diego CA, 2010. 89 J. M. Martínez and L. Martínez, J. Comput. Chem., 2003, 24, 819–825.
90 L. Martínez, R. Andrade, E. G. Birgin and J. M. Martínez, J. Comput. Chem., 2009, 30, 2157–2164. 91 M. Digne, P. Sautet, P. Raybaud, P. Euzen and H. Toulhoat, J. Catal., 2002, 211, 1–5.
92 F. Weigend and R. Ahlrichs, Phys. Chem. Chem. Phys., 2005, 7, 3297.
93 M. J. Frisch, G. W. Trucks, H. B. Schlegel, G. E. Scuseria, M. A. Robb, J. R. Cheeseman, G. Scalmani, V. Barone, B. Mennucci, G. A. Petersson, H. Nakatsuji, M. Caricato, X. Li, H. P. Hratchian, A. F. Izmaylov, J. Bloino, G. Zheng, J. L. Sonnenberg, M. Hada, M. Ehara, K. Toyota,
R. Fukuda, J. Hasegawa, M. Ishida, T. Nakajima, Y. Honda, O. Kitao, H. Nakai, T. Vreven, J. A. J. Montgomery, J. E. Peralta, F. Ogliaro, M. Bearpark, J. J. Heyd, E. Brothers, K. N. Kudin, V. N. Staroverov, R. Kobayashi, J. Normand, K. Raghavachari, A. Rendell, J. C. Burant, S. S. Iyengar, J. Tomasi, M. Cossi, N. Rega, J. M. Millam, M. Klene, J. E. Knox, J. B. Cross, V. Bakken, C. Adamo, J. Jaramillo, R. Gomperts, R. E. Stratmann, O. Yazyev, A. J. Austin, R. Cammi, C. Pomelli, J. W. Ochterski, R. L. Martin, K. Morokuma, V. G. Zakrzewski, G. A. Voth, P. Salvador, J. J. Dannenberg, S. Dapprich, A. D. Daniels, Ö. Farkas, J. B. Foresman, J. V. Ortiz, J. Cioslowski and D. J. Fox,
Gaussian 09, Rev. D.01, Gaussian, Inc., Wallingford CT, 2009.
94 J. Vandevondele, M. Krack, F. Mohamed, M. Parrinello, T. Chassaing and J. Hutter, Comput. Phys.
Commun., 2005, 167, 103–128.
95 S. Goedecker, M. Teter and J. Hutter, Phys. Rev. B, 1996, 54, 1703–1710. 96 C. Hartwigsen, S. Goedecker and J. Hutter, Phys. Rev. B, 1998, 58, 3641–3662.
97 X. S. Zhao, G. Q. (Max) Lu and G. J. Millar, Ind. Eng. Chem. Res., 1996, 35, 2075–2090. 98 S. Hitz and R. Prins, J. Catal., 1997, 168, 194–206.
99 R. A. A. Melo, M. V Giotto, J. Rocha and E. A. Urquieta-González, Mater. Res., 1999, 2, 173–179. 100 D. Kumar, K. Schumacher, C. Du Fresne von Hohenesche, M. Grün and K. K. Unger, Colloids
Surfaces A, 2001, 187-188, 109–116.
101 P. Michorczyk, J. Ogonowski, P. Kuśtrowski and L. Chmielarz, Appl. Catal. A Gen., 2008, 349, 62– 69.
102 A. Trouvé, I. Batonneau-Gener, S. Valange, M. Bonne and S. Mignard, J. Hazard. Mater., 2012, 201-202, 107–114.
103 B. Nanda, A. C. Pradhan and K. M. Parida, Micropor. Mesopor. Mater., 2016, 226, 229–242. 104 P.-A. Albouy and A. Ayral, Chem. Mater., 2002, 14, 3391–3397.
105 W. Haynes, CRC Handbook of Chemistry and Physics, CRC Press, 2014.
106 M. Pfeiffer-Laplaud, D. Costa, F. Tielens, M. P. Gaigeot and M. Sulpizi, J. Phys. Chem. C, 2015, 119, 27354–27362.
107 R. L. Mozzi and B. E. Warren, J. Appl. Crystallogr., 1969, 2, 164–172.
108 C. Pophal, R. Schnell and H. Fuess, Stud. Surf. Sci. Catal., 1997, 105, 101–108. 109 C. Pophal and H. Fuess, Micropor. Mesopor. Mater., 1999, 33, 241–247.
110 M. Ookawa, K. Kawamura and T. Yamaguchi, Stud. Surf. Sci. Catal., 2004, 154, 1478–1484. 111 L. T. Zhuravlev, Colloids Surfaces A, 1993, 74, 71–90.
112 X. S. Zhao, G. Q. Lu, A. K. Whittaker, G. J. Millar and H. Y. Zhu, J. Phys. Chem. B, 1997, 101, 6525–6531.
Meteorological and Physical Tables, 1896.
114 V. Kocherbitov and V. Alfredsson, J. Phys. Chem. C, 2007, 111, 12906–12913. 115 S. Ek, A. Root, M. Peussa and L. Niinistö, Thermochim. Acta, 2001, 379, 201–212. 116 A. K. Soper, J. Phys. Condens. Matter Phys. Condens., 2012, 24, 064107.
117 Á. Cimas, F. Tielens, M. Sulpizi, M.-P. Gaigeot and D. Costa, J. Phys.: Condens. Matter, 2014, 26, 244106.
118 D. Brunel, A. Cauvel, F. Di Renzo, F. Fajula, B. Fubini, B. Onida and E. Garrone, New J. Chem., 2000, 24, 807–813.
119 A. Jentys, N. H. Pham and H. Vinek, J. Chem. Soc. Faraday Trans., 1996, 92, 3287. 120 S. I. Karpov, F. Roessner and V. F. Selemenev, J. Porous Mater., 2014, 21, 449–457.