Publisher’s version / Version de l'éditeur: ASHRAE Preprint, 4160, pp. 1-8, 1998-01-01
READ THESE TERMS AND CONDITIONS CAREFULLY BEFORE USING THIS WEBSITE. https://nrc-publications.canada.ca/eng/copyright
Vous avez des questions? Nous pouvons vous aider. Pour communiquer directement avec un auteur, consultez la
première page de la revue dans laquelle son article a été publié afin de trouver ses coordonnées. Si vous n’arrivez pas à les repérer, communiquez avec nous à [email protected].
Questions? Contact the NRC Publications Archive team at
[email protected]. If you wish to email the authors directly, please see the first page of the publication for their contact information.
Archives des publications du CNRC
This publication could be one of several versions: author’s original, accepted manuscript or the publisher’s version. / La version de cette publication peut être l’une des suivantes : la version prépublication de l’auteur, la version acceptée du manuscrit ou la version de l’éditeur.
Access and use of this website and the material on it are subject to the Terms and Conditions set forth at
Transmission of sound from air terminal devices through ceiling systems
Warnock, A. C. C.
https://publications-cnrc.canada.ca/fra/droits
L’accès à ce site Web et l’utilisation de son contenu sont assujettis aux conditions présentées dans le site LISEZ CES CONDITIONS ATTENTIVEMENT AVANT D’UTILISER CE SITE WEB.
NRC Publications Record / Notice d'Archives des publications de CNRC:
https://nrc-publications.canada.ca/eng/view/object/?id=890230f0-e86a-44a9-87b6-1bb22107f661 https://publications-cnrc.canada.ca/fra/voir/objet/?id=890230f0-e86a-44a9-87b6-1bb22107f661
Transmission of Sound from Air Terminal Devices Through Ceiling Systems
A.C.C. WARNOCK, PH. D., MEMBER OF ASHRAE, INSTITUTE FOR RESEARCH IN CONSTRUCTION, NATIONAL RESEARCH COUNCIL CANADA
A version of this paper was published in ASHRAE Preprints, 4160, ASHRAE Winter Meeting (San Francisco, 1/1/98), pp. 1-8, 1998
Résumé
Sound from HVAC ducts or devices in ceiling plenums passes through the ceiling system to the room below and can cause annoyance to the occupants of the rooms. ARI standard 885 provides a method to calculate the level of the sound in the room using the device sound power and some attenuation factors for the ceiling. The goal of ASHRAE project RP755 was to evaluate and extend the information given in ARI 885. This paper describes the attenuation factors found for 6 types of ceiling tiles and 4 air-terminal units. Attenuations at low frequencies were found to correlate with the area of the lower face of the device emitting sound. Sound fields in the room below were essentially uniform; no significant attenuation with distance was found.
TRANSMISSION OF SOUND FROM AIR TERMINAL DEVICES
THROUGH CEILING SYSTEMS
†.
INTRODUCTION.
HVAC ducts or devices such as air terminal boxes in ceiling plenums are often major contributors to the noise level in occupied spaces below. The radiated sound passes through the ceiling, often only a few inches from the device, and pervades the room below as an annoying roar. This transmission occurs in addition to sound transmission along ducts and consequent radiation from air supply outlets. Industry Standard ARI 885 was developed to provide a consistent method for predicting sound pressure levels in a room below a ceiling with a plenum containing air-handling devices. ARI 885 discusses three mechanisms that relate to the
transmission of sound through ceilings. These are:
Environmental Effect: The reduction in sound power emitted by a source due to its confinement in a small room or space. This is discussed in a companion paper and in the report of the project (Warnock, 1998; Warnock, 1997).
Plenum/Ceiling Effect: The difference between the octave band sound power level of the source located in the plenum/ceiling cavity and the sound power level transmitted to the occupied space. The sound power of the source is that measured in a reverberation room according to ARI 880.
†
A.C.C. Warnock is a Senior Research Officer, Indoor Environment Program, Institute for Research in Construction, National Research Council Canada, Montreal Road, Ottawa, Ontario, K1A 0R6.
Space Effect: The difference between the octave band sound power level entering the occupied space and the resulting octave band sound pressure level at a specific point in an occupied space.
The focus of ASHRAE RP-755 was on the interactions between terminal units
(positioned above and close to a lay-in ceiling), the ceiling panels themselves, the plenum and the room below. The intent was to evaluate the calculation methods used in ARI 885 and suggest improvements where necessary. This paper presents results from the project and discusses primarily the sound attenuation through the ceiling systems and the sound pressure levels in the room below.
EARLIER RESEARCH
In a study sponsored by ARI, Blazier (1981) identified some reasons why noise problems were being experienced with the use of air terminal boxes. He found that measured values of sound power level for nine variable air-volume terminal boxes did not agree well with the data available from manufacturer’s catalogs; measured values were on average about 7 dB below catalog values in all octave bands from 125 Hz to 4 kHz, with standard deviations as high as 10 dB. To complicate matters further, the insertion loss to be used to account for the presence of the ceiling tiles was not well known.
Blazier (1984) also identified the uncertainty when converting from sound power level to sound pressure level in normal rooms. Due to the presence of absorbing ceilings, scattering objects, and floor coverings, the sound field is not likely to be diffuse. He presented
and no sign of a reverberant field being developed. The practice in use at the time of converting to mean room sound pressure level by subtracting 10 dB from the sound power level was clearly not adequate to account for the effect of the room and its contents. According to Blazier, these practices could lead to under-estimating the room sound pressure level by 10-12 dB.
Conventional sound transmission loss theory and measurement applies to sound
transmission between rooms or through enclosures when the volume of the source of noise in the enclosure is small relative to the enclosure volume and the source is not close to the surfaces forming the enclosure. When the source of sound is close to the surface of an enclosure, the enclosure can load the source and alter the emitted sound power. As well, resonances in the air space between the source and the enclosure can lead to large changes in the insertion loss.
Fairly detailed reviews of the research work done on close-fitting enclosures can be found in handbooks (Crocker and Kessler, 1982; Vér, 1992), but it is doubtful that any of the available theories can be applied on its own for predicting the plenum/ceiling effect. Many of them do not consider damping within the enclosure and none directly address the issue of a noise source very close to an extended, absorptive surface that bounds an absorptive, cluttered and shallow plenum. A successful model would have to combine the effects of a close-fitting barrier (the ceiling), including changes in radiation efficiency, and the complicated path for sound from the device into the plenum (certainly a non-diffuse field) and then through the ceiling with its plethora of service and ventilation openings and leaks.
In the early 1980s, ASTM committee E33.03 considered the problem of measuring the sound transmission through ceiling tiles from air terminal devices close to the rear face of the
tiles. A task group concluded that the most convenient method of test was to mount the tiles in a frame similar to the E400 mount described in ASTM E795. A metal box containing two
loudspeakers is placed inside the frame and the sound power from it is measured in a
reverberation room with and without a ceiling specimen in place. The difference in sound power between the two measurements gives a spectrum called the ceiling insertion loss (CIL). It was not clear, however, that the results from the proposed procedure could be used to predict what would happen in a real situation.
THE TEST ROOM.
The room acoustics test (RAT) room, where the measurements were made, is a
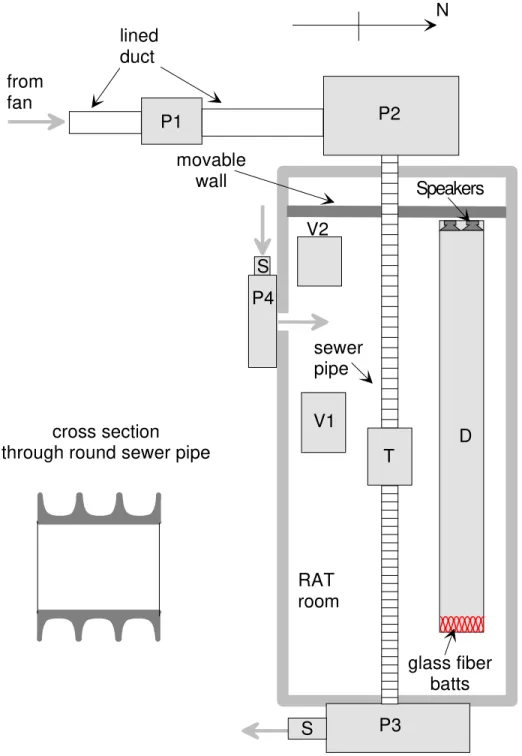
rectangular parallelepiped 4.71 m (15.5 ft) wide and 3.6 m (11.8 ft) high. One end wall can be moved to allow changes in length to a maximum of about 11 m. For most of the experiments, the length was set at 9.2 m (30.2 ft), giving a room volume of 156 m3 (5509 ft3). The T-bar system for supporting tiles was installed so the distance from the supporting surface of the T-bar to the true ceiling of the room was 740 mm (29 in). To provide some scattering, 8 sheets of 16 mm (5/8 in) gypsum board measuring 1.22 x 1.22 m (4 x 4 ft) were hung on the walls or placed on the floor and inclined against the walls. The general layout of the ducts and other devices in the room is shown in Figure 1.
P1 V2 V1 P2 D P3 N from fan T RAT room lined duct sewer pipe cross section
through round sewer pipe
P4 S S movable wall Speakers glass fiber batts
Figure 1: Plan view of the RAT room showing the layout of the air supply and duct system above the ceiling (not to scale). P1, P2, and P3 are lined plenums through which the air from the fan passes. P4 is a plenum that allows air to pass through a hole in the wall into the space above the suspended ceiling. V1 and V2 are the VAV simulator boxes. T is the air
terminal device under test and D is the large duct which is closed at both ends. The gray arrows represent air flows. S are sound attenuating devices. The RAT room is surrounded by a wall containing several doors that allow recirculation of air back to the supply fan.
TERMINAL UNITS.
The four terminal units used are described below. All were operated without using automatic controls. Standard conditions were an inlet static pressure drop of 374 Pa (1.5 in water) with a flow velocity of 610 m/minute (2000 ft/minute).
Table 1: Air terminal units used in RP755 study.
Terminal unit
Type Width x Length x
Height Room coordinates of mid point of lower face Height of lower face above T-bars A single duct, variable volume 381 x 394 x 406 mm (15 x 15.5 x 16 in) 2.00, 2.97, 3.83 m (6.6, 9.7, 12.6 ft) 170 mm (6.7 in) B constant volume, fan-powered 813 x 1486 x 406 mm (32 x 58½ x 16 in) 1.90, 3.00, 3.00 m (6.2, 9.8, 9.8 ft) 200 mm (7.9 in) C variable volume, fan-powered 1245 x 864 x 356 mm (49 x 34 x 14 in) 1.59, 3.05, 3.83 m (5.2, 10, 12.6 ft) 205 mm (8.1 in) D pressure independent induction 1210 x 1829 x 406 mm (47 5/8 x 72 x 16 in) 2.00, 2.98, 3.20 m 6.6, 9.8, 10.5 ft 180 mm (7.1 in)
To provide simple and more convenient reference sources with good repeatability, two simulated air terminal sources were constructed. These units measured 300 x 600 x 900 mm (1 x 2 x 3 ft) and were made of 24 ga. galvanized steel. Two elliptical car loudspeakers were mounted facing in opposite directions on a 13 mm (1/2 in) thick plywood panel at the mid-plane of each box. Each loudspeaker was fed by its own random noise generator and amplifier. The devices are identified as VAVsim1 and VAVsim2.
A 7.7 m (25.3 ft) long section of duct, sealed at both ends, was installed down one side of the room above the tile system. The cross-section of the 20 Ga. steel duct measured
and amplifiers, were installed at the west end of the duct. The east end was faced with a layer of glass fiber batts about 300 mm (1 ft) thick to reduce reflections.
CEILING TYPES.
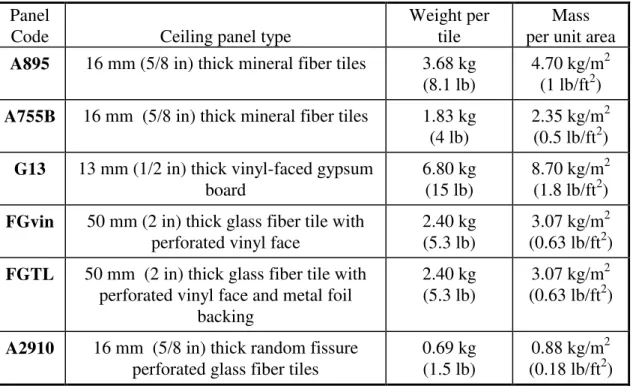
Five types of ceiling panels were initially selected for this project. Towards the end of the project, an additional ceiling type (A2910), expected to have much lower sound transmission loss, was added to give more information. The panels are described in Table 2. For convenience, the panel codes are used to identify each panel type throughout this paper.
Table 2: Identification and properties of 625 x 1250 mm ceiling panels used in the project.
Panel
Code Ceiling panel type
Weight per tile
Mass per unit area A895 16 mm (5/8 in) thick mineral fiber tiles 3.68 kg
(8.1 lb)
4.70 kg/m2 (1 lb/ft2) A755B 16 mm (5/8 in) thick mineral fiber tiles 1.83 kg
(4 lb)
2.35 kg/m2 (0.5 lb/ft2) G13 13 mm (1/2 in) thick vinyl-faced gypsum
board
6.80 kg (15 lb)
8.70 kg/m2 (1.8 lb/ft2) FGvin 50 mm (2 in) thick glass fiber tile with
perforated vinyl face
2.40 kg (5.3 lb)
3.07 kg/m2 (0.63 lb/ft2) FGTL 50 mm (2 in) thick glass fiber tile with
perforated vinyl face and metal foil backing
2.40 kg (5.3 lb)
3.07 kg/m2 (0.63 lb/ft2)
A2910 16 mm (5/8 in) thick random fissure perforated glass fiber tiles
0.69 kg (1.5 lb)
0.88 kg/m2 (0.18 lb/ft2)
Standard Reverberation Room Measurements on Each Ceiling Type.
For each ceiling type, except the A2910 type, the following standard measurements were made:
1. Sound absorption measured according to ASTM C423in a 250 m3 (8829 ft3) reverberation room with the specimen mounted on an E400 frame as described in ASTM E795 (400 mm (16 in) air space).
2. Sound transmission loss between two reverberation rooms according to ASTM E90 with the specimen mounted in a T-bar support system as it was in the RAT room.
3. Ceiling insertion loss (CIL) by the ASTM draft test method mentioned earlier.
The absorption and transmission loss data can be found in the RP755 report (Warnock, 1997).
Measurements in the RAT Room.
The sound pressure levels generated in the RAT room by each source installed in the plenum in combination with each ceiling type were measured using a real-time analyzer and 13 mm (1/2 in) diffuse field condenser microphones. The integration time at each of the 36 microphone positions was 32 s. As well, each time a ceiling was installed in the RAT room for testing, the sound pressure levels generated in the room by the simulators, the duct and a reference sound source were measured.
The reduction in sound pressure level with distance along a line from a source was measured (Warnock 1997, Warnock 1998). Reverberation times were also measured in the room each time the contents changed (Warnock 1997, Warnock 1998).
For each source the sound power was measured in the bare RAT room in accordance with ANSI S12.31 and ARI 880. Where possible, power measurements were made in other larger reverberation rooms. Measurements of power in the RAT room were made using the direct method (measurement of sound pressure level and reverberation time) and the substitution technique (comparison with the reference sound source). Differences between the two techniques at low frequencies were observed but are not relevant to this paper.
ATTENUATION THROUGH CEILINGS.
The difference between the sound power, Lw, of a given device placed in the plenum and the average sound pressure level, <Lp>, in the room below measures the combination of the plenum/ceiling effect and the average space effect. For convenience, this quantity will be referred to as the ceiling attenuation.
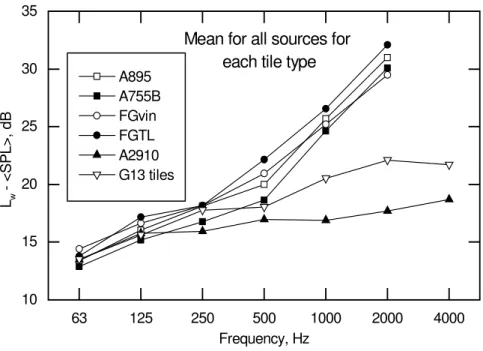
Figure 2 characterizes ceilings by showing the value of ceiling attenuation averaged over all the sources used. (Note that some data for 4 kHz are missing; the measured sound pressure levels were too close to the background noise levels in the room.) There are two ceiling types, A2910 and G13, that are clearly quite transparent to sound from sources in the plenum and different from the other four types. An early conclusion in this project was that there was little difference between typical ceiling tiles and hence no need for a test procedure. The addition of the A2910 tile to the project showed that there could be quite significant differences between
ceiling types. One can imagine other products that might fall between the A2910 tiles and the others and perhaps the need for a test procedure needs re-examination. On the other hand, from a practical point of view, one does not need a test report to know that the light, porous A2910 tiles are not likely to provide much sound attenuation.
The result for the G13 tiles perhaps is in itself somewhat surprising. One might have expected that these heavier tiles would have given much lower levels in the room than the other lighter tiles. The conclusion drawn from this result and others in the project is that for most of the tiles used, the dominant path through the ceiling is the leakage between the edges of the tiles and the T-bars. The importance of leakage was demonstrated for the G13 tiles by measuring transmission loss according to ASTM E90 with the tiles installed normally and then taped to the T-bars.
Figure 3 characterizes sources by showing, for each source, the value of ceiling
attenuation averaged over all the ceiling types used. This plot shows that there are differences among the sources at and below 250 Hz. The conclusion drawn from this graph is that the
presence of the ceiling tiles and the plenum lining changes the emitted sound power of the source from that measured in the empty room. This makes it difficult to predict accurately the sound pressure level in the room below the ceiling using only sound power levels for the device measured in a reverberation room or a hemi-anechoic space.
63 125 250 500 1000 2000 4000 10 15 20 25 30 35
Mean for all sources for each tile type A895 A755B FGvin FGTL A2910 G13 tiles Lw < SPL > , d B Frequency, Hz
Figure 2: Difference between device sound power level and average sound pressure level in the room averaged over all sources for each type of tile.
63 125 250 500 1000 2000 4000 5 10 15 20 25 30 35
Mean for each source, all tile types Duct VAVsim TermA TermB TermCb TermCi TermD VAVsim2 Lw - <S P L > , dB Frequency, Hz
Figure 3: Difference between device sound power level and average sound pressure level in the room averaged over all tile types for each source.
Ceiling Attenuation Compared with ARI 885 Values.
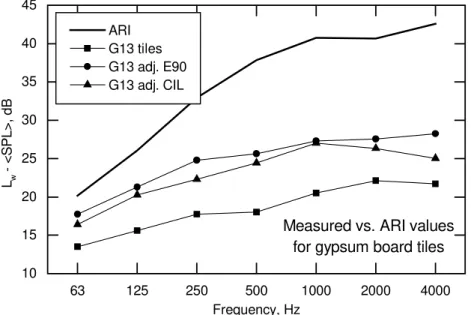
The attenuations measured for the different ceiling types do not agree well with those calculated according to ARI 885, as shown in Figure 4 to Figure 6. Since ARI 885 assumes that the Schultz expression is applicable, the room sound pressure level was calculated at each measurement position and then an average for the room calculated. The agreement between measured and the ARI data is generally not good.
The data in ARI 885 for gypsum board are for a solid sheet, not tiles as were tested in this project. To provide some estimate of what might have been measured if a solid ceiling had been used, the measured G13 data were adjusted using estimates of leakage obtained by two different methods during the project. The adjusted values in Figure 6 are still not as high as those given in ARI 885.
63 125 250 500 1000 2000 4000 10 15 20 25 30 35
Measured vs. ARI values for mineral fiber tiles
ARI A895 A755B Lw - < S P L > , d B Frequency, Hz
Figure 4: Sound power minus average room sound pressure level for measured cases and ARI 885 values — 16 mm (5.8 in) mineral fiber tiles.
63 125 250 500 1000 2000 4000 10 15 20 25 30 35
Measured vs. ARI values for glass fiber tiles ARI FGvin FGTL A2910 Lw <S PL>, dB Frequency, Hz
Figure 5: Sound power minus average room sound pressure level for measured cases and ARI 885 values — glass fiber tiles. FGvin and FGTL are 50 mm (2 in) thick, A2910 is 16 mm (5/8 in) thick, and the ARI values are for 13 mm (1/2 in) thick tile.
63 125 250 500 1000 2000 4000 10 15 20 25 30 35 40 45
Measured vs. ARI values for gypsum board tiles ARI G13 tiles G13 adj. E90 G13 adj. CIL Lw - < S P L >, dB Frequency, Hz
Figure 6: Sound power minus average room sound pressure level for measured cases and ARI 885 values — 13 mm (1/2 in) thick gypsum board tiles.
DEPENDENCE OF CEILING ATTENUATION ON SOURCE AREA.
Examination of the data collected revealed a fairly strong correlation between the ceiling attenuation and the area of the surface of the source closest to the ceiling. As the area increased, so did the ceiling attenuation. This correlation explains much of the scatter at low frequencies in Figure 3. No physical model or analytical expression has been found to explain this dependence. The empirical model developed is embodied in the following equation:
<Lp>(f) = Lw(f) - γ(f) + k(f) x (As - 0.83).
<Lp>(f) is the average sound pressure level in the room, dB,
Lw(f) is the power emitted by the terminal unit when tested according to standards, dB
γ(f) is the nominal attenuation of the ceiling tiles, dB,
k(f) is the slope of the regression of attenuation on area, dB/m2 , As is the area of the lower face of the terminal unit, m2,
f is the mid-band frequency of the octave band, Hz.
The values of k(f) found from experiment are given in Table 3, together with the standard error of the estimate of sound pressure level and the square of correlation coefficient for
measured versus predicted level. The surprising aspect of this result is that as the area of the source increases, so does the ceiling attenuation.
Table 3: Parameters for empirical model for predicting average room sound pressure level from device power, ceiling attenuation and device face area.
Frequency, Hz 63 125 250 500 1k 2k 4k
k(f), dB/m2 4.4 4.1 2.5 0 0 0 0
SE, dB 1.7 1.9 2.2 1.3 1.3 1.2 2.4
r squared 0.90 0.97 0.96 0.99 0.99 0.99 0.98
The correlation between the area of the lower surface of the source and the insertion loss discussed in this section can be used to account for the differences within this data set, but this does not provide a physical explanation of what is going on. The creation and experimental validation of a theoretical model linking the size and radiation characteristics of sources to the pattern of the sound fields in the plenum and thus to the sound fields in the room below would require a great deal of work. The value of such an effort is doubtful since there are no
immediately obvious practical applications of the information; radiation characteristics are not normally measured and predicting what would happen in a typical plenum would be an extremely
complex task. Thus it seems that this empirical model, or perhaps an improved one based on new data, will be the most economical approach to this problem.
Effect of Plenum and Room Absorption.
For the A895 ceiling specimen, the effect of adding sound absorbing material on the vertical plenum surfaces was investigated by adding 100 mm thick open-cell, foam lining to each surface in turn. As well, for several measurements, all four vertical faces were lined with 300 mm (12 in) of glass fiber thermal insulation. Figure 7 shows for each case the measured levels in the room below with a terminal simulator operating in the plenum 50 mm (2 in) from the upper face of the tiles. There is a relatively steady decrease in level as each face of the plenum is covered.
Variations in plenum absorption occur in practice and the cases presented here show that these can result in quite large variations in the room sound pressure level. It would be extremely difficult, however, to invent a scheme for including the plenum absorption conditions in a prediction model. The practical approach is to accept the RAT room data as typical and use that in modeling.
63 125 250 500 1000 2000 4000 0 1 2 3 4 5 6 7 8 9 10 11 300 mm fg 4 sides 3 sides 2 sides 1 side
Levels with lined plenums relative to no lining case R e duc ti on in <S P L >, d B Frequency, Hz
Figure 7: Difference in mean room sound pressure levels in the RAT room below a ceiling of A895 tiles when each face of the plenum was lined successively with 100 mm (4 in) of sound absorbing foam. Differences are shown relative to the bare plenum case. Also shown are the differences for a 300 mm thick lining of glass fiber batts.
For convenience, the normal condition of the room during tests was with 100 mm (4 in) foam on the plenum surfaces and no carpet or wall absorbers; the room was perhaps a little more reverberant than a typical office would have been. To estimate the effects of room furnishings on the sound pressure levels, a carpet was laid on the floor and twelve of the FGvin tiles were placed at random locations on the walls. The data collected showed that increases in room absorption are not likely to reduce the levels by more than about 2-3 dB and then only at frequencies above 250 Hz. Thus the ceiling attenuations found in this work can be considered to be conservative for heavily furnished rooms or plenums containing large amounts of sound absorbing material.
Effects of Slots in Ceiling Tiles.
Changes in room sound pressure level caused by one and two 50 x 1200 mm (2 x 48 in) slot openings in the tiles in various positions were measured. These slots were significant only when directly under the source. Even then the changes were small and only at high frequencies. In the other locations, the distance from the source, the size of the slots and the relatively uniform sound field in the plenum render their effect negligible. A similar result was obtained for a light fixture with integral ventilation slots; it had no effect on the average room sound pressure level unless it was directly under the noise source.
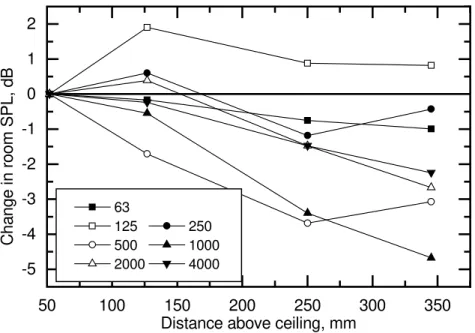
Effect of Source Height.
The effect of the gap between the simulated VAV source and the A755 ceiling was investigated. The rather small changes in room sound pressure level are plotted in Figure 8 relative to the shortest gap used (50 mm (2 in)). On the basis of this result, it is reasonable to take the position that the gap between the source and the ceiling tiles is not likely to be a very
50 100 150 200 250 300 350 -5 -4 -3 -2 -1 0 1 2 63 125 250 500 1000 2000 4000 Ch an ge i n roo m S P L, dB
Distance above ceiling, mm
Figure 8: Change in mean room sound pressure level caused by raising the source higher, further from the ceiling. A755 tiles.
SOUND PRESSURE LEVEL VERSUS DISTANCE FROM SOURCE IN
PLENUM
When the source was above the ceiling in the plenum, the sound field in the room below varied very little with distance from the source; the Schultz formula (Schultz, 1985) does not apply. Except at 2000 and 4000 Hz, the attenuation is about 1 dB/doubling of distance. ARI 885 specifies the use of the Schultz formula and so is inaccurate in this respect. Values of attenuation of sound with distance in the room are discussed in the main report (Warnock 1997) and in one of the companion papers to this (Warnock 1998).
COMPARISON OF E90 AND CIL WITH RAT POWER INSERTION LOSS.
One aim of the project was to find or generate a test procedure that could be used to evaluate ceiling boards as barriers against casing-radiated sound. The two most likely candidates
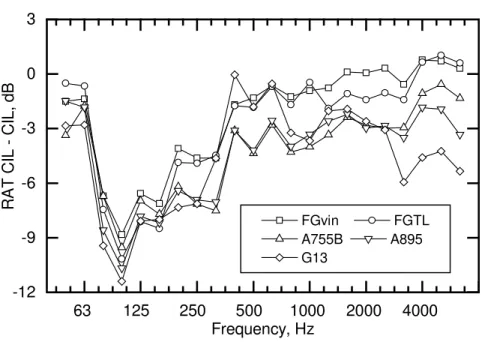
were the E90 procedure and the CIL procedure developed by the ASTM E33.03 task group. Of the four test methods investigated in the project, the second version of the reverberation room CIL test seems most promising, with the E90 procedure in second place. The original version of the reverberation room CIL test and the E1414 test are not useful for this situation. Differences between E90 results and the ceiling power insertion loss measured in the RAT room, RAT CIL, are shown in Figure 9. Two variants of the CIL procedure were investigated in this project. Differences between the second variant of RAT CIL and the reverberation room CIL are shown in Figure 10.
In these figures the actual value of the difference is not too important; it is the range of the data at any one frequency that matters. If the range were reasonably small, then the
reverberation room test procedure could be used to predict levels in a room under a
ceiling/plenum system that contains a noisy device; the test procedure would properly rank the ceiling types.
63 125 250 500 1000 2000 4000 -10 -5 0 5 FGvin FGTL A755B A895 G13 RAT C IL - E90 T L , dB Frequency, Hz
Figure 9: Differences between RAT CIL and E90 data.
63 125 250 500 1000 2000 4000 -12 -9 -6 -3 0 3 FGvin FGTL A755B A895 G13 R A T CI L - CI L, dB Frequency, Hz
Figure 10: Differences between RAT CIL and CIL (case 2) measured in reverberation room.
PROPOSED AMENDMENTS TO ARI 885
Nominal values of ceiling attenuation measured and estimated during the RP755 project are given in Table 4. The data for the solid gypsum board ceiling given in Table 4 were obtained by adjusting the data for the tile measurements using the E90 and CIL data for the taped and untaped cases of G13. The estimate for the concealed spline case is based on the data presented by Mechel (1995). Estimates for the solid sheets of gypsum board are based on mass law
corrections applied to the measured data for the 13 mm (1/2 in) gypsum board.
Until a new type of test or rating procedure for terminal devices installed in a ceiling or for the ceilings themselves is created, the model established by the existing ARI 885 should continue to be used but with modifications. The proposed procedure is
1. Obtain the sound power levels of the device, Lw(f) following ARI 880.
2. Subtract the environmental correction (Warnock 1997, Warnock 1998).
3. Using the corrections, k(f), in Table 3 and the area of the surface of the source closest to the ceiling tiles, As (m2), calculate the value k(f)(As - 0.83) to be subtracted from the sound power values at each frequency.
4. Select the Ceiling/Plenum attenuations, γ(f) from Table 4 according to the ceiling type in use and calculate the average sound pressure level in the room.
5. For practical purposes, the sound field in the room may be assumed to be essentially uniform up to distances of about 5 m from the source.
Table 4: Ceiling/Plenum attenuations, γ(f), for generic ceiling types in T-bar suspension systems, except as noted.
Tile Type Approximate Density, kg/m2 (lb/ft2) Thickness, mm (in) 63 125 250 500 1k 2k 4k Mineral fiber 5 (1) 16 (5/8) 13 16 18 20 26 31 36 Mineral fiber 2.5 (0.5) 16 (5/8) 13 15 17 19 25 30 33 Glass fiber 0.7 (0.15) 16 (5/8) 13 16 15 17 17 18 19 Glass fiber 3 (0.6) 50 (2) 14 17 18 21 25 29 35
Glass fiber with TL backing
3 (0.6) 50 (2) 14 17 18 22 27 32 39
Gypsum board tiles 9 (1.8) 13 (1/2) 14 16 18 18 21 22 22
Solid gypsum board ceiling 9 (1.8) 13 (1/2) 18 21 25 25 27 27 28 Solid gypsum board ceiling 11 (2.2) 16 (5/8) 20 23 27 27 29 29 30 Double layer of gypsum board 18 (3.6) 25 (1) 24 27 31 31 33 33 34 Double layer of gypsum board 22 (4.4) 32 (1.25) 26 29 33 33 35 35 36
Mineral fiber tiles, concealed spline mount. 2.5 to 5 (0.5 to 1) 16 (5/8) 20 23 21 24 29 33 34
REFERENCES.
ANSI S12.31 – Precision Methods for the determination of sound power levels of broad-band noise sources in reverberation rooms.
ARI Standard 880, “Air terminals”, Air-Conditioning & Refrigeration Institute, Arlington, Virginia, 1990.
ARI Standard 885-90, “Procedure for estimating occupied space sound levels in the application of air terminals and air outlets”, Air-Conditioning & Refrigeration Institute, Arlington, Virginia, 1990.
ASTM E90 – Standard Test Method for Laboratory Measurement of Airborne Sound Transmission Loss of Building Partitions.
ASTM E1414 – Standard Test Method for airborne sound attenuation between rooms sharing a common ceiling plenum.
ASTM C423 – Standard Test method for sound absorption and sound absorption coefficients by the reverberation room method.
ASTM E795 – Standard Practices for mounting test specimens during sound absorption tests.
Beranek, L. L., Noise and Vibration Control, McGraw-Hill, N.Y., 1971.
Blazier, Jr., W. E., “Improved guidelines for application of sound rating data to the acoustical design for HVAC systems”, ASHRAE Transactions 1984, V. 90, Pt. 2.
Blazier, Jr., W., “Noise rating of variable air-volume terminal devices”, ASHRAE Transactions 1981, V. 87, Pt. 1.
Crocker, M.J. and Kessler, F.M., Noise and Noise Control, Vol II, Chapter 2, CRC Press, 1982.
I.L Vér, Enclosures and Wrappings, Chap.13 in Noise and Vibration Control Engineering, Ed. L.L Beranek and I.L Vér, J. Wiley and Sons, 1992.
Schultz, T., “Relationship between sound power level and sound pressure level in dwellings and offices”, RP-339, ASHRAE Transactions 1985, V. 91, Pt. 1.
Warnock, A.C.C., “Sound Transmission Through Ceilings from Air Terminal Devices in the Plenum”, Final report ASHRAE RP755. January 1997.
Warnock, A.C.C., “Environmental Effect for use in Predicting Room Sound Pressure Levels”, San Francisco, 1998.