HAL Id: hal-01683175
https://hal.archives-ouvertes.fr/hal-01683175
Submitted on 27 May 2020
HAL is a multi-disciplinary open access
archive for the deposit and dissemination of
sci-entific research documents, whether they are
pub-lished or not. The documents may come from
teaching and research institutions in France or
abroad, or from public or private research centers.
L’archive ouverte pluridisciplinaire HAL, est
destinée au dépôt et à la diffusion de documents
scientifiques de niveau recherche, publiés ou non,
émanant des établissements d’enseignement et de
recherche français ou étrangers, des laboratoires
publics ou privés.
Copyright
Stand-level wind damage can be assessed using
diachronic photogrammetric canopy height models
Jean-Pierre Renaud, Cédric Vega, Sylvie Durrieu, Jonathan Lisein, Steen
Magnussen, Philippe Lejeune, Meriem Fournier
To cite this version:
Jean-Pierre Renaud, Cédric Vega, Sylvie Durrieu, Jonathan Lisein, Steen Magnussen, et al..
Stand-level wind damage can be assessed using diachronic photogrammetric canopy height models. Annals
of Forest Science, Springer Nature (since 2011)/EDP Science (until 2010), 2017, 74 (4), pp.1-11.
�10.1007/s13595-017-0669-3�. �hal-01683175�
RESEARCH PAPER
Stand-level wind damage can be assessed using diachronic
photogrammetric canopy height models
Jean-Pierre Renaud1 &Cédric Vega2&Sylvie Durrieu3&Jonathan Lisein4&
Steen Magnussen5&Philippe Lejeune4&Mériem Fournier6
Received: 2 May 2017 / Accepted: 20 October 2017 / Published online: 16 November 2017 # INRA and Springer-Verlag France SAS 2017
Abstract
& Key message Diachronic photogrammetric canopy height models can be used to quantify at a fine scale chang-es in dominant height and wood volume following storms. The regular renewal of aerial surveys makes this approach appealing for monitoring forest changes.
&Context The increasing availability of aerial photographs and the development of dense matching algorithms open up new possibilities to assess the effects of storm events on forest canopies.
&Aims The objective of this research is to assess the potential of diachronic canopy height models derived from photogram-metric point clouds (PCHM) to quantify changes in dominant height and wood volume of a broadleaved forest following a major storm.
&Methods PCHMs derived from aerial photographs acquired before and after a storm event were calibrated using 25 field
plots to estimate dominant height and volume using various modeling approaches. The calibrated models were combined with a reference damage maps to estimate both the within-stand damage variability, and the amount of volume impacted.
& Results Dominant height was predicted with a root mean squared error (RMSE) of 4%, and volume with RMSEs rang-ing from 24 to 32% accordrang-ing to the type of model. The volume impacted by storm was in the range of 42–76%. Overall, the maps of dominant height changes provided more details about within-stand damage variability than conven-tional photointerpretation do.
& Conclusion The study suggests a promising potential for exploiting PCHM in pursuit of a rapid localization and quan-tification of wind-throw damages, given an adapted sampling design to calibrate models.
Handling Editors: Céline Meredieu and François de Coligny
Contribution of the co-authors Jean-Pierre Renaud designed the exper-iment, analyzed the results, and wrote the paper. Cedric Vega, Steen Magnussen, and Sylvie Durrieu contributed to the experimental design, analysis of the results, and writing of the paper. Jonathan Lisein contrib-uted to the production of the photogrammetric models and proofreading of the manuscript. Philippe Lejeune and Mériem Fournier proofread the manuscript. Mériem Fournier coordinated the research project. This article is part of the Topical Collection on Mensuration and modelling for forestry in a changing environment
* Jean-Pierre Renaud [email protected]
1
Office National des Forêts, Département RDI, 8 allée de Longchamp, F-54600 Villers lès Nancy, France
2 IGN, Laboratoire de l’Inventaire Forestier, 11 rue Ile de Corse,
F-54000 Nancy, France
3
TETIS, ISTEA, Univ Montpellier, 361 Rue Jean François Breton, F-34196 Montpellier, France
4
Université de Liège, Gembloux Agro-Bio Tech, 2, Passage des Déportés, B-5030 Gembloux, Belgium
5 Canadian Forest Service, Natural Ressources Canada, 506 w
Burnside Rd, Victoria, BC V8Z 1M5, Canada
6 AgroParisTech, Inra, UMR LERFoB, 54000 Nancy, France
Keywords Forest inventory . Photogrammetry . Wind-throw estimates
1 Introduction
Storms are among the most important source of disturbance affecting European forests (Gardiner et al. 2011; Albrecht et al. 2012). After such events, forest managers and
stakeholders are facing the difficult task of obtaining timely and reliable estimates of both the impacted areas, and the damage intensity. In 1999, two successive storms,“Lothar” on December 26th and“Martin” the following day, severely impacted many European forests. Lothar affected Northern France, Southern Germany, and Northern Switzerland, while Martin affected central France and South-Western Switzerland (Schelhaas et al.2003; Birot et al.2009). At that time, the sampling design of the French National Forest Inventory (NFI) called for a regionalized sampling each year with a national completion on a 10-year cycle. That is, sample data collected in a given year would not represent the whole terri-tory. National estimates of forest damages were therefore dif-ficult to obtain under this design. Estimates that were obtained were mainly based on photointerpretation of aerial photo-graphs acquired specifically for this purpose after the storm events, and were given in the form of damage levels on an ordinal scale (Wencélius2002). Such data sources can provide a precise estimate of impacted areas. However, estimates of the level of damage are prone to observer bias. In addition, rather broad class intervals are usually used to describe the level of damage (Stach and Deshayes2009). This situation has been improved in many aspects with the transition of the French NFI to a new sampling scheme, covering the whole territory each year (Hervé et al.2014).
More recently, the 2009 winter storm named“Klaus” dam-aged approximately 50 million m3of standing volume, in South-Western France (Bélouard et al.2012). It crossed 13 departments and caused considerable damages to nearly 600,000 ha of forests in Aquitaine, 62,000 ha in Midi-Pyrénées, and 31,000 ha in Languedoc Roussillon. At that time, NFI data allowed an efficient estimation of damage at the departmental level within a few weeks after the storm (Bélouard et al.2012). Beyond that scale, NFI field sampling density was not high enough to give precise estimates of the impacted volumes.
Remote sensing could efficiently supply field measure-ments to detect disturbances (Coppin et al.2004) such as those generated by storms. Various change detection techniques were proposed based on either optical or radar satellite data to assess forest disturbances and related dendrometric param-eters such as volume (Mitchell et al.2017, Jonikavičius and
Mozgeris2013, Wang and Xu 2010). That said, change detec-tion from 2D remote sensing data can be challenging due to possible spectral and textural confusion between trees and other vegetation (Tian et al.2013;2017). The ongoing devel-opment of remote sensing methods based on active (i.e., LiDAR) or passive (i.e., photogrammetry) sensors allow to generate a direct information on stand height, which is a key parameter in forest inventory and management. Owing to their large availability and fast renewal in many countries (Ginzler and Hobi2015), aerial photographs can be considered as an efficient data source to monitor the consequences of storms
through the analysis of changes in canopy height. The pro-cessing of aerial photograph benefits currently of the rapid development of image-matching algorithms, which establish the spatial correspondences between two or more overlapping images to retrieve 3D information (Remondino et al.2014). Leberl et al. (2010) reported that current state-of-the-art pho-togrammetric workflows provide a similar geometrical preci-sion than the one achieved by aerial LiDAR systems. A major limit of a photogrammetric approach in forest environments is its incapacity to retrieve the ground information under a dense canopy. Indeed, the photogrammetric point clouds can only be used to generate a photogrammetric digital sur-face model (PDSM) describing the Earth sursur-face elevation and needs to be combined with a digital terrain model (DTM) to estimate a photogrammetric canopy height model (PCHM = PDSM− DTM). The ongoing development of na-tionwide LiDAR DTM coverages will progressively solve this issue (Ginzler and Hobi2015).
With respect to storm damage assessment, Miller et al. (2000) suggested that the height information contained in multi-date aerial photographs could provide accurate esti-mates of changes in canopy height and possibly give a fine spatial resolution of such damage. In coniferous and mixed forests of Finland, Honkavaara et al. (2013) followed this idea and proposed an automatic storm damage detection method based on large changes in digital surface models (DSMs) de-rived from photogrammetric imagery and airborne LiDAR data. The sensitivity of their method allowed a detection of damage when at least 10 trees per hectare were fallen.
In addition, a photogrammetric DSM can also be used to estimate stand parameters. For example, Stepper et al. (2015) used UltraCamXp stereo images to generate a DSM and mod-el growing stocks in a highly structured broadleaf-dominated forest in Southern Germany. Several others (St-Onge et al.
2008; Vega and St-Onge2008,2009; Bohlin et al.2012; Nurminen et al. 2013; Straub et al. 2013; Magnussen et al.
2016) also produced stand level estimates of canopy height, wood volume, or aboveground biomass from photogrammet-ric products.
Those results highlight the potential of photogrammetry to both map the outline of damaged areas, and to quantify the intensity of damage at a low cost. Compared to the conven-tional method based on photointerpretation and damage clas-ses, times-series of photogrammetric measurements could provide fast, objective, and fine-scale information about wind-throw damage that could be used to estimate impacts of a storm on major dendrometric parameters. Previous re-searches focused on delineating damaged area based on height changes and were mainly conducted in coniferous-dominated forests. To the best of our knowledge, this study is the first to present height and volume models issued from diachronic PCHMs that are used to assess wind damages in a broad-leaved forest. The objective of this research is to demonstrate
how such an approach can provide continuous and detailed maps of damages and to estimate the amount of impacted volume. Our study benefits from the rapid renewal of aerial photographs in France (i.e., 3 to 5 years), providing a regular flow of information on canopy structures at a very high spatial resolution (i.e., < 1 m) suited for a forest disturbance monitor-ing system.
2 Materials and methods
2.1 Study site
The experimental forest is the Haye’s state forest, that cover 112 km2in North-Eastern France (48° 41′ 39″ N, 6° 04′ 20″ E). It is mainly a common beech (Fagus sylvatica L.) forest with hornbeam (Carpinus betulus L.), common ash (Fraxinus excelsior L.), and Norway maple (Acer platanoides L.), with some minor coniferous parts. This site has been heavily im-pacted by the Lothar storm in 1999. A map of the damages has been produced by the French NFI. Over this site, a digital terrain model (DTM) at a 1-m resolution was produced from LiDAR data acquired in 2007 and 25 calibration field plots were established in 2009 in the framework of a previous pro-ject (ANR-Foresee:http://foresee.fcba.fr), and for which height and diameter measurements and growing stock estimates were available (Martins2009; St-André et al.
2013). Finally, historical aerial photographs were available from the French National Institute of Geographic and Forest Information (IGN,www.geoportail.gouv.fr) before and after the 1999 storm, as well as in 2009.
2.2 Aerial photographs
Three series of photogrammetric images (leaf-on) were used. They were acquired the year of the storm (1999), 3 years later (2002), and the year during which field plots were established for the Foresee project (2009) (Table 1). Images were downloaded from the historical time series of the IGN geoportail (http://remonterletemps.ign.fr). It must be noticed that for 2002, images were only available for the eastern part or the forest, thus restricting the area on which change estimation procedure can be performed. Images were from two sources, i.e., from analogic argentic photographs that were scanned (1999, 2002), and from a digital camera in 2009. Ground resolution of images was highest for the 2002 images (28 cm) and lowest for the 1999 images (55 cm) (Table1).
2.3 Photogrammetric workflow
The photogrammetric workflow was executed in two steps. First, the orientation of the image blocks, including the camera calibration and the bundle block adjustment, was done
with the Agisoft PhotoScan 1.6 software (www.agisoft.com). A maximum of 2500 tie-points per image were determined on the basis of a maximum of 15,000 feature points per image. The relative orientation was transformed into a georeferenced orientation with 43 ground control points (GCPs). The ground control points set consists of characteristic points, mainly roof borders and chimnies, that were precisely located by photoin-terpretation on the 2007 LiDAR DSM. In order to insure a good co-orientation of the 1999 and 2002 image blocks, the orientation of these two blocks was determined simultaneous-ly in PhotoScan. Thus, tie-points have been generated auto-matically in order to link images from the 1999 survey with images from 2002. For these blocks, 34 GCPs were identified. Images from the 2009 survey cover a larger area and were oriented independently with the whole set of 43 GCPs. Self-calibration of the cameras was performed on the basis of these GCPs through the“optimize” tool of PhotoScan. Residuals of these GCPs (planimetric and altitudinal) from the aerial trian-gulation process are presented in Table1.
In the second step of our approach, the resulting orienta-tions were used for dense-image-matching purposes under the open-source photogrammetric suite MicMac (http://micmac. ensg.eu) (Rupnik et al.2017). MicMac is based on a multi-resolution-optimisation approach. Image pyramids are used in a coarse to fine matching approach to both improve the pro-cessing time and control the similarity of matches between levels. For a given pyramid level, a multi-image matching is performed using energy minimization based on either graph cut or a modified dynamic programming/semi-global-matching approach (Deseilligny and Paparoditis, 2006). MicMac allows the user to control a range of parameters. Here, dense image matching was performed using the Matching Light Tool (MALT) (Lisein et al. 2013; Pierrot-Deseilligny2014) and a matching strategy optimized for or-tho-photographs. The matching strategy required at least two images. A correlation threshold of 0 was used to densify the 3D point cloud, and the regularization term (taking into ac-count the surface regularity) was set to 0.05. The resulting 3D point clouds were then converted into a DSM at twice the resolution of the raw images, i.e., 1.1 m for 1999, 0.55 m for 2002, and 0.65 m for 2009. These DSMs were then resampled at a 1-m resolution by selecting the highest pixel value in each cell in order to preserve heights. The DSMs were further con-verted into canopy height models (PCHM) using a LiDAR DTM at the same spatial resolution (Fig.1).
2.4 Processing of photogrammetric products
Height percentile distributions were computed for all PCHM subsets obtained using an extraction radius of 15 m, centered on the coordinates of the calibration plots. Only points higher than 1.3 m were considered. These metrics were used to model Ho and growing stocks at plot level. A simple linear regression
was used to estimate Ho from height percentiles. On grounds of parsimony, only the best univariate model presenting the lower residual error (RMSE) was retained to estimate Ho.
To estimate growing stocks, three approaches were used: (i) a linear model with the 99th height percentile as predictor; (ii) a non-linear model previously proposed for LiDAR point clouds (Magnussen et al.2012) with estimates obtained with the nls2 library of the R software (R Core Team 2016). Retained predictors were the median height percentile and the median absolute deviation (MAD) of the PCHM. These parameters were preferred to mean and standard deviation based on their robustness to outliers (Höhle and Höhle 2009); and (iii) a non-parametric approach (RF) using the randomForest library of the R software (R Core Team2016). Five commonly used metrics were extracted from the calibra-tion plots and used for the RF model. They were the minimum and maximum heights of the PCHM, as well as the 25th, 50th, and 75th height percentiles. The number of“trees” grown (ntree) was set to 5000. The RMSE was computed from the out-of-bag sample.
2.5 Photo-interpreted storm damage maps from NFI A map of damage classes was produced by the NFI fol-lowing the 1999 storm (Wencélius 2002). The damage
classes were photo-interpreted according to the proportion of impacted forest cover using a map scale of 1:25,000, with a representation threshold of 1 ha, and a geometric precision of 50 m. An extract of this map, covering an area of interest (AOI) in the Haye forest is in Fig. 2a. Damage classes were as follows: class 1, 0–10%; class 2, between 10 and 50%; class 3, between 50 and 90%; and class 4, between 90 and 100% of the forest cover impacted by the storm.
2.6 Field calibration plots
For the ANR-Foresee project, 25 field calibration plots were established in the Haye forest in March 2009. They were 15 m in radius, and all tree diameters larger or equal to 17.5 cm at a height of 1.3 m were measured using a tape, following the Office National des Forêts (ONF) protocol (Duplat and Perrotte 1981). The height of the six trees with the largest diameter was also measured with a Haglöf Vertex, and their mean was considered as the plot dominant height (Ho) (Pardé and Bouchon1988). The height of the remaining trees was estimated according to allometric relationships presented in St-André et al. (2013), and wood volume was calculated based on tree height and diameter (Deleuze et al.2014). Total wood volumes resulted from the sum of all tree volume per plot. Plot
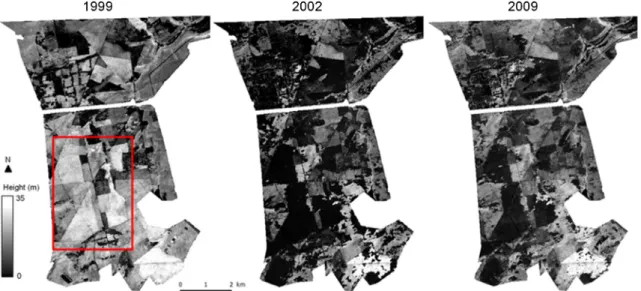
Fig. 1 Illustration of photogrammetric canopy height models for 1999, 2002, and 2009. Gray levels (from dark to white) represent increasing height in meters. In 1999, the area of interest is presented as a red rectangle
Table 1 Image block parameters and root mean square errors (RMSE) of the block adjustment
Month/Year Photograph type
and number
Flying altitude (m) Forward and
side overlaps (%) Ground sampling distance (cm) Block adjustment RMSE (xy-z) (cm) Number ground control points 09/1999 Film 1200 dpi 18 3750 60–20 55 238–170 34 06/2002 Film 1200 dpi 74 1900 80–30 28 29–29 34 09/2009 Digital 29 5400 60–20 33 17–38 43
locations were determined using a differentially corrected Trimble GPS (GeoExplorer XT 6000) with a precision of approximately 1 m.
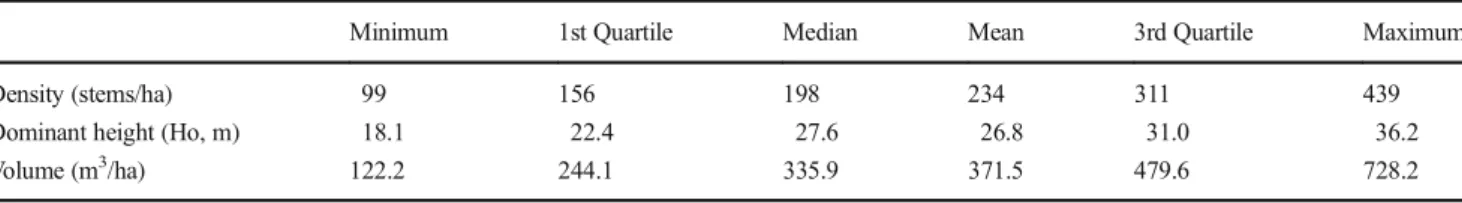
In the calibration plots, common beech (48%) and horn-beam (30%) constitute 78% of the total number of measured trees with common ash ranked third (9%). From 7 to 42 trees were measured per plot (an average of 23). There were one to six species per plot, with an average of three. Dendrometric characteristics of the plots are in Table2.
2.7 Damage assessments
2.7.1 Damage extent, comparison with the NFI map
An empty raster with a pixel size of 26 m (that corre-sponds approximately to the area of the calibration plots used in the modeling phase) was created over an AOI of 15 km2 established within the forest (Fig. 1). This AOI was selected with the sole aim of limiting computing time of our standard desktop computer when the Monte Carlo approach was used to obtain confidence intervals of wood volume estimates. Ho maps were then produced for 1999 and 2002, by applying to each pixel the previously ob-tained linear model (Durrieu et al. 2015). A raster
subtraction was then performed (Ho map of 1999–Ho map of 2002) to highlight areas where Ho changes oc-curred during this period. The resulting raster layer (ΔHo) was then compared to the polygons with damage classes assigned by NFI photo-interpreters. For each poly-gon, a distribution ofΔHo was extracted and summarized by descriptive statistics.
2.7.2 Impacted volume and confidence interval estimation To obtain estimates of growing stock changes in the AOI, the sum of model-based predictions anno 1999 and 2002 of the expected (model-based) value of V in all pixels was computed. The summation was repeated for each of the three models. The change in growing stocks was consid-ered to be heavily dominated by the impact of the wind-throw. The confidence intervals (CI) for the resulting model-based predictions are based on a total of 5000 Monte Carlo simulations. For each simulation run, predic-tions for each pixel in an AOI were obtained using the Cholesky decomposition method (Rubinstein and Kroese
2008). For RF, CIs were estimated from the predictions of the 5000 individual trees of the RF object.
Fig. 2 Photo-interpreted map of storm damage in the area of interest (a). The map was produced by the French National Forest Inventory after the 1999 storm. The 4 damage classes are:
1) 0–10%, 2) 10–50%, 3) 50–
90%, and 4) 90–100%. b The
differences between the 1999 and 2002 dominant height in the area of interest. Lighter gray-tones suggest areas with heavier damage. Photo-interpreted polygons are super-imposed onto the dominant height difference map
Table 2 Main dendrometric characteristics of the field plots (N = 25) surveyed in 2009
Minimum 1st Quartile Median Mean 3rd Quartile Maximum
Density (stems/ha) 99 156 198 234 311 439
Dominant height (Ho, m) 18.1 22.4 27.6 26.8 31.0 36.2
3 Results
3.1 PCHM for each photogrammetric blocks
Figure1 illustrates the PCHM obtained for each year. Even though the altitudinal precision of the 1999 DSM is low (170 cm) compared to 2002 and 2009 (29–38 cm) (Table1), contrasted heights can be clearly identified in the different management units. PCHMs appear to be in a realistic range and consistent with field measurements. As shown in Fig.3, a large majority of the Ho calculated over the AOI is in the interval 20–35 m in 1999, with a drastic shift to lower heights in 2002. However, some negative change values are also ob-served. They are probably due to co-registration problems between the PCHMs and the DTM used for normalization,
and/or due to errors in the correlations used within the image matching process.
3.2 Damage comparison
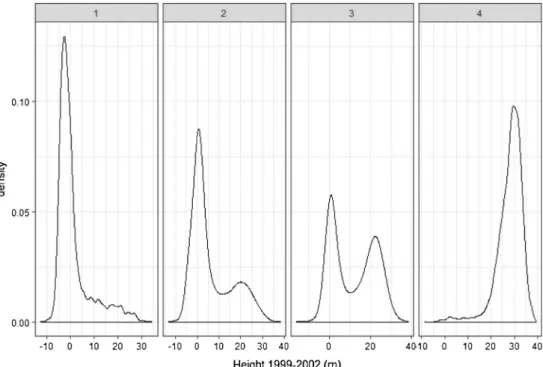
In Fig.2b, the raster of Ho differences between 1999 and 2002 clearly shows zonal differences that are closely linked to the storm damage classes as per the NFI photointerpretation. A summary of the Ho differences by damage class is shown in Fig.4and Table3. A clear increase in Ho differences is ob-served with increasing damage level. However, for the lower damage classes (1 and 2), theΔHo distribution tends toward a mean of 0, suggesting that these classes were only slightly affected by the storm. For areas apparently unaffected by the storm, (damage class 1), the median ΔHo is − 1.3 m,
Fig. 3 Histograms of the 1999 (a) and 2002 (b) dominant height distribution in the area of interest
Fig. 4 Distribution of the variation in dominant height
(1999–2002) for each
photo-interpreted damage classes (1–4)
suggesting an annual height increment of ca. 0.4 m; a realistic figure for mature beech forests within this study area (Charru et al.2010). Interestingly, Fig.4also shows that for damage classes 2 and 3, a bimodal distribution is present, illustrating the“discrete” nature of the storm damage, where some trees are remaining and even growing among area where others have been blown down or removed.
3.3 Dendrometric models and changes in growing stocks From the calibration plots of 2009, models estimating Ho and growing stocks were established (Table4, Fig.5). The close relationship between Ho and the 99th height percentile of plot PCHM is shown by the small deviations from a 1:1 line in Fig.5a. The model obtained for Ho had an adjusted coefficient of determination (R2) of 0.96 and a RMSE of 1.1 m (Table4). Therefore, a good estimation of Ho from the PCHM could be achieved with a simple model.
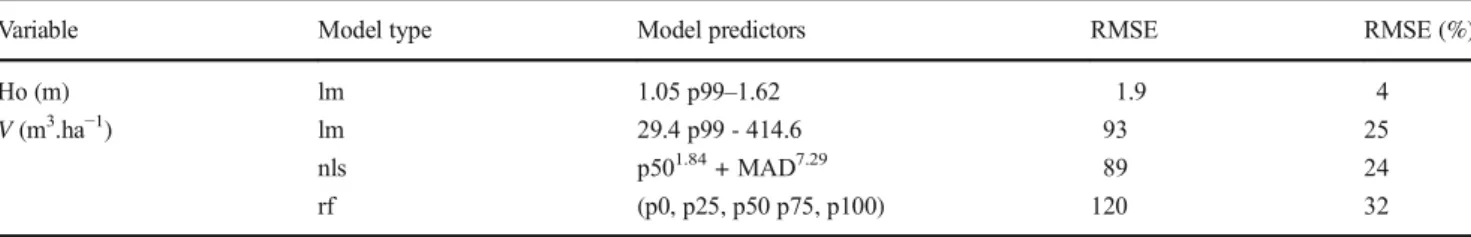
Wood volumes also showed a good relationship with the PCHM metrics. For the non-linear model, the relative RMSE (24%) was slightly lower than for the other models with rela-tive RMSEs of 25 and 32% for the linear regression and the RF, respectively (Table4). An illustration with the linear mod-el with the 99th height percentile as a predictor is in Fig.5b.
All models were used to estimate changes in growing stocks over the AOI. Results are in Table5and in Fig.6. In 1999, the estimation of growing stocks range from ca. 411 to 440 thousand cubic meters. A rather small difference (less than 7%) was observed in the 1999 estimates from the three models. However, after the storm (in 2002), a strong diver-gence in model estimates of growing stock was observed. A difference of more than 50% exists between the estimation resulting from the RF model as compared to the one obtained with the linear model (Table 5). The estimated changes
between 1999 and 2002 are in the range 65–76% for the para-metric models and 42% for RF. The 2002 growing stock esti-mates from RF are far larger than the ones obtained with the parametric models.
4 Discussion
As previously shown by Honkavaara et al. (2013), stereo im-ages could be successfully used to delineate storm damim-ages, and either improve or replace the traditional assessment through photointerpretation, which is an error-prone and labor-intensive process. The regular acquisition of aerial pho-tographs by mapping agencies in several countries further put them at the forefront of storm damage detection.
Our results demonstrated that changes in dominant height can be used to investigate the impact of forest damages on plot structure. Figure4 is particularly relevant, highlighting how the discrete patterns generated by wind-throw are modifying the height distribution. That said, the assessment of volume losses was limited by the number and representativeness of the calibration plots. This limitation has certainly contributed to the very large CIs observed in Fig.6and the greater estimates of the 2002 growing stock from the RF model as compared to estimations from the parametric models. This result is not surprising, as our calibration plots were absent from the dis-turbed areas. This is a known limitation of the model-based approach used in this study (Magnussen2015; Gregoire et al.
2016). Furthermore, the non-parametric approach of RF is data-driven and known to be unable to predict outside its calibration range (Breiman et al. 1984; Breiman 2001). Therefore, in 2002, estimates from the RF model are probably biased toward over-estimating the growing stocks.
Table 3 Dominant height
difference statistics (1999–2002)
by damage class as estimated by photointerpretation (source: NFI) (the damage levels, associated to the damage classes, are given in parenthesis)
Damage classes Minimum 1st Quartile Median Mean 3rd Quartile Maximum
1 (0–10%) − 12.6 − 3.2 − 1.3 1.2 1.9 34.4
2 (10–50%) − 13.1 − 0.2 2.1 6.2 12.6 37.9
3 (50–90%) − 15.9 1.2 10.9 11.7 21.7 38.3
4 (90–100%) − 8.6 25.7 29.1 28.1 31.7 39.4
Table 4 Photogrammetric-based models of dominant height (Ho) and wood volume (V) and corresponding root mean squared error (RMSE).
Modeling framework included linear (lm), non-linear (nls), and random forest (rf). Predictors included are distribution percentiles (pxx), and the median absolute deviation of the height models (MAD)
Variable Model type Model predictors RMSE RMSE (%)
Ho (m) lm 1.05 p99–1.62 1.9 4
V (m3.ha−1) lm 29.4 p99 - 414.6 93 25
nls p501.84+ MAD7.29 89 24
Using LiDAR, Shin et al. (2016) have shown that in Douglas fir forests, 200–250 training plots were an optimal sample size to predict total forest attributes over an AOI. Even though this may depend upon forest structures, it further em-phasize that sampling strategy is of prime importance in order to obtain robust estimators (Grafström et al.2014). Therefore, in an operational design, one would have to rely on a larger number of training plots, representative of all damage classes to be considered. In this way, NFI plots could be legitimate candidates to contribute to such a modeling approach. Vega and St-Onge (2008) used virtual plots from manual stereo-scopic measurements to compensate for the lack of field val-idation data, and to account for the effect of image properties (image type, orientation, base-height ratios, among others) on the photogrammetric reconstruction. Their approach can mit-igate the lack of height measurements in some forest struc-tures, but it is, however, insufficient for the provision of vol-ume estimates. Despite this drawback, uncalibrated PCHM are considered as sufficient for estimating large storm dam-ages (Waser et al.2008, Vastaranta et al.2013), and for the long-term monitoring of forest canopies (Fujita et al.2003).
Another important aspect to consider is the quality of co-registration. Field training plots (in the calibration phase) and image time series have to match accurately. A slight co-registration error may impact the quality of models and affect the accuracy of change-detection (e.g., Waser et al. 2008, Frazer et al. 2011, Hyvönen et al. 2011, Tian et al. 2013;
2017). Therefore, in order to avoid (as much as possible) the effect of image mismatching, we decided to remain at a rela-tively large resolution to estimate forest changes following the 1999 storm (i.e., 26 m). Apparently, at this scale, the differ-ences in image and DSM qualities (Table1) did not impair our assessment of the level of storm damage. At least our results correspond well to the damage assessed by the NFI photo-interprets (Fig.2). This is an interesting result, since it is likely that images obtained before and after a storm might have different acquisition specifications.
For low-level damages, e.g., less than 10 fallen trees per hectare, the precision of NFI map was found to be rather low (Stach and Deshayes2009), but automatic approaches such as the one proposed by Honkavaara et al. (2013) also appears to be inefficient in mapping such kind of complex situations. Ali-Sisto and Packalen (2017) obtained similar results, being able to classify accurately clear cuts (98.6%) using differences in PCHM, but less successful in detecting minor changes such as thinning (obtaining an accuracy of 24.1%) that is difficult to detect with current 3D models of canopy cover, in particular when the thinning results in the removal of smaller trees un-derneath the canopy of dominant trees. Detecting minor storm damages would therefore need further work and refinements. One way forward could come from a crown delineation of the PCHM as proposed by Vega et al. (2014) for LiDAR data.
Fig. 5 Prediction of a dominant height (dash line represents 1:1 line), and b wood volumes (regression line in red) using the 99th height percentile of the photogrammetric canopy height models as predictor
Table 5 Total volume (m3) and volume change modeled with three
approaches for the area of interest (15 km2) before and after the storm
event
Year lm nls rf
1999 422,915 411,514 439,727
2002 102,038 145,091 252,869
However, the approach requires a very high quality DSM, which in turn depends upon the image resolution, image over-laps, sun elevation, as well as on the algorithm used for 3D reconstruction, just to name the important factors (Durrieu et al.2015). It will also be a computer-intensive operation requiring substantial computing resources for processing larg-er areas. As stressed by Wang et al. (2015), such a work would also have to take into account artifacts generated by the image matching process. In this study, we limit ourselves to Ho dif-ference maps with a 26-m resolution. Such a resolution matches well with the spatial extent of NFI plots and allow to filter out local height errors due to image-matching problems.
Aerial photographs are also considered by several authors as a tool to support updates of NFI data and to detect forest cover changes (Massey et al.2014, Ginzler and Hobi 2015, Wang et al.2015, Tian et al.2013;2017). In complex mixed forests, it has been shown that they could be an alternative to airborne LiDAR scanning (ALS) data for modeling key forest attributes such as growing stock, for example (Straub et al.
2013; White et al.2013; Stepper et al.2015). Previous studies, estimating growing stocks with PCHM obtained RMSE rang-ing from 13 to 40% (Järnstedt et al.2012; Bohlin et al.2012; Nurminen et al. 2013; Straub et al.2013; Vastaranta et al.
2013; Stepper et al.2015). Results in terms of RMSE reported in the cited studies are not dissimilar to ours (RMSE of 24– 32%).
This study demonstrated the potential of differences in PCHM to be applied operationally for delineation of damaged areas following a storm. It also allows an estimation of im-pacted stem volume (Fig.6). Technical advances in the field of photogrammetry have eased the extraction of 3D information contained in aerial photographs (Durrieu et al. 2015). The regular acquisition of aerial photographs on large territories may contribute to the improvement of forest parameter esti-mation and mapping in a near future.
5 Conclusion
This study showed that it is possible to use differences in PCHM produced from images acquired before and after a storm event to estimate changes in growing stock attributed to the storm. We produced maps of Ho in 1999 and 2002, with a coarse resolution (i.e., 26 m). In terms of damage mapping, this method appears efficient. However, further work on seg-mentation algorithms should be pursued in order to facilitate the production of maps with similar characteristics as a photo-interpreted map. As image resolutions are sub-meter, PCHM comparison may also allow identification of minor damage, which is otherwise difficult to quantify from ortho-photos and textural metrics. These promising avenues, however, require further research and testing at practically relevant scales.
From the PCHM, we also produced model-based estimates of V that allowed us to estimate changes in Vover an AOI. The methodology and our results suggest a promising potential for exploiting PCHM in pursuit of a rapid quantification of wind-throw damage.
Acknowledgments This work was supported by the French National
Research Agency (ANR) in the Framework of For-Wind project (ANR AgroBiosphère 2012). Field plots were supported in the framework of ANR-10-BIOE-08-07 (Foresee project). The authors greatly thank all the people involved in the field measurements from the Office National des Forêts, as well as reviewers for their comments that helped to improve significantly the paper. ONF Département RDI is supported by the French
National Research Agency (ANR) as part of the “Investissements
d’Avenir” program (ANR-11-LABX-0002-01, Lab of Excellence ARBRE).
References
Albrecht A, Hanewinkel M, Bauhus J, Kohnle U (2012) How does silvi-culture affect storm damage in forests of south-western Germany? Results from empirical modeling based on long-term observations. Eur J For Res 131:229–247
Ali-Sisto D, Packalen P (2017) Forest change detection by using point clouds from dense image matching together with a LiDAR-derived terrain model. IEEE J Sel Top Appl Earth Obs Remote Sens 10:
1197–1206
Bélouard T, Merzeau D, Meredieu C, et al (2012) Évaluation des facteurs de résistance au vent des peuplements de pin maritime après la
tempête Klaus à l’aide des données de l’inventaire forestier.http://
prodinra.inra.fr/record/211010
Birot Y, Landmann G, Bonhême I (2009) La forêt face aux tempêtes. Editions Quae, coll. Synthèses, 433 p
Bohlin J, Wallerman J, Fransson JES (2012) Forest variable estimation using photogrammetric matching of digital aerial images in combi-nation with a high-resolution DEM. Scand J For Res 27:692–699 Breiman L (2001) Statistical modeling: the two cultures (with comments
and a rejoinder by the author). Stat Sci 16:199–231
Breiman L, Friedman J, Stone CJ, Olshen RA (1984) Classification and regression trees. CRC Press, Taylor & Francis 368 p
Charru M, Seynave I, Morneau F, Bontemps J-D (2010) Recent changes in forest productivity: an analysis of national forest inventory data Fig. 6 Volumes and 95% confidence intervals obtained with three
for common beech (Fagus sylvatica L.) in north-eastern France. For
Ecol Manag 260:864–874
Coppin P, Jonckheere I, Nackaerts K et al (2004) Review ArticleDigital change detection methods in ecosystem monitoring: a review. Int J
Remote Sens 25:1565–1596
Deleuze C, Morneau F, Renaud JP et al (2014) Estimer le volume total
d’un arbre, quelles que soient l’essence, la taille, la sylviculture, la
station. Rendez-Vous Tech ONF:22–32
Duplat P, Perrotte G (1981) Inventaire et estimation de l’accroissement
des peuplements forestiers. Office national des forêts. Paris, p 432 Durrieu S, Véga C, Bouvier M, et al (2015) Optical remote sensing of tree
and stand heights. In: Sensing handbook, vol II, land resources mon-itoring, modeling, and mapping with remote sensing, Chapter: 17,
Publisher: CRC Press, Editors: Prasad S. Thenkabail, pp.449–485
Frazer GW, Magnussen S, Wulder MA, Niemann KO (2011) Simulated impact of sample plot size and co-registration error on the accuracy and uncertainty of LiDAR-derived estimates of forest stand
bio-mass. Remote Sens Environ 115:636–649
Fujita T, Itaya A, Miura M et al (2003) Long-term canopy dynamics analysed by aerial photographs in a temperate old-growth evergreen
broad-leaved forest. J Ecol 91:686–693
Gardiner B, Marzano M, Nicoll B et al (2011) Storms—an increasing
threat to Europe’s forests. EFI News 19:10–12
Ginzler C, Hobi ML (2015) Countrywide stereo-image matching for updating digital surface models in the framework of the Swiss
National Forest Inventory. Remote Sens 7:4343–4370
Grafström A, Saarela S, Ene LT (2014) Efficient sampling strategies for forest inventories by spreading the sample in auxiliary space. Can J
For Res 44:1156–1164
Gregoire TG, Næsset E, McRoberts RE et al (2016) Statistical rigor in LiDAR-assisted estimation of aboveground forest biomass. Remote
Sens Environ 173:98–108
Hervé JC, Wurpillot S, Vidal C, Roman-Amat B (2014) The forest
re-sources inventory in France—a fresh view on changed forests. Rev
Fr 66:247–260
Honkavaara E, Litkey P, Nurminen K (2013) Automatic storm damage detection in forests using high-altitude photogrammetric imagery.
Remote Sens 5:1405–1424
Hyvönen P, Heinonen J, Haara A (2011) Change detection using bi-temporal aerial photographs and registration at the stand level. Eur
J For Res 130:637–647
Jonikavičius D, Mozgeris G (2013) Rapid assessment of wind
storm-caused forest damage using satellite images and stand-wise forest inventory data. IFOREST 6:150
Järnstedt J, Pekkarinen A, Tuominen S et al (2012) Forest variable esti-mation using a high-resolution digital surface model. ISPRS J
Photogramm Remote Sens 74:78–84
Leberl F, Irschara A, Pock T et al (2010) Point clouds: Lidar versus 3D
vision. Photogramm Eng Remote Sens 76:1123–1134
Lisein J, Pierrot-Deseilligny M, Bonnet S, Lejeune P (2013) A photo-grammetric workflow for the creation of a forest canopy height model from small unmanned aerial system imagery. Forests 4:
922–944
Magnussen S (2015) Arguments for a model-dependent inference?
Forestry 88:317–325
Magnussen S, Næsset E, Gobakken T, Frazer G (2012) A fine-scale model for area-based predictions of tree-size-related attributes
de-rived from LiDAR canopy heights. Scand J For Res 27:312–322
Magnussen S, Næsset E, Kändler G et al (2016) A functional regression model for inventories supported by aerial laser scanner data or
pho-togrammetric point clouds. Remote Sens Environ 184:496–505
Martins FSRV (2009) Estimativa da altura dominante a partir do sistema de varredura a laser aerotransportado (Lidar) - floresta de Haye Nancy (França) aluna. Universidade de São Paulo - USP Escola
superior de agricultura“Luiz de Queiroz” - ESALQ Departamento
de ciencias Florestais. 65 p
Massey A, Mandallaz D, Lanz A (2014) Integrating remote sensing and past inventory data under the new annual design of the Swiss National Forest Inventory using three-phase design-based regression
estimation. Can J For Res 44:1177–1186
Miller DR, Quine CP, Hadley W (2000) An investigation of the potential of digital photogrammetry to provide measurements of forest
char-acteristics and abiotic damage. For Ecol Manag 135:279–288
Mitchell AL, Rosenqvist A, Mora B (2017) Current remote sensing ap-proaches to monitoring forest degradation in support of countries measurement, reporting and verification (MRV) systems for REDD+. Carbon Balance Manag 12:9
Nurminen K, Karjalainen M, Yu X et al (2013) Performance of dense digital surface models based on image matching in the estimation of plot-level forest variables. ISPRS J Photogramm Remote Sens 83:
104–115
Pardé J, Bouchon J (1988) Dendrométrie, 2 ed., entièrement refondue. Ecole Nationale du génie rural, des Eaux et Forêts. Paris. 328 p Pierrot-Deseilligny M (2014) Micmac documentation : MicMac, Apero,
Pastis and Other Beverages in a Nutshell !http://logiciels.ign.fr/
IMG/pdf/docmicmac-2.pdf
Core Team R (2016) R: a language and environment for statistical com-puting. R Foundation for Statistical Computing, Vienna
Remondino F, Spera MG, Nocerino E et al (2014) State of the art in high
density image matching. Photogram Rec 29:144–166
Rubinstein RY, Kroese DP (2008) Simulation and the Monte Carlo Method, 2nd edn. John Wiley & Sons 372 p
Rupnik E, Daakir M, Deseilligny MP (2017) MicMac—a free, open-source
solution for photogrammetry. Open geospatial data, softw stand 2:14 Schelhaas M-J, Nabuurs G-J, Schuck A (2003) Natural disturbances in the European forests in the 19th and 20th centuries. Glob Change
Biol 9:1620–1633
Shin J, Temesgen H, Strunk JL, Hilker T (2016) Comparing modeling methods for predicting forest attributes using LiDAR metrics and
ground measurements. Can J Remote Sens 42:739–765
Stach N, Deshayes M (2009) Estimation des dégâts de tempête : l’oeil,
l’avion et le satellite. In: Birot Y, Landmann G, Bonhême I (eds) La
forêt face aux tempêtes. Editions Quae, coll. Synthèses, pp 49–68
St-André L, Munoz A, Bock J, et al (2013) Modèles allométriques utilisés pour estimer les volumes des arbres. Projet ANR-10-BIOE-008, ANR Foresee, Deliverable L35, 11 p
Stepper C, Straub C, Pretzsch H (2015) Using semi-global matching point clouds to estimate growing stock at the plot and stand levels: appli-cation for a broadleaf-dominated forest in central Europe. Can J For
Res 45:111–123
St-Onge B, Vega C, Fournier RA, Hu Y (2008) Mapping canopy height using a combination of digital stereo-photogrammetry and lidar. Int J
Remote Sens 29:3343–3364
Straub C, Stepper C, Seitz R, Waser LT (2013) Potential of UltraCamX stereo images for estimating timber volume and basal area at the plot
level in mixed European forests. Can J For Res 43:731–741
Tian J, Reinartz P, d’Angelo P, Ehlers M (2013) Region-based automatic
building and forest change detection on Cartosat-1 stereo imagery.
ISPRS J Photogramm Remote Sens 79:226–239
Tian J, Schneider T, Straub C et al (2017) Exploring digital surface models from nine different sensors for forest monitoring and change detection. Remote Sens 9:287
Vastaranta M, Wulder MA, White JC et al (2013) Airborne laser scanning and digital stereo imagery measures of forest structure: comparative results and implications to forest mapping and inventory update.
Can J Remote Sens 39:382–395
Vega C, Hamrouni A, El Mokhtari S, et al (2014) PTrees: a point-based approach to forest tree extraction from lidar data. Int J Appl Earth
Obs Geoinformation 33:98–108
Vega C, St-Onge B (2008) Height growth reconstruction of a boreal forest canopy over a period of 58 years using a combination of
Vega C, St-Onge B (2009) Mapping site index and age by linking a time series of canopy height models with growth curves. For Ecol Manag
257:951–959
Wang Z, Ginzler C, Waser LT (2015) A novel method to assess short-term forest cover changes based on digital surface models from
image-based point clouds. Forestry 88:429–440
Wang F, Xu X (2010) Comparison of remote sensing change detection techniques for assessing hurricane damage to forests. Environ Monit
Assess 162:311–326
Waser LT, Baltsavias E, Ecker K et al (2008) Assessing changes of forest area and shrub encroachment in a mire ecosystem using digital sur-face models and CIR aerial images. Remote Sens Environ 112:
1956–1968
Wencélius F (2002) December 1999 storms—an assessment of the
dam-age to forests by the national forest inventory. Tempêtes Déc 1999
Éval Dégâts For Par Inventaire For Natl 54:20–30
White JC, Wulder MA, Vastaranta M et al (2013) The utility of image-based point clouds for forest inventory: a comparison with airborne