HAL Id: hal-02961091
https://hal.archives-ouvertes.fr/hal-02961091
Submitted on 8 Oct 2020
HAL is a multi-disciplinary open access
archive for the deposit and dissemination of
sci-entific research documents, whether they are
pub-lished or not. The documents may come from
teaching and research institutions in France or
abroad, or from public or private research centers.
L’archive ouverte pluridisciplinaire HAL, est
destinée au dépôt et à la diffusion de documents
scientifiques de niveau recherche, publiés ou non,
émanant des établissements d’enseignement et de
recherche français ou étrangers, des laboratoires
publics ou privés.
Francesco Talotta, Martial Boggio-Pasqua, Leticia González
To cite this version:
Francesco Talotta, Martial Boggio-Pasqua, Leticia González. Early Relaxation Dynamics in the
Photo-switchable Complex trans-[RuCl(NO)(py)4]2+. Chemistry - A European Journal, Wiley-VCH Verlag,
2020, 26 (50), pp.11522-11528. �10.1002/chem.202000507�. �hal-02961091�
&
Relaxation Dynamics
Early Relaxation Dynamics in the Photoswitchable Complex
trans-[RuCl(NO)(py)
4
]
2+
+
Francesco Talotta,
[a, b, c]Martial Boggio-Pasqua,
[b]and Leticia Gonz#lez*
[a, d]Abstract: The design of photoswitchable transition metal complexes with tailored properties is one of the most impor-tant challenges in chemistry. Studies explaining the underly-ing mechanisms are, however, scarce. Herein, the early relax-ation dynamics towards NO photoisomerizrelax-ation in trans-[RuCl(NO)(py)4]2+ is elucidated by means of non-adiabatic
dynamics, which provided time-resolved information and branching ratios. Three deactivation mechanisms (I, II, III) in the ratio 3:2:4 were identified. Pathways I and III involve ul-trafast intersystem crossing and internal conversion, whereas pathway II involves only internal conversion.
Introduction
The photochromism of ruthenium nitrosyl complexes and its capability to photorelease nitric oxide has numerous applica-tions, from material engineering to digital information storage up to the field of photodynamic therapy.[1–3] In this category, trans-[RuCl(NO)(py)4]2+ (Scheme 1) has attracted considerable attention due to its reversible high photoswitching ability by using different laser wavelengths:[4–6] On continuous light irra-diation at approximately 473 nm for 1 h, a conversion yield of approximately 100% is achieved on a single crystal, while sub-sequent irradiation at 980 nm regenerates the original crystal.[5] In contrast, NO dissociation only occurs with low quantum yield in the liquid phase.[7]Insight into the N!O linkage pho-toisomerization is thus of utmost importance to design novel
electronic devices. However, the only mechanistic information avail-able is based on punctual station-ary calculations of selected poten-tial-energy surfaces (PESs) of such complexes,[8–11] and dynamical studies have never been per-formed for these complexes.
Herein, we report the first study on the relaxation dynamics of
trans-[RuCl(NO)(py)4]2+ to investigate the early steps towards photoisomerization, including both non-adiabatic internal con-version (IC) and intersystem crossing (ISC) processes. For sim-plicity, we carried out non-adiabatic excited-state dynamics only in the gas phase to describe the processes occurring in the crystal structure using trajectory surface-hopping meth-ods.[12] We reveal the role of the singlet and triplet excited states in the isomerization mechanism, establish the branching ratio between different isomerization pathways and identify the most important quenching funnels that make the NO pho-toisomerization process less efficient.
To facilitate the interpretation of the dynamical simulations it is useful to review here briefly the results of the available sta-tionary calculations. Previous DFT[8] and MS-CASPT2[11] station-ary calculations, complemented by visible absorption spectros-copy,[13] indicated that nitrosyl photoisomerization is a two-step reaction with sequential two-photon absorption and non-adiabatic transitions. Assuming efficient nonradiative decays by IC and ISC from the singlet excited states towards the lowest triplet state, the DFT stationary calculations of the lowest PESs suggest the mechanism shown in Figure 1. The most stable ground-state isomer, labelled1GS, is an orange crystal that cor-responds to an N-bonded structure with a Ru-N-O bond angle of 1808. Upon absorption of the first blue photon, the complex is excited to a metal-to-ligand charge-transfer (MLCT) singlet degenerate (S1 and S2) state, from which relaxation following two different nonradiative pathways is plausible. In the first
Scheme 1. Schematic repre-sentation of trans-[RuCl(NO)-(py)4]2+(py=pyridine).
[a] F. Talotta, Prof. Dr. L. Gonz#lez
lnstitute of Theoretical Chemistry, Faculty of Chemistry University of Vienna, W-hringer Strasse 17, 1090 Vienna (Austria) E-mail: leticia.gonzalez@univie.ac.at
[b] F. Talotta, M. Boggio-Pasqua
Laboratoire de Chimie et Physique Quantiques, UMR 5626, lRSAMC CNRS et Universit8 Toulouse 3
118 route de Narbonne, 31062 Toulouse (France) [c] F. Talotta
Present Address: Laboratoire de Chimie Physique UMR 8000 CNRS/University Paris-Sud
University Paris-Saclay, 91403 Orsay, and lnstitut de Sciences Moleculaires d’Orsay, UMR 8214 CNRS/University Paris-Sud, University Paris-Saclay 91403 Orsay (France)
[d] Prof. Dr. L. Gonz#lez
Vienna Research Platform on Accelerating Photoreaction Discovery University of Vienna, W-hringer Strasse 17, 1090 Vienna (Austria) Supporting information and the ORCID identification number(s) for the au-thor(s) of this article can be found under:
https://doi.org/10.1002/chem.202000507.
T 2020 The Authors. Published by Wiley-VCH GmbH. This is an open access article under the terms of the Creative Commons Attribution License, which permits use, distribution and reproduction in any medium, provided the original work is properly cited.
pathway (pathway I, solid arrows in Figure 1), the complex is expected to undergo several IC and ISC processes until it reaches the lowest triplet state T1. According to the MS-CASPT2 calculations,[11] the substantial spin–orbit couplings (SOCs) between the singlets S1, S2 and the triplets T1, T2, T3 (SOC values range from ca. 150 to ca. 250 cm@1), together with the close proximity of these excited states, should favour the ISC towards the triplets. Once in the T1 state, the complex re-laxes to the N-bonded triplet minimum, labelled 3GS. From here, the system can either relax back to the 1GS isomer through ISC via the easily accessible MECP1 (orange dotted line), or proceed towards the metastable1MS2[6]isomer by an-other ISC through MECP2. According to the DFT energy profiles of Figure 1, the latter route requires surmounting a barrier of 0.67 eV; however, as MS-CASPT2 shifts the triplet PES upwards by about 0.6 eV,[11] the barrier between the N-bonded 3GS isomer and MECP2 is considerably lower (<0.1 eV), and this suggests an efficient route to the1MS2 intermediate.
The second non-radiative relaxation pathway (pathway II, black dashed arrow) involves exclusively IC among singlet states. This path leads directly to the NO-bonded singlet inter-mediate state1MS2 through a conical intersection between S
1 and S0near the transition state1TS1. Both time-dependent DFT
(TD-DFT) and MS-CASPT2 calculations[8,11] suggest that the metastable isomer1MS2 can absorb a second blue photon and be re-excited to a1MLCT singlet state, which again relaxes by following two distinct non-radiative pathways. In the first, the system undergoes ISC and IC to reach the NO-bonded 3MS2 isomer, from which the3MS1 is accessed after overcoming the barrier associated with 3TS2. From 3MS1 an additional ISC through MECP4 leads finally to the O-bonded 1MS1 isomer (solid black arrows). As in the case of the first photon, the MS-CASPT2 calculations predict that the last isomer1MS1 can also be alternatively reached by a pathway involving only singlet states (second dashed line in Figure 1). The final photoproduct (1MS1) does not absorb in the blue spectral range and it is ob-served as a stable green crystal.[8,11,13] In the forthcoming dy-namical study, we thus focus on the first part of the isomeriza-tion, that is, from1GS to1MS2.
Computational Details
Ideally, the most appropriate way to describe this complex is with multiconfigurational multistate complete active space second order perturbation theory (MS-CASPT2).[11]Unfortunately, on-the-fly
surface hopping trajectories at the CASPT2 level of theory for a complex of this size are currently out of reach due to the immense computational effort required. An alternative formalism to perform dynamical calculations would be to use precalculated parameter-ized potential-energy surfaces (PESs) on which to propagate wave packets, but this would require to know which are the essential co-ordinates involved in the photoisomerization and hope that these are either very few and then can be computed with a high-level of theory, such as CASPT2, or that the isomerization can be described, for example, by simple vibronic coupling models.[14]
To avoid a bias of the presumably complex configurational space, in this work we resorted to full-dimensional trajectory surface-hop-ping methods[15,16]using an affordable level of theory for the
on-the-fly calculations of required electronic properties. Specifically, we employed the SHARC approach,[16–18] which is able to describe
IC and ISC on the same footing, as demonstrated in a photophysi-cal study on the related [Ru(bpy)3]2+ complex.[19] TD-DFT was
chosen as best compromise between efficiency and usability. The limitations and weaknesses of this approach are discussed below. In particular, DFT cannot handle potential fragmentation, and the proximity of the S1and S0brings instabilities, which only a
multi-configurational method can properly account for. However, TD-DFT is the most accurate method that can be computationally used for the system and we expected it to bring new insights complemen-tary to stationary calculations.
Accordingly, the electronic energies, gradients and spin–orbit cou-plings (SOCs) were obtained on-the-fly by using TD-DFT, for which a new version of the ADF program package[20]had to be optimized
to deal efficiently with the SHARC workflow. Non-adiabatic cou-plings were obtained by using wave function overlaps.[21]As
densi-ty functional, BP86[22,23]was chosen, together with the
Tamm–Danc-off approximation (TDA).[24] The choice of this functional is based
on the realization that pure functionals, such as BP86, best de-scribe the singlet–triplet gaps of Ru complexes.[25]Hybrid
function-als such as B3LYP deliver better excitation energies; however, for surface-hopping small errors in state crossings are preferable over small errors in excitations energies that only lead to a shift in the absorption spectrum. Moreover, the character and ordering of the states at the equilibrium geometry predicted by BP86 agree with Figure 1. Potential-energy profiles for the singlet (blue) and triplet (red)
elec-tronic states according to the stationary B3LYP calculations of ref. [8]. The re-action coordinate is the Ru-N-O angle. The three singlet or triplet minima
1,3GS,1,3MS2 and1,3MS1 correspond to the N-bonded, Nbonded and
O-bonded isomers, connected by transition states (TS1, TS2 and3TS1,3TS2).
The geometry of the Cl-Ru-N-O molecular fragment is shown for each isomer (pyridine ligands have been omitted for clarity). Double-cone picto-grams represent the minimum-energy crossing points (MECP) between the singlet and the triplet states. Vertical blue lines represent the absorption of two photons from the GS and MS2 isomers. The solid black arrows indicate the photoisomerization pathways I from the GS isomer to1MS2 and from 1MS2 to1MS1, respectively, involving IC and ISC. The black dashed lines
indi-cate the additional photoisomerization pathways II proposed according to MS-CASPT2 calculations,[11]which involve only IC.
MS-CASPT2 taken as a reference.[25]As the state crossing energetics
were much better with BP86 than with B3LYP, the former function-al was selected for dynamics. We are nevertheless mindful of some differences between the PESs obtained with BP86 and MS-CASPT2 (Figure S1 in the Supporting Information), which are a prerequisite to correctly interpret the dynamical results. Further computational details can be found in the Supporting Information.
According to the available experimental data, at the equilibrium geometry only the bright states S1/S2 are populated by a blue
photon.[13,26]Initially, these two states must be equally populated,
as they form a Jahn–Teller degeneracy (see also Figure S1 in the Supporting Information). Thus, trajectories were prepared in the S1/S2pair of states and propagated within the lowest three singlet
states (S0, S1, S2) and the three lowest triplet states (T1, T2, T3).
Results and Discussion
Absorption spectrum and initial conditions
We employed a Wigner distribution from 500 initial geometries to calculate the first band of the absorption spectrum of trans-[RuCl(NO)(py)4]2+. This is composed of the two degenerate 1MLCT states, S
1and S2(see Figure 2). Because of the degenera-cy, the two absorption bands appear almost identical in terms of energies and oscillator strengths. The overall spectrum peaks around 2.44 eV (508 nm), which is in reasonable agree-ment with the experiagree-mental maximum of 2.75 eV (450 nm) measured in acetonitrile,[26] taking into account the usual un-derestimation of GGA functionals.[27,28]
The irradiation wavelength was chosen not necessarily to tune the maximum of the S0!S1/S2 absorption band, but to optimize the photoconversion efficiency of the1GS isomer. Ac-cordingly, initial conditions for dynamics were selected from a window of 473 nm (2.61 eV) with :0.25 eV, as in the photo-conversion experiment.[5] From the original 500 initial Wigner geometries, a total of 144 initial conditions were selected on
the basis of the procedure described in ref. [29], of which 74 were instantaneously excited to the S1 state and 70 to the S2 state. From them, 47 trajectories (33 %) propagated during 1 ps, while the remaining 97 trajectories (67 %) stopped within the first 200 fs, that is, as soon as they reached the zone near TS1 where S0and S1get close in energy, suffer instabilities and the calculation is terminated. Although this is a severe problem of DFT, the behaviour of the trajectories was systematic and al-lowed us to clearly identify all these “conflicting” trajectories with a particular mechanism.
Dynamical studies
The dynamical simulations revealed three distinct relaxation mechanisms, which will be discussed separately. Two sets of trajectories nicely confirm the coexistence of pathways I and II predicted by stationary calculations, while a third pathway (de-noted as III) emerged from the simulations.
Figure 3A shows the temporal evolution of the classical pop-ulation ensemble for the subset of trajectories that reached 1 ps (pathway I). The population data were fitted and boot-strapped[30]to estimate time constants associated with the var-ious processes. Initially, the S1and S2excited states are equally populated (&50 %) but within few femtoseconds the triplet states start to become populated due to ISC, so that after ap-proximately 100 fs (see inset of Figure 3A), the population is inverted from the singlet to the triplet state. The fitting proce-dure estimates a time constant of 160 :30 fs for this process, corresponding to approximately 750 fs to reach a triplet yield of 99%. This can be considered an ultrafast ISC, albeit slower than those measured and calculated in other transition metal complexes.[19,28,31–33]
A closer look at the individual state populations reveals that the moderate decay rate of the singlets is essentially due to slow depopulation of the S1state. Within 300 fs the population of S2drops to 2%, whereas S1still remains substantially popu-lated (ca. 15%). A hopping-event analysis between each pair of states reveals that S2relaxes to the T3 state, whereas S1 re-laxes towards the T2state. Accordingly, the non-adiabatic tran-sition S2!T3is more efficient than S1!T2. This large difference between the two pairs of states can be explained by the mag-nitude of the SOC between the excited states. Near the Franck–Condon region, the S2/T3pair shows a SOC of approxi-mately 100 cm@1, whereas that of S
1/T2 is only approximately 40 cm@1. The analysis of the one-electron transition density matrix of the excited states in the Franck–Condon region shows that the smaller value of the SOC between S1and T2is compatible with the El-Sayed rule,[34] in the sense that S
1 and T2 share the same character in their electronic transitions, whereas the wave-function character of T3 is different from that of S1 or S2 (see Figure S2 of Supporting Information). Upon relaxation to T3, the system continues to be deactivated non-radiatively through IC towards T2with a time constant of 180:20 fs, and eventually to T1 with a fitted constant of 150:20 fs. These initial findings underline the role played by the ISC and triplet states in the NO photoisomerization of trans-[RuCl(NO)(py)4]2+.
Figure 2. TD-BP86 convoluted absorption spectra of the trans-[RuCl(NO)-(py)4]2+molecule from the first two excited states S1and S2, obtained from
a Wigner distribution of1GS including 500 initial geometries. The vertical
blue dashed line represents the experimental excitation energy of 2.61 eV (473 nm) and the red dashed lines delimit the energy window of 0.25 eV centred at 2.61 eV, from which initial geometries and velocities were taken.
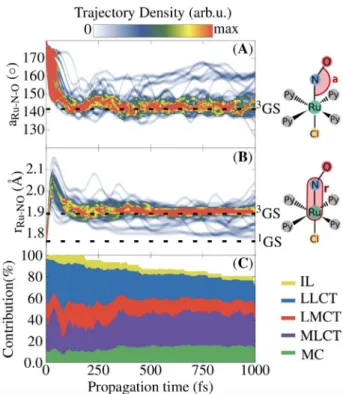
More insight into the dynamics can be obtained by analyz-ing the geometrical changes induced by the various relaxation processes discussed above. The time evolution of the Ru-N-O angle and Ru@NO distance, which are the most important co-ordinates related to the N!O linkage isomerization, are shown in Figure 4A and B, respectively, as a convoluted distri-bution of the ensemble of trajectories. Additionally, the analy-sis of the excited-states character in terms of charge transfer numbers is shown in Figure 4C as a stacked plot. Depending on the hole and electron directions, charge-transfer numbers allow[35]classification of the states as intraligand (IL), ligand-to-ligand charge transfer (LLCT), ligand-to-ligand-to-metal charge transfer (LMCT), MLCT, or metal centred (MC). The other ligands Py and Cl do not partake in the photoisomerization process, as point-ed out in a previous study.[8]
Initially, the geometry of the1GS isomer undergoes coherent bending of the nitrosyl ligand, from almost a linear Ru-N-O configuration to approximately 1428 in about 160 fs. The analysis of the excited-states character in Figure 4C reveals a
correlation between the Ru-N-O bending and the increase of the MLCT character, at the expense of a decrease of the LLCT character (see the noticeable peak of the MLCT character within the first 80 fs). Such an increase of the MLCT has already been found in stationary calculations of other nitrosyl com-plexes.[28,36,37] The angle of 1428 reached during this time is consistent with the optimized Ru-N-O bending angle of the 3GS isomer, de facto the nearest reachable minimum along the N!O isomerization pathway (see Table S7 and Figure S7 in the Supporting Information). Concomitant to the Ru-N-O bend-ing, the Ru@NO distance elongates, increasing from approxi-mately 1.76 A (the value of the 1GS isomer) to approximately 2.20 a during the first 60 fs. This elongation is thus also related to the increasing MLCT character of the excited states. Within 160 fs the Ru@NO bond stabilized at approximately 1.90 a, consistent with the bond length found for 3GS. Accordingly, from a structural point of view, the trajectories reach the mini-mum 3GS within 160 fs. However, such a short time is not enough for all the trajectories to relax to the lowest triplet state T1, as the S1 state is still substantially populated at this stage, also due to the weak SOC between S1with its nearest triplet state T2. Furthermore, inspection of the TD-DFT single-point calculations showed that the geometry of3GS is also a minimum in the S1PES (see Figure S7 in the Supporting Infor-Figure 3. Time evolution of the state populations of the electronic ground
and excited states of trans-[RuCl(NO)(py)4]2+corresponding to the
trajecto-ries that reached 1 ps (A) and 300 fs (B). The inset shows the population of the S0state, the sum of S1and S2populations (8S1,2), and the sum of T1, T2
and T3population (8T1–3). Thick lines show the fitted functions on top of the
corresponding raw population data.
Figure 4. Time-dependent distribution of the Ru-N-O angle (a) and Ru@NO bond length (B) for the 47 trajectories related to pathway I. The Ru-N-O data were smoothed out with a Gaussian smoothing kernel, applied at intervals equal to the Ru-N-O vibrational period of 64 fs. Similarly, the Ru-NO data were smoothed out with a period of 80 fs. The two sets of data were convo-luted later, by using a Gaussian convolution kernel. C) Time evolution of the state character (IL, LLCT, LMCT, MLCT and MC) as a stacked population, calcu-lated from the charge-transfer number decomposition, averaged over all the states of the 47 trajectories.
mation). Thus, the discussed Ru-N-O angle and Ru@NO bond length also correspond to some trajectories remaining in S1.
Upon relaxation to3GS, most trajectories fluctuate in energy until the end of the propagation time, as shown by the thick-ening of the ensemble in Figures 4A and B around the 3GS equilibrium value. A few other trajectories deviate from this minimum and relax back to the original1GS geometry through ISC between T1 and S0. A look at the T1!S0hopping geome-tries (see Figure S3 in the Supporting Information) indicates that the ISC occurs near the easily accessible MECP1. With TD-BP86 this crossing point is located in between the 3GS and 1MS2 intermediate, 0.17 eV above 3GS (see Figure S7 and Table S7 in the Supporting Information). The trace of the T1! S0hopping is also apparent from Figure 3, as the population of the S0 state recovers starting from 250 fs, while T1 starts to become depopulated after 750 fs. The depletion of the norm of the one-electron transition density matrix (see Figure 4C) is also a consequence of the ISC from T1!S0. The analysis of the net hops confirms that the T1 depletion is directly related to the occurrence of the crossings near MECP1 (Figure S3 in the Supporting Information). This relaxation pathway represents a major quenching funnel that could make the entire photoiso-merization process quite inefficient, as it reverts the system back to the original isomer 1GS. Given the small number of events (only 8 (5%) trajectories out of 144) that undergo T1! S0 ISC within 1 ps, the calculated time constant has a large error (1600 :600 fs) and should also be considered only quali-tatively.
The dynamical events related to pathway I are summarized on the right-hand side of Figure 5. The dynamics simulations could find the mechanism proposed[8,11] by stationary calcula-tions (Figure 1), although none of the trajectories reach the final intermediate state 1MS2 due to the short propagation times and the systematic underestimation of the triplet excita-tion energies by TD-BP86 with respect to MS-CASPT2,[25]which affects the position of the two T1/S0 MECPs. In particular, the position of MECP2is crucial, as it allows for the3GS!1MS2 pas-sage (see Figure S7 in the Supporting Information). Because, according to TD-BP86, MECP2is located 0.62 eV above the min-imum3GS (see Table S7 in the Supporting Information), a large barrier must be surmounted to reach 1MS2. Thus, the 3GS! 1GS pathway through the MECP
1is boosted instead, in accord-ance with the more affordable (0.17 eV) barrier between 3GS and MECP1. These facts indicate that TD-BP86 artificially hin-ders the1GS!1MS
2isomerization, which otherwise should be favourable, according to MS-CASPT2 (smaller gap between the singlet and triplet states). This hand-in-hand analysis of the dy-namical simulations with the quantum chemical calculations is thus critical to reach a comprehensive interpretation of the complex photochemistry of trans-[RuCl(NO)(py)4]2+.
We now briefly discuss the mechanisms behind the trajecto-ries related to pathways II and III, which account for 64% of the trajectories. These trajectories are terminated within 30– 200 fs, as soon as the S1 and S0 state are less than approxi-mately 0.2 eV around TS1 and the multireference character of the ground state wave function becomes significant. Figure 3B shows that within 200 fs the singlet population reaches 35%
and the triplet population 65 %; however, on normalizing the 64% with respect to the 144 trajectories, these rates corre-spond to 24% of singlet and 43% of triplet population. The as-sociated values of the Ru-N-O angle and Ru@NO bond length (see Figure S4 in the Supporting Information) show that all the trajectories halt between 3GS and TS1. The singlet trajectories undergo a series of IC transitions bringing population to S1 and S0in the region around TS1 (see Figure S4 in the Support-ing Information). None of these trajectories stopped on S2, and this suggests ultrafast radiationless decay from this state, as was seen in the trajectories pertaining to pathway I. However, in this case depopulation is also due to the rapid energy in-crease of S2in the region between3GS and TS1 (see Figure S7 in the Supporting Information). Indeed, at 3GS the stationary BP86 calculations predict an S1–S2 energy gap of 0.32 eV, whereas at TS1 this gap becomes 0.7 eV. On the other hand, in the same region the S0energy increases with increasing Ru-N-O bending angle, whereas the S1 energy decreases (see Fig-ure S7 in the Supporting Information) and, as a result, the S0– S1energy gap reduces. Although near the transition state TS1 the gap was calculated to be 0.24 eV by stationary calculations (see Figure S7 in the Supporting Information), the dynamical simulations demonstrate that these two states can get closer, supporting the presence of a S1/S0 conical intersection near TS1 that can promote efficient formation of1MS2 through the singlet manifold, as suggested by the MS-CASPT2 calcula-tions.[11]It can thus be assumed that the S
1state will undergo IC through this conical intersection, with the two main ground-state relaxation pathways leading to1GS and1MS2. Be-cause the momentum associated with the Ru-N-O angle is
Figure 5. Kinetic and mechanistic model for the photoisomerization of trans-[RuCl(NO)(py)4]2+, according to the SHARC dynamics. On the right (light
green background) the deactivation mechanism related to pathway I and on the left (grey background) that of pathway II. 74 and 70 (light blue digits) trajectories were prepared in the excited states S1and S2, respectively. Out
of the 74 (70) trajectories, 24 (23) followed pathway I, 21 (14) pathway II, and 29 (33) pathway III. Solid arrows indicate net population transfer be-tween pairs of adiabatic states: green for ISC, blue for IC bebe-tween singlet states and red for IC between triplet states. The width of the arrows is pro-portional to the number of net hops (Table S3 and Table S5 in the Support-ing Information). Dashed arrows indicate steps not directly observed in the dynamics but extrapolated from stationary MS-CASPT2 calculations.
mainly decreasing at the time when the trajectories crash (see Figure S5 in the Supporting Information), we expect the relaxa-tion path to1MS2 to be favoured over the backward return to 1GS for inertial reasons (pathway II shown in Figure 1 and dashed blue arrows of Figure 5, left). To support this scenario, 20 crashed trajectories were restarted, half from an Ru-N-O angle of 1008, and half from 908, ready to overtake the S1/S0 near-degeneracy region, and indeed 1MS2 is readily attained within 50–100 fs (see Figure S6 in the Supporting Information), which confirms this hypothesis. The remaining trajectories that halted on a triplet state underwent efficient ISC and IC transi-tions (Figure 3B), similar to pathway I, but here the ISC is faster (80 fs). It appears that these trajectories also reach the TS1 region, as observed in the S1relaxation along pathway II, and again this causes SCF convergence failure. According to TD-BP86 stationary calculations, the T1energy in this TS1 region is similar to that of T1at MECP2(see Figure S7 in the Supporting Information). Reaching this crossing point involves no energy barrier and little structural change. Pathway III is thus a hy-pothesis that relies on the assumption that the T1 population can be transferred to S0by ISC via the accessible MECP2.
Conclusion
We propose that NO photoisomerization in trans-[RuCl(NO)-(py)4]2+ can proceed by three mechanisms coexisting with a ratio of about 3:2:4 during the first 200 fs. Crucial to each pathway is the presence of non-radiative ISC and IC, which compete on pathways I and III, whereas IC alone is present on pathway II. Pathway I is followed by 33% of the trajectories, which undergo IC and ISC towards the triplet minimum3GS in the T1 PES. ISC occurs with a time constant of 160 :30 fs. Within the 1 ps simulation time, a small amount (5%) of trajec-tories come back to the starting isomer1GS, and this highlights one of the possible quenching funnels that can slow down the entire photoisomerization process. 24% of the trajectories belong to pathway II and halt in the region near TS1 in singlet state S1or S0 within the first 200 fs. This mechanism does not involve ISC, but only IC relaxation towards TS1 or the nearby conical intersection to eventually reach1MS2 by another IC. Fi-nally, 43% of the trajectories halted on a triplet state during the first 200 fs in the region near TS1 (pathway III), which simi-larly to pathway I, involves ISC and IC, but has a faster ISC pro-cess with a time constant of 80 fs. Once in the triplet state these trajectories could either reach 1MS2 by ISC through the nearby MECP2 or undergo barrierless relaxation back to the minimum3GS.
The three mechanisms highlight the versatility of trans-[RuCl(NO)(py)4]2+as a photoswitching agent, and evidence the complexity of ruthenium nitrosyl photochemistry. The present study also illustrates the complementarity of stationary quan-tum chemical calculations and dynamical simulations, as high-level quantum chemical calculations are indispensable to assess the validity of the different regions of the PES and criti-cally interpret the outcome of the dynamics.
Acknowledgements
Funding from the ITN-EJD-TCCM under the Marie Skłodowska-Curie grand agreement No. 642294 (TCCM) is gratefully ac-knowledged. M.B.-P. acknowledges the support of the French ANR funding through the grant No. ANR-18-CE29-0012. The authors thank S. Mai for his support with the SHARC package and E. van Lenthe with the implementations in ADF. The Vienna Scientific Cluster (VSC) is acknowledged for kind alloca-tion of computaalloca-tional resources.
Conflict of interest
The authors declare no conflict of interest.
Keywords: density functional calculations · nitrosyl ligands · photoswitches · relaxation dynamics · ruthenium
[1] P. C. Ford, J. Bourassa, K. Miranda, B. Lee, I. Lorkovic, S. Boggs, S. Kudo, L. Laverman, Coord. Chem. Rev. 1998, 171, 185 –202.
[2] M. J. Rose, P. K. Mascharak, Coord. Chem. Rev. 2008, 252, 2093 – 2114. [3] J. K. Szacilowski, Chem. Rev. 2008, 108, 3481 –3548.
[4] D. Schaniel, B. Cormary, I. Malfant, V. Lydie, V. Theo, V. Bernard, K. V. Kramer, H.-U. Gudel, Phys. Chem. Chem. Phys. 2007, 9, 3717 –3724. [5] B. Cormary, I. Malfant, L. Valade, M. Buron-Le Cointe, L. Toupet, T.
Todor-ova, B. Delley, D. Schaniel, N. Mockus, T. Voike, K. Fejfarov#, V. Petrˇ&cˇek, M. Dusek, Acta Crystallogr. Sect. B 2009, 65, 787.
[6] B. Cormary, S. Ladeira, K. Jacob, P. G. Lacroix, T. Voike, D. Schaniel, I. Mal-fant, Inorg. Chem. 2012, 51, 7492 –7501.
[7] A. G. De Candia, J. P. Marcolongo, R. Etchenique, L. D. Slep, Inorg. Chem. 2010, 49, 6925 –6930.
[8] J. Sanz Garc&a, F. Alary, M. Boggio-Pasqua, I. M. Dixon, I. Malfant, J.-L. Heully, Inorg. Chem. 2015, 54, 8310 – 8318.
[9] J. Sanz Garc&a, F. Alary, M. Boggio-Pasqua, I. M. Dixon, J.-L. Heully, J. Mol. Model. 2016, 22, 284.
[10] J. Sanz Garcia, F. Talotta, F. Alary, I. M. Dixon, J.-L. Heully, M. Boggio-Pasqua, Molecules 2017, 22, 1667.
[11] F. Talotta, J.-L. Heully, F. Alary, I. M. Dixon, L. Gonzalez, M. Boggio-Pasqua, J. Chem. Theory Comput. 2017, 13, 6120 –6130.
[12] J. C. Tully, J. Chem. Phys. 1990, 93, 1061 –1071.
[13] L. Khadeeva, V. Kaszub, M. Lorenc, I. Malfant, M. Buron-Le Cointe, Inorg. Chem. 2016, 55, 4117– 4123.
[14] T. J. Penfold, E. Gindensperger, C. Daniel, C. M. Marian, Chem. Rev. 2018, 118, 6975 –7025.
[15] M. Barbatti, Interdiseip. Rev. Comput. Mol. Sei. 2011, 1, 620– 633. [16] S. Mai, P. Marquetand, L. Gonz#lez, WIREs Comput. Mol. Sci. 2018, 8,
e1370.
[17] M. Richter, P. Marquetand, J. Gonz#lez-V#zquez, I. Sol#, L. Gonz#lez, J. Chem. Theory Comput. 2011, 7, 1253 –1258.
[18] S. Mai, P. Marquetand, L. Gonz#lez, Int. J. Quantum Chem. 2015, 115, 1215 –1231.
[19] A. J. Atkins, L. Gonz#lez, J. Phys. Chem. Lett. 2017, 8, 3840 –3845. [20] G. te Velde, F. M. Bickelhaupt, E. J. Baerends, C. Fonseca Guerra, S. J. A.
van Gisbergen, J. G. Snijders, T. Ziegler, J. Comput. Chem. 2001, 22, 931 – 967.
[21] F. Plasser, M. Ruckenbauer, S. Mai, M. Oppel, P. Marquetand, L. Gonzalez, J. Chem. Theory Comput. 2016, 12, 1207 –1219.
[22] A. D. Becke, Phys. Rev. A 1988, 38, 3098 –3100. [23] J. P. Perdew, Phys. Rev. B 1986, 33, 8822 –8824.
[24] S. Hirata, M. Head-Gordon, Chem. Phys. Lett. 1999, 314, 291– 299. [25] A. J. Atkins, F. Talotta, L. Freitag, M. Boggio-Pasqua, L. Gonz#lez, J. Chem.
Theory Comput. 2017, 13, 4123– 4145.
[26] B. J. Coe, T. J. Meyer, P. S. Vhite, Inorg. Chem. 1995, 34, 593–602. [27] D. Jacquemin, E. A. PerpHte, I. Ciofini, C. Adamo, J. Chem. Theory
Comput. 2010, 6, 1532 –1537.
[28] L. Freitag, L. Gonz#lez, Inorg. Chem. 2014, 53, 6415 –6426.
[29] M. Barbatti, G. Granucci, M. Persico, M. Ruckenbauer, M. Vazdar, M. Eckert-Maksic, H. Lischka, J. Photochem. Photobiol. A 2007, 190, 228 – 240.
[30] S. Nangia, A. V. Jasper, T. F. Miller, D. G. Truhlar, J. Chem. Phys. 2004, 120, 3586 –3597.
[31] C. Bressler, C. Milne, V.-T. Pham, A. El Nahhas, R. M. van der Veen, V. Ga-welda, S. Johnson, P. Beaud, D. Grolimund, M. Kaiser, C. N. Borca, G. Ingold, R. Abela, M. Chergui, Science 2009, 323, 489– 492.
[32] A. Cannizzo, C. J. Milne, C. Consani, V. Gawelda, C. Bressler, F. van Mour-ik, M. Chergui, Coord. Chem. Rev. 2010, 254, 2677 –2686.
[33] O. Br-m, F. Messina, E. Baranoff, A. Cannizzo, M. K. Nazeeruddin, M. Chergui, J. Phys. Chem. C 2013, 117, 15958 –15966.
[34] M. A. El Sayed, J. Chem. Phys. 1963, 38, 2834– 2838.
[35] S. Mai, F. Plasser, J. Dorn, M. Fumanal, C. Daniel, L. Gonz#lez, Coord. Chem. Rev. 2018, 361, 74– 97.
[36] M. Radjn, E. Broclawik, K. Pierloot, J. Phys. Chem. B 2010, 114, 1518 – 1528.
[37] T. S. Kurtikyan, V. A. Hayrapetyan, G. G. Martirosyan, R. K. Ghazaryan, A. V. Iretskii, H. Zhao, K. Pierloot, P. C. Ford, Chem. Commun. 2012, 48, 12088 –12090.
Manuscript received: January 30, 2020 Revised manuscript received: March 16, 2020 Accepted manuscript online: April 12, 2020 Version of record online: August 4, 2020