HAL Id: hal-02992347
https://hal.archives-ouvertes.fr/hal-02992347
Submitted on 6 Nov 2020
HAL is a multi-disciplinary open access
archive for the deposit and dissemination of
sci-entific research documents, whether they are
pub-lished or not. The documents may come from
teaching and research institutions in France or
abroad, or from public or private research centers.
L’archive ouverte pluridisciplinaire HAL, est
destinée au dépôt et à la diffusion de documents
scientifiques de niveau recherche, publiés ou non,
émanant des établissements d’enseignement et de
recherche français ou étrangers, des laboratoires
publics ou privés.
Estimating How Variations in Precipitation and
Snowmelt Affect Kunhar River Resources
Mohammad Asim, Isabelle Charpentier
To cite this version:
Mohammad Asim, Isabelle Charpentier. Estimating How Variations in Precipitation and Snowmelt
Affect Kunhar River Resources. Proceedings of the 2nd conference of the arabian journal of geosciences
(CAGJ), 2-5 november 2020, Sousse, Tunisia, Springer, In press. �hal-02992347�
Estimating How Variations in Precipitation and
1
Snowmelt Affect Kunhar River Resources
2
Mohammad Irfan Asim1, Isabelle Charpentier1
3
1 ICUBE (UMR 7357), CNRS & Unistra, F-67000 Strasbourg, FRANCE
4
5
6
Abstract. Over half of the nonpolar glacial watersheds are found in the
Himala-7
yas and they are sources of water for billions of people. Understanding how
var-8
iations in precipitation and snowmelt will affect their lives is thus of prime
inter-9
est. As very scarce data are available, modeling should be adapted. The proposed
10
hydrological framework is based on the distributed conceptual model HBV set
11
up to account for snowmelt in the Greater Hymalayas. Spatialization is carried
12
out with respect to terrain constraints (hydrology, land cover, elevation). Applied
13
to the Kunhar’s watershed, this reveals the key role of correlated temperature and
14
elevation variables.
15
Keywords: Hydrology, Alpine Watershed, Data Scarcity, Conceptual
Model-16
ing, GIS modeling.
17
1 Introduction
18
Over half of the nonpolar glacial watersheds are found in the Himalayas and they 19
are sources of water for billions of people. Understanding how variations in precipita-20
tion and snowmelt will affect their lives is thus of prime interest. As very scarce data 21
are available, modeling should be adapted according to the numerous sources of uncer-22
tainty. The watershed of Kunhar River lying in Pakistan’s Himalayas is considered as 23
a case study. 24
2 Method
25
The proposed hydrological framework is based on the conceptual hydrological model 26
HBV [1] set up to account for snowmelt. Spatialization is carried out thanks to the 27
TopoToolbox [2] applied to digital elevation models and the WatPart software [3] for 28
the partition of watersheds with respect to terrain constraints. Uncertainty computations 29
will be discussed in a further paper. 30
Model calibration is an issue when very few data are available. Data gaps and lacks 31
should be valuated prior to and during the simulations to ensure their adequacy with the 32
foreseen hydrological modeling. 33
2
Free digital elevation models (DEMs) and land cover rasters are distributed with a 34
resolution at equator of 1 arc-second and of 1 km², respectively. Meteorological and 35
gauging stations are often scarcely distributed. Although regional re-analyses may be 36
available, a resolution of 25 km as for Aphrodite data may limit the number of points. 37
Filling data gaps in spatial or temporal dimensions is thus welcome. Thiessen polygons 38
may be used to interpolate precipitations while an affine dependence between height 39
and temperature can be considered. Gaps can also be modulated by adding knowledge 40
and assumptions. Firstly, we delineate the watershed into small hydrological units to 41
agree with land cover resolution and height variations. The DEM is downscaled by 42
averaging height over the sub-basins delineated using Topotoolbox and WatPart. Ap-43
proximated temperatures and precipitations can then be assigned to the sub-basins. Sec-44
ondly, the conceptual model is used on clusters of subdomains [4]. Finally, scarce gaug-45
ing data are used to tune hydrological parameters. 46
3 Results
47
Located in the north of Pakistan, the Kunhar River (2631 km²) drains the southern slope 48
of the Greater Himalayas. This tributary of Jhelum River passes through Naran (Na, 49
2409 m.a.s.l.), Balakot (Bk, 980 m.a.s.l) and Garhi Habibullah (GH, 820 m.a.s.l.). It 50
contributes to about 11% of the Mangla Reservoir. 51
Raster data are the 1 arc-second DEM from USGS and the Global Land Cover 2000 52
raster from EU Science HUB with a resolution of 1 km. On-site data involve 2 meteor-53
ological (Na&Bk) and 2 gauging (Na&GH) stations only. More detail about other avail-54
able data is provided in [5]. 55 56 57 58 59 60 61 62 63 64 65 66 67 68 69 70
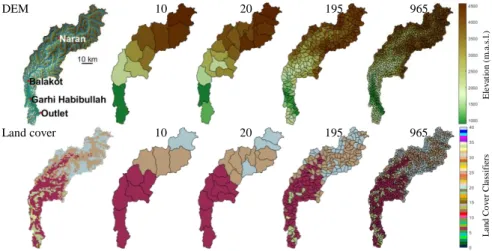
Fig. 1. Downscaling elevation and land cover on nested partitions of the watershed.
71 72
The first partition is carried out with respect to the observation stations and the conflu-73
ence with Jhelum River using the TopoToolbox on the DEM. In Fig. 1, nested partitions 74
are then computed using WatPart. Mean elevation and dominant land cover are 75 DEM 10 20 195 965 Land cover 10 20 195 965 E le v at io n ( m .a .s .l .) L a n d C o v er C la ss if ie rs
assigned to the subdomains. Downstream lower fields are covered by herbaceous veg-76
etation (6:burgundy) and slope agriculture (34:green), while higher areas are covered 77
by snow (40:grey). The central medium height area is dominated by shrubs (25:brown). 78
There is clearly a correlation between height and land cover in Kuhnar’s watershed. 79
Higher the number of subdomains, better the approximation of elevation. Temperature 80
fields are deduced from height information by using Naran’s data. 81
As the 60% of the watershed are higher than 3000 m, the streamflow is mainly driven 82
by temperature and snowmelt. In this study, we thus assume that precipitations are ho-83
mogeneous over the watershed. Soil properties implementing the 4 main land cover 84
classes will be considered in a future work. 85
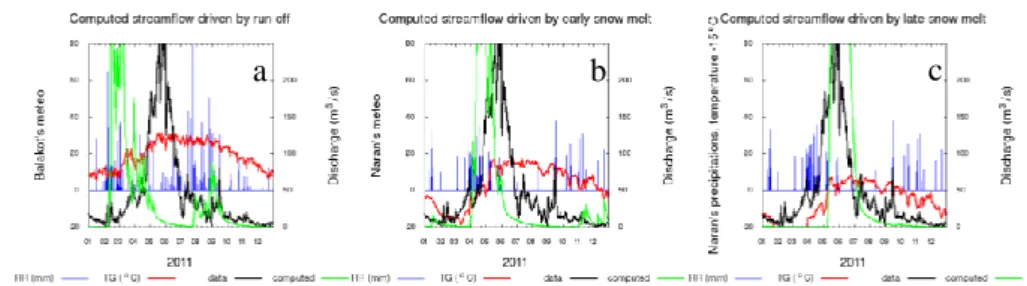
The HBV model is run on the watershed (2429 km²) delineated by the GH gauging 86
station to evaluate the influence of temperature on the streamflow. The mean height is 87
3240 m.a.s.l.. Meteorological and discharge data are plotted in Fig. 2. The simulations 88
are carried out from 2007 to 2011. After a 1-year warm up, the identification runs from 89
2008 to 2010. The 2011 data are used for validation. 90
Fig. 2. Influence of temperature on computed discharges using meteorological data from
Bala-91
kot (a), Naran (b), and the temperature from Naran -15 °C (c).
92 93
As expected, the temperature is a major driver of streamflow. In Fig. 2.a, the computed 94
discharge is driven by rainfall. In Fig. 2.b and 2.c, snow melt occurs too early and too 95
late, respectively. Moreover the discharge peak is too narrow. There is a need for a 96
watershed decomposition that accounts for “snow-melt” at high altitudes and “rainfall-97
runoff” at low ones. This may be carried out by considering several sub-domains. 98
Fig. 3. Accounting for height and temperature variations: Nested partitions (a), streamflow (b).
99 100
a
b
c
b
a
4
We delineate a set of nested partitions. Mean isohypses and areas are reported in Fig. 101
3.a. The temperature field is adapted according to the partition into 8 sub-basins (about 102
300 km² each). The computed streamflow (Fig. 3.c) better agrees with discharge data, 103
even if it could be still improved using Balakot rainfall at low altitudes. 104
4 Discussion
105
The different flow regimes occurring in Kunhar’s watershed can be reproduced by im-106
plementing the HBV model on several sub-basins, the areas and mean heights of which 107
are key parameters. These can be inferred by splitting the watershed into small hydro-108
logical units. The framework will be tested on larger partitions, possibly up to 2500 109
sub-basins to agree with the resolution of GLC 2000 (Fig .1). In addition, the stream-110
flows computed along the corresponding routing network could then be compared to 111
the streamflows computed using HEC-RAS 1D, for instance. 112
The proposed method is clearly able to evaluate the role of height and temperature 113
on such an alpine watershed. Once validated, climate change scenarios could be used 114
to estimate how variations in precipitation, temperature and snowmelt will affect 115
Kuhnar river resources, and more generally Jhelum river resources. This study will be 116
carried out by accounting various modeling uncertainties. 117
5 Conclusions
118
Computed snowpack and snowmelt are expected to be highly variable over the Jhelum 119
River sub-watersheds. The proposed method enables to deal with height and tempera-120
ture in the HBV framework in a fair manner. Consequently, it will be extended to the 121
Jhelum watershed to cautiously quantify streamflow variations under climate change 122
scenarios through uncertainty computations. 123
References
124
1. Bergstrom, S. (1995): The HBV model. In: Singh, V. P. (Ed.), Computer Models of
Wa-125
tershed Hydrology, pp. 443–476, Water Resources Publications, Highlands Ranch, CO (1995).
126
2. Schwanghart, W., Kuhn, N.J.: TopoToolbox: a set of Matlab functions for topographic
127
analysis. Environmental Modelling&Software 25, 770–781 (2010).
128
3. Hariri, S., Gustedt, J., Weill, S., Charpentier, I.: Pairing GIS and distributed hydrological
129
models using Matlab. In: 2nd Conference of the Arabian Journal of Geosciences, CAJG, Sousse,
130
Tunisia (2019).
131
4. Singh, V., Kumar Goyal, M., Surampalli, R.Y., Munoz-Arriola, F.: Sub catchment
Assess-132
ment of snowpack and snowmelt change by analyzing elevation bands and parameter sensitivity
133
in the high Himalayas. Hydrology and Earth System Science, 2017, 1–31 (2017).
134
5. Mahmood, R., Jia, S., Babel, M.S.: Potential Impacts of Climate Change on Water
Re-135
sources in the Kunhar River Basin, Pakistan. Water 8, 23 (2016).