Introduction
Adsorption of phenol and substituted phenols from aqueous solutions on activated carbons is one of the most studied of all liquid-phase applications of carbon adsor-bents. An up-to-date exhaustive review has recently been published by Radovic et al.1Today, it is known that the adsorption process on carbon materials basically depends on several variables such as the pH of the solution, the electron-donating or electron-withdrawing properties of the phenolic compound, and the surface area of the adsorbent and its surface chemistry, which is determined by the nature of its oxygen surface functionalities and its surface charge. For example, oxidation of the surface decreases the density of π electrons on the carbon surface. This, in turn, reduces the π-π interactions with the phenol ring and the adsorption capacity. It follows that the adsorption process is a complex interplay of electrostatics and dispersive interactions.1
To analyze the adsorption isotherms of phenolic com-pounds obtained at equilibrium, many authors use the Langmuir or Freundlich equations, which contains em-pirical parameters. Therefore, a more systematic approach is needed.
In the present study, we examine the adsorption of phenol and 3-chlorophenol from aqueous solutions, within the framework of Dubinin’s theory,2,3because it can be applied to the adsorption of a number of solutes from aqueous solutions.4The present study also considers the
enthalpy of immersion ∆iH of carbons into aqueous solutions of phenolic compounds. This thermodynamic function is related to Dubinin’s theory and it reflects the transfer of the solute from the solution onto the carbon. It will be shown that adsorption is limited to the coating of the total surface of the carbon, Stot, which consists of the micropore walls, Smi, and the external (nonmicro-porous) surface area, Sext. This is already suggested by the fact that the adsorption isotherm is of type I and the limiting amount is smaller than the amount required to fill the micropore volume, Wo, of the carbons.
Theory
The fundamental expression of Dubinin’s theory is the Dubinin-Astakhov (DA) equation,
where A ) RT ln(ps/p), Nais the amount adsorbed (usually given in mol/g) at relative pressure p/psand temperature T, and Naois the limiting amount filling the micropores. From the limiting amount adsorbed, Nao, it is possible to estimate the volume Wofilled by the adsorbate, by using its molar volume Vm in the condensed state at the corresponding temperature and Wo ) NaoVm. E is the characteristic energy of the system, which depends on the solid and on the adsorbate. Dubinin’s theory requires the temperature invariance of parameter E, at least over a reasonable temperature range, so that eq 1 can be used to predict adsorption equilibriums of vapors, including water.5The effect of the adsorbate itself is expressed by a factor β, called affinity coefficient, the reference being by conventional benzene and therefore β(C6H6) ) 1. Under these circumstances, E ) βEo. For activated carbons, power n varies from approximately 1.5 to 3, and the most frequent * To whom correspondence should be addressed. E-mail:
[email protected]. Fax: +41 32 718 25 11. †University of Neuchaˆtel.
‡Universidad de Jae´n. §Universidad de Granada.
(1) Radovic, L. R.; Moreno-Castilla, C.; Rivera-Utrilla, J. Chem. Phys.
Carbon 2000, 27, 227.
(2) Dubinin, M. M. Carbon 1989, 27, 457.
(3) Stoeckli, F. In Porosity in Carbons; Patrick, J., Ed.; Arnold: London, 1995.
(4) Jaroniec, M.; Derylo, A. J. Colloid Interface Sci. 1981, 84, 191.
(5) Stoeckli, F.; Jakubov, T. S.; Lavanchy, A. J. Chem. Soc., Faraday
Trans. 1994, 90, 783.
Na) Naoexp[-(A/E) n
] (1)
Adsorption
of Phenolic Compounds from Aqueous Solutions, by Activated
Carbons,
Described by the Dubinin-Astakhov Equation
Fritz
Stoeckli,*
,†M.
Victoria Lo´pez-Ramo´n,
‡and
Carlos Moreno-Castilla
§It is shown that the adsorption of phenol and 3-chlorophenol from aqueous solutions, by basic active carbons and at an equilibrium solution pH below that of dissociation of the phenols, can be described by an equation of the DRK type with exponent n ) 4. The principle of temperature invariance is fulfilled between 283 and 313 K, which means that predictions can be made on the basis of a characteristic energy, Es, and of affinity coefficients, βs, relative to phenol. This approach presents an advantage over the traditional Langmuir isotherm. Moreover, the comparison of the limiting amounts adsorbed by the different carbons suggests that phenol and 3-chlorophenol are adsorbed in a monolayer as observed for carbon blacks, except in the case of activated carbons with a low degree of activation in which molecular-sieve effects can take place. Similar
conclusions are obtained from the enthalpies of immersion into the aqueous solutions and their comparison with graphitized carbon blacks.
Chemistry Department, University of Neuchaˆ tel, Av. de Bellevaux 51, CH-2000 Neuchaˆ tel, Switzerland
Departamento de Quı´mica Inorga´ nica y Orga´ nica, Facultad de Ciencias Experimentales, Universidad de Jae´n, 23071 Jae´n, Spain
Departamento de Quı´mica Inorga´ nica, Facultad de Ciencias, Universidad de Granada, 18071 Granada, Spain
case, where n ) 2, corresponds to the Dubinin-Radush-kevich (DR) equation. On the basis of different experi-mental techniques, it has been shown3that the charac-teristic energy Eois related to the average width of the micropores by
Consequently, assuming slit-shaped micropores, the sur-face of their walls is approximately equal to
Dubinin’s theory can be extended to the adsorption of vapors on certain nonporous surfaces such as graphitized carbons blacks6 and manganese dioxide7 and the DR equation takes the form of the so-called Dubinin-Radushkevich-Kaganer (DRK) equation:8,9
The limiting amount Nam(DRK) represents the monolayer capacity of the surface. It is close to Nam(BET), the BET monolayer capacity obtained from the same isotherm at higher relative pressures (0.05 < p/ps< 0.30-0.35).
It has been shown4that the preferential adsorption of various compounds from aqueous solutions, by activated carbons, follows an equation of the DRK type. With the present formalism, one obtains
In this expression, the vapor-solid adsorption potential A ) RT ln(ps/p) is replaced by a new thermodynamic potential, RT ln(c*/ceq), where c* is the saturation con-centration of the adsorbed species and ceqis the concen-tration at equilibrium, to which corresponds the amount adsorbed Na. Equation 5 is similar to eq 4, but because adsorption takes place from an aqueous solution, there is no reason Esshould be related directly to the characteristic energy Eo of eq 1. On the other hand, Es must be temperature-invariant, but this has not been examined systematically. At the present time, and in view of the fact that the adsorption isotherms of phenol and related compounds show a plateau, the majority of authors use Langmuir’s equation adapted to solution work:
In this expression, B is a parameter that depends on the temperature and on the system and ceqis the equilibrium concentration in the solution. Other expressions such as the Freundlich equation have also been used, but all these equations suffer from the shortcoming that the variation
of their main parameters with temperature cannot be predicted in a simple fashion, as opposed to Dubinin’s equation. In light of eqs 1 and 4 an obvious generalization of eq 5 would be
where As is the thermodynamic potential, As ) RT ln(c*/ceq), the reference state for the solute being either the saturated solution at temperature T or the pure solute itself (both have the same chemical potential). Equation 7 does not imply a specific model for adsorption from the solution.
In the case of preferential adsorption, the enthalpy of immersion of the solid into the solution reflects the transfer of the solute from the solution onto the solid. The energy balance involves demixing and the interaction between the solute and the surface, as discussed below (section 4).
Experimental Section
Solids. The study is based on well-characterized active
carbons, PLW5and AP-2.5, AP-5, AP-10, CP-5, and CP-10.10Their main characteristics, Eo, Wo, Smi, and Sext, obtained from CO2 adsorption isotherms, are given in Table 1, together with their pHPZC. Data obtained by Leyva-Ramos et al.11with the activated carbon Filtrasorb 400 were also included. Graphitized carbon blacks N234-G, Hoechst,6and Vulcan 3-G, with BET surface areas of 92, 54, and 71 m2/g were also considered for comparison in immersion calorimetry.
Adsorption from Solutions. In the present study, we
determined the adsorption of phenol at 298 and 313 K and of 3-chlorophenol at 298 K on active carbon PLW. The technique was identical to that used earlier for carbons of series AP and CP at 298 K.10 Basically, the adsorption isotherms were determined by using flasks containing 0.1 g of carbon/100 cm3 of phenolic solution of different initial concentrations. These solutions were kept in a thermostated shaker bath at 298 or 313 K for 15 days, a time sufficiently long to ensure adsorption equilibrium. The adsorption isotherms were determined without adding any buffer to control the pH, to avoid the introduction of any new electrolyte into the system. But in all cases the suspensions at equilibrium had a pH between 6 and 7, which is below the pHPZCof the carbons.
Immersion Calorimetry. The enthalpies of immersion of
active carbon PLW and of the nonporous carbon blacks (es-sentially N234-G) into the aqueous solutions of phenolic com-pounds (phenol and 3-chlorophenol) were determined at 293 K with a calorimeter of the Tian-Calvet type, as described in detail elsewhere.12,13
In the case of activated carbon PLW, samples of 0.040 to 0.150 g were used. They were previously outgassed at a dynamic vacuum of 10-5Torr and at a temperature not higher than 383 K. The enthalpies of immersion were determined by using 0.4 M solutions for phenol and 0.2 M for 3-chlorophenol. In the case of carbon black NG234-G, the concentrations were mainly around
(6) Hugi-Cleary, D.; Stoeckli, F. Carbon 2000, 38, 1309.
(7) Stoeckli, F.; Hugi-Cleary, D.; Centeno, T. A. J. Eur. Ceram. Soc.
1998, 18, 1177.
(8) Kaganer, M. G. Dokl. Akad. Nauk SSSR 1952, 116, 603. (9) Rudzinski, W.; Everett, D. H. In Adsorption of Gases on
Heterogeneous Surfaces; Academic Press: London, 1992.
(10) Moreno-Castilla, C.; Rivera-Utrilla, J.; Lo´pez-Ramo´n, M. V.; Carrasco-Marı´n, F. Carbon 1995, 33, 845.
(11) Leyva-Ramos, R.; Soto-Zun˜ iga, J. H.; Mendoza-Barro´n, J.; Guerrero-Coronado, R. M. Adsorp. Sci. Technol. 1999, 17, 533.
(12) Bansal, R. C.; Donnet, J. B.; Stoeckli, H. F. Active Carbon; Dekker: New York, 1988.
(13) Carrasco-Marı´n, F.; Mueden, A.; Centeno, T. A.; Stoeckli, F.; Moreno-Castilla, C. J. Chem. Soc., Faraday Trans. 1997, 93, 2211.
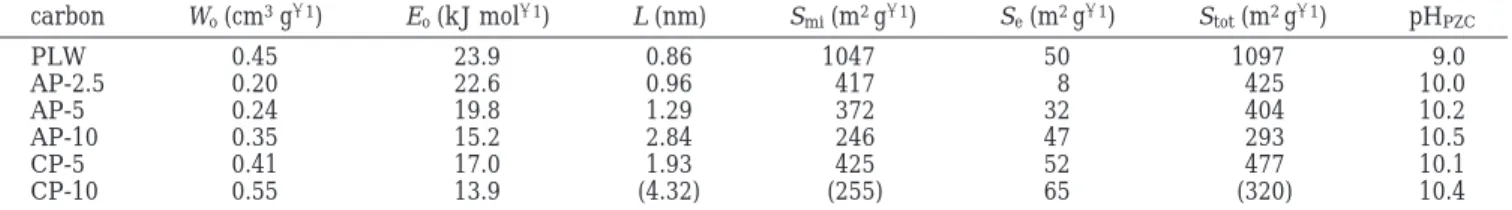
Table 1. Structural Characteristics of the Activated Carbons Derived from Equations 2 and 3 and Surface Basicity
carbon Wo(cm3g-1) Eo(kJ mol-1) L (nm) Smi(m2g-1) Se(m2g-1) Stot(m2g-1) pHPZC
PLW 0.45 23.9 0.86 1047 50 1097 9.0 AP-2.5 0.20 22.6 0.96 417 8 425 10.0 AP-5 0.24 19.8 1.29 372 32 404 10.2 AP-10 0.35 15.2 2.84 246 47 293 10.5 CP-5 0.41 17.0 1.93 425 52 477 10.1 CP-10 0.55 13.9 (4.32) (255) 65 (320) 10.4 L(nm) ) 10.8/(Eo- 11.4 kJ/mol) (2) Smi(m 2 /g) ) 2000Wo(cm 3 /g)/L(nm) (3) Na) Nam(DRK) exp[-(A/E) 2 ] (4) Na) Namexp{-[RT ln(c*/ceq)/Es] 2} (5) Na) NamBceq/(1 + Bceq) (6) Na) Namexp[-(As/Es)n] (7)
0.04 M. Experiments were also performed with carbon blacks Hoechst and Vulcan 3-G to test for self-consistency.
Results and Discussion
First, it has been known for a long time,14and confirmed by many authors,1that in the case of phenol adsorption from aqueous solutions there is a decrease in the surface coverage of the activated carbons when their surface acidity increases. For this reason we have chosen activated carbons with basic surface properties, as shown by their pHPZC. Second, the solution pH at equilibrium was between 6 and 7 in the case of adsorption on activated carbons PLW and those of the series AP and CP, which was below the pHPZC of the carbons. Under these conditions the phenols used will be undissociated,10and it is expected that the interactions between the phenols and the surface of the carbons will be of a dispersive nature only.
The data for the adsorption of the phenolic compounds by the various carbons is given in Table 2. As a matter of interest, we also included the data of Leyva-Ramos et al.11for the adsorption of phenol from aqueous solutions at 283, 298, and 313 K by Filtrasorb 400.
The equilibrium isotherms of phenol (298 and 313 K) and 3-chlorophenol (298 K) adsorbed from aqueous solu-tions by active carbon PLW are shown in Figure 1.
The data have been analyzed in terms of the extended DRK equation (7), with a variable exponent n. As shown for example in Figures 2 and 3, one obtains very good overall fits for the plots of ln(Na/Nam) versus [RT ln(c*/ceq)].4(The values of Namare obtained from the plots for the experimental data.) The power n ) 4 may be surprising at first, but it appears that this value extends the fit of the experimental over a wider range of relative
(14) Coughlin, R. W.; Ezra, F. S. Environ. Sci. Technol. 1968, 2, 291.
Table 2. Adsorption of Phenol and 3-Chlorophenol from Aqueous Solutions by the Activated Carbons
eq 7 carbon compound T (K) Es (kJ mol-1) βs Nam× 10-3 (mol g-1) Sm(DRK) (m2g-1) PLW phenol 298 19.1 1.00 3.75 1016 phenol 313 19.1 1.00 3.62 981 3-chlorophenol 298 18.9 0.99 3.50 1050 Filtrasorb 400 phenol 283 21.1 1.00 1.98 537 phenol 298 21.1 1.00 2.00 542 phenol 313 21.1 1.00 2.00 542 AP-2.5 phenol 298 23.6 1.00 1.28 347 3-chlorophenol 298 26.6 1.13 0.57 171 AP-5 phenol 298 27.5 1.00 1.67 453 3-chlorophenol 298 27.5 1.00 1.51 453 AP-10 phenol 298 29.9 1.00 1.80 488 3-chlorophenol 298 31.1 1.04 1.68 504 CP-5 phenol 298 27.4 1.00 2.20 596 3-chlorophenol 298 29.1 1.06 1.74 522 CP-10 phenol 298 30.5 1.00 2.55 691 3-chlorophenol 298 28.7 0.94 2.20 660
Figure 1. Adsorption isotherms of phenol at 298 K (]) and at
313 K (*), and 3-chlorophenol (4) at 298 K, from aqueous solutions onto carbon PLW.
Figure 2. (a) Generalized DRK plots for the adsorption of
phenol at 298 K (]) and 313 K (*), and 3-chlorophenol (4) at 298 K, from aqueous solutions onto carbon PLW. (b) Generalized DRK for the data of Leyva-Ramos et al. for phenol at 283 (9), 298 K (b), and 313 K (2) on a typical activated carbon.
Figure 3. Generalized DRK plots for the data of
Moreno-Castilla et al. for the adsorption of phenol (]) and 3-chlorophenol (4) at 298 K from aqueous solutions onto carbons CP-5 (a) and closed symbols for CP-10 (b).
concentrations ceq/c* than n ) 2. For example, in the case of phenol on carbon PLW at 298 K (Figure 1), the domain corresponds to 0.0004 < ceq/c* < 1, whereas the use of n ) 2 limits the linear section to ceq/c* > 0.001.
The data for phenol adsorbed on PLW at 298 and 313 K and on the carbon of Leyva-Ramos et al. 293, 298, and 313 K shows that the requirement for temperature invariance is fulfilled near room temperature. This suggests that eq 7 can be used to predict the adsorption of phenol with a constant value of Es, given in Table 2. For 3-chlorophenol one obtains slightly different values for Es, but a finer analysis shows that they can be correlated with Es(phenol) by introducing a shifting factor, βs, similar to the affinity coefficient β used in eq 1. In this case, if phenol is taken as the reference,
βsfor 3-chlorophenol, derived for the different carbons and given in Table 2, takes an average value of 1.03 ( 0.10.
As shown in Tables 1 and 2, it appears that the characteristic energies Esand Eovary in opposite direc-tions. This is surprising, but it should be kept in mind that these parameters reflect two different mechanisms: Eocorresponds, by definition, to the adsorption of benzene vapor filling the micropore volume Wo. Es, on the other hand, is associated with the transfer of phenol from aqueous solutions onto the surface of the carbon (see below). Moreover, the chemistry of the surface also plays a role in the adsorption of phenol.1However, no definite explanation can be offered at this stage and the correlation between Esand other parameters needs further investi-gation.
At this stage, it appears that the adsorption of phenol and 3-chlorophenol from aqueous solutions can be fitted to the extended DRK equation (7) in which parameter Es depends on the energy of interaction between the phenol and the given carbon. It is also related to the heat of immersion of the carbon into the phenol solution and to the affinity coefficient βs. This is a clear advantage over both the Langmuir equation and the Freundlich equation, whose parameters have no simple physical meaning.
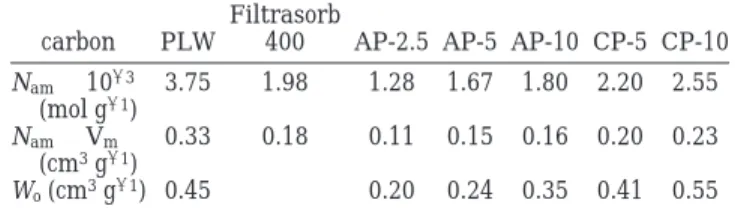
More information is also provided by the limiting amounts of phenol and 3-chlorophenol adsorbed by the different activated carbons. As illustrated by Figure 1, and confirmed by the fits to the DRK or the Langmuir10 equations, adsorption from solution is limited and Nam could correspond to a monolayer. The data of Table 2 also suggests that the limiting amounts Namof phenol adsorbed by the solids correspond to smaller equivalent volumes than required to fill the micropores: Using the molar volume of 89 cm3of solid phenol at 293 K, one obtains the equivalent volumes Nam× Vmgiven in Table 3, which are always smaller than Wo. For carbons PLW and CP-10, two limiting cases, one obtains 0.33 and 0.23 cm3/g as opposed to micropore volumes Woof 0.45 and 0.55 cm3/g. Moreover, these calculations do not take into account the
(15) Teng, H.; Hsieh, C. T. Ind. Eng. Chem. Res. 1998, 37, 3618. (16) Boehm, H. P.; Gromes, W. Angew. Chem. 1959, 71, 65. (17) Coughlin, R. W.; Ezra, F. S.; Tan, R. N. J. Colloid Interface Sci.
1968, 28, 386.
(18) Singh, D. D. Ind. J. Chem. 1971, 9, 1369.
(19) Lyklema, J. Fundamentals of Interface and Colloid Science.
Volume II. Solid-Liquid Interfaces; Academic Press: London, 1995.
(20) PC Model Molecular Modeling Sofware for PC. Version 3, Serena Sofware, 1989.
(21) Caturla, F.; Martin-Martinez, J. M.; Molina-Sabio, M.; Rodriguez-Reinoso, F.; Torregrosa, R. J. Colloid Interface Sci. 1988, 124, 528.
Table 3. Limiting Volumes of Phenol Adsorbed by the Activated Carbons at 293 K (Vm) 89 cm3mol-1)
carbon PLW
Filtrasorb
400 AP-2.5 AP-5 AP-10 CP-5 CP-10
Nam× 10-3 (mol g-1) 3.75 1.98 1.28 1.67 1.80 2.20 2.55 Nam× Vm (cm3g-1) 0.33 0.18 0.11 0.15 0.16 0.20 0.23 Wo(cm3g-1) 0.45 0.20 0.24 0.35 0.41 0.55 βs) Es/Es(phenol) (8)
adsorption of phenol on the external surface Se, ap-proximately (3.2 × 10⁻⁶mol/m2) × (50 m2/g) ) 0.16 × 10⁻³ mol/g or an equivalent volume of 0.01 cm3/g. One may therefore postulate that the adsorption of phenol and 3-chlorophenol by activated carbons, and under the experimental conditions specified above, could follow a similar pattern, with the coating of the micropore walls and of the external surface by a monolayer, rather than the filling of the micropores.
However, a controversy has been going on for some time about the use of phenol adsorption from aqueous solutions to determine the surface area of carbonaceous materials.1 This is due to the fact that this process may also depend, to some extent, on the surface chemistry of the carbon and on the pH of the solution. Furthermore, there are also some discrepancies about the value of the cross-sectional area of the phenol molecule when it is adsorbed in a flat position. Thus, Teng et al.15 used a value of 30.2 × 10⁻²⁰m2, Boehm et al.1640 × 10-20m2, Coughlin et al.17 41.2 × 10⁻²⁰ m2, and Singh18 52.2 × 10⁻²⁰ m2. Recently, Lyklema19used a cross-sectional area of 45 × 10-20 m2, and with this value, he found an area of 380 m2 for a carbon with a BET (N2) area of about 1000 m2, indicating that this is still so high as to suggest contribu-tions from pores.
In the present study we used the value of 45 × 10-20m2 for the molecular area of phenol and 49.8 × 10⁻²⁰m2for 3-chlorophenol, adjusted by MMX force-field calculations.20 Using these values, we come to the conclusion that under the present conditions the adsorption of phenol and of 3-chlorophenol is limited to the coating of the total surface of the carbon, Stot. This surface consists of the micropore walls, Smi, and the external (nonmicroporous) surface area, Sext. Evidence for this mechanism is provided by two different approaches discussed below and based on the adsorption capacities and on immersion calorimetry.
The first approach is based on the comparison of the monolayer capacities Namwith the total surface area Stot of the carbons, known from other techniques. Thus, taking into account the cross-sectional area of the phenols, the limiting adsorption capacities Namobtained from the DRK plots and given in Table 2 lead to the equivalent total surfaces areas Sm(DRK) given in the same table. It appears that, for each carbon, the values obtained with both phenolic compounds are in good agreement, except for sample AP-2.5 in which the differences found in Sm(DRK) obtained with phenol and 3-chlorophenol can be due to the low degree of activation of this sample.10It has been shown21for this type of carbon molecular sieve effect can be present, which reduces the accessibility of the micropore system for the substituted phenols. As shown in Table 4, for activated carbons PLW, AP-2.5, AP-5, and CP-5 the average values of Sm(DRK) are in good agreement with the values of Stot) Smi+ Se, given in Table 1 and derived from the structural parameters Eo, Wo, using eqs 2 and 3. The systematically lower values of Stot predicted for carbons AP-10 and CP-10 may reflect a limitation of eq 2 in the case of carbons with large micropore width. Under
these circumstances, a better approximation can be obtained for the average width L of ideally slit-shaped pores by using the quantity Smi) Sm(DRK) - Seand the micropore volume Woof the carbon. As seen in Table 4, in the case of carbons AP-10 and CP-10, the values of L based on this approach show some differences with the predictions of eq 2. However, as pointed out earlier,3this equation becomes less accurate for L > 1.7-2.0 nm (Eo< 16-17 kJ/mol), probably due to the fact that the micropores are no longer slit-shaped. This problem will be dealt with separately, in a new assessment of eq 2.
The second approach to the adsorption of phenolic compounds from aqueous solutions by activated carbons is based on the comparison of the enthalpies of immersion of the activated carbon and of a nonporous carbon black (N234-G) into the aqueous solutions. This technique has already been applied successfully to the case of caf-feine,3,22,23 a molecule with limited solubility in water, showing a strong affinity for carbon and adsorbed as a monolayer. In the present case, the reference is carbon black N234-G with a BET surface area of 92 m2/g, but some experiments were carried out with carbons blacks Hoechst (54 m2/g) and Vulcan 3-G (71 m2/g) to cross check the technique.
As illustrated by Figure 4, the enthalpies of immersion of carbon N234-G into solutions of phenol and 3-chlo-rophenol at 293 K are linear functions of the amount of carbon. (This behavior is valid up to a point where a break is observed, which corresponds to the depletion of the solution.) For both phenolic compounds adsorbed by N234-G, the gradients correspond to specific enthalpies hi of -0.109 ( 0.003 J/m2(phenol) and -0.107 ( 0.002 J/m2 (3-chlorophenol). In the case of carbon blacks Hoechst and Vulcan 3-G, one obtains specific enthalpies of -0.103 and -0.124 J/m2for phenol, with similar uncertainties.
The enthalpies of immersion of carbon PLW into solutions of phenol and 3-chlorophenol follow a similar pattern (see Figure 5), with specific enthalpies of respec-tively -113.0 ( 1.0 and -112.0 ( 1.4 J/g of carbon. As shown in Table 5, using the specific enthalpies obtained with carbon N234-G and on the basis of a BET surface area of 92 m2/g, one obtains equivalent surface areas S
m of 1037 ( 9 and 1047 ( 13 m2/g for carbon PLW. These values are in good agreement with the surface areas Sm(DRK) obtained from the liquid adsorption isotherms (Tables 2 and 4).
It is also interesting to point out that, in the case of carbon black N234-G, the surface density of phenol of 3.18× 10⁻⁶mol/m2and the specific enthalpy of immersion of -0.109 J/g lead to a molar enthalpy of -0.109/3.18× 10-6) -34.3 kJ/mol for the transfer of phenol from the solution onto the carbon surface. For carbon PLW, the ratio ∆iH/Nam) -(113 J/g)/(3.75 × 10-3mol/g) ) -30.1 kJ/mol. For another typical activated carbon, not used in the present study, one obtains a ratio ∆iH/Namof -30.0 kJ/mol. These values are very close and suggest a similar process for the adsorption on porous and nonporous carbons, leading to a single layer of phenol on the micropore walls and on the open surface. In this respect, the behavior of phenol is similar to that of caffeine, reported earlier.3,22,23 Moreover, these enthalpies are in good agreement with the energy of -25 kJ/mol obtained by Salvador and Mercha´n24for the adsorption of phenol from an aqueous solution, by a typical active carbon, on the basis of a new type of kinetic experiments (thermally programmed adsorption and desorption).
(22) Stoeckli, F.; Frangie`re, M.; Huguenin, D.; Depraz, M.; Ballerini, L. Carbon 1989, 26, 915.
(23) Ballerini, L.; Huguenin, D.; Rebstein, P.; Stoeckli, F. J. Chim.
Phys. 1990, 87, 1709. (24) Salvador, F.; Mercha´n, M. D. Carbon 1996, 34, 1543.
Table 4. Structural Parameters of the Carbons Based on Adsorption of Phenol and 3-Chlorophenol from Aqueous Solutions
carbon PLW Filtrasorb 400 AP-2.5 AP-5 AP-10 CP-5 CP-10
Es(kJ mol-1) 19.1 21.1 23.6 27.5 29.9 27.4 30.5
Sm(DRK) (m2g-1) 1016 540 347a 453 496 559 676
Smi) Sm(DRK) - Se(m2g-1) 966 339 421 449 507 611
L ) 2000Wo/Smi(nm) 0.93 1.18 1.14 1.56 1.62 1.80
L from eq 2 (nm) 0.86 0.96 1.29 2.84 1.93 4.32
aSurface area obtained from phenol adsorption.
Figure 4. Enthalpies of immersion of carbon N234-G into
aqueous solutions of phenol (]) and 3-chlorophenol (4) at 293 K.
Figure 5. Enthalpies of immersion of active carbon PLW into
aqueous solutions of phenol (]) and 3-chlorophenol (4) at 293 K.
Table 5. Adsorption and Immersion Calorimetry Results for Carbon PLW phenol temp (K) Nam× 10-3 (mol g-1) S(mm(DRK)2g-1) Sm(m) ∆2gi-1H/h) i phenol 298 3.75 1016 1037 phenol 313 3.62 981 3-chlorophenol 298 3.50 1050 1047
It is also interesting to point out that the adsorption of 3-aminophenol, 4-cresol, and 4-nitrophenol onto carbons AP-2.5, AP-5, AP-10, CP-5, and CP-10, described earlier,10 seems to follow a pattern similar to that of phenol and 3-chlorophenol and one obtains the following affinity coefficients relative to phenol taken as a reference, βs(3-aminophenol) ) 0.84 ( 0.15
βs(4-cresol) ) 0.87 ( 0.04 βs(4-nitrophenol) ) 0.84 ( 0.07 βs(3-chlorophenol) ) 1.03 ( 0.10
This suggests some regularity in the process, but as pointed out elsewhere,1,10the pH of the solution has an influence on the monolayer capacity Nam.
Conclusions
The present study, based on adsorption from aqueous solutions and on immersion calorimetry, shows that phenol
and 3-chlorophenol are adsorbed as monolayers by both porous and nonporous carbons displaying basic surface properties and provided that the pH is below that of dissociation of the compounds. (Obviously, this does not necessarily apply to carbons with low degrees of activation, where molecular-sieve effects often reduce the accessibility of the micropore system.) It also appears that adsorption from aqueous solutions can be described by an extended DRK equation, in the present case with exponent n ) 4, and covering the domain of relative concentrations ceq/c* between 10-4 and 1. The principle of temperature invari-ance being fulfilled over a certain range of temperature, the adsorption equilibrium from solution can be described by eq 7 between 283 and 313 K. In the case of phenol, this approach requires a single adjustable parameter, Es, depending on the activated carbon. However, as pointed out above, the correlation between Esand other parameters needs further investigation.
As suggested by earlier data,10it is likely that under suitable conditions the present approach can be extended to other phenolic compounds.
![Figure 3. Generalized DRK plots for the data of Moreno- Moreno-Castilla et al. for the adsorption of phenol (]) and 3-chlorophenol ( 4 ) at 298 K from aqueous solutions onto carbons CP-5 (a) and closed symbols for CP-10 (b).](https://thumb-eu.123doks.com/thumbv2/123doknet/14934145.665527/3.918.483.834.712.932/figure-generalized-moreno-moreno-castilla-adsorption-chlorophenol-solutions.webp)
![Figure 5. Enthalpies of immersion of active carbon PLW into aqueous solutions of phenol (]) and 3-chlorophenol (4) at 293 K.](https://thumb-eu.123doks.com/thumbv2/123doknet/14934145.665527/5.918.476.835.536.620/figure-enthalpies-immersion-active-carbon-aqueous-solutions-chlorophenol.webp)