HAL Id: tel-01260330
https://tel.archives-ouvertes.fr/tel-01260330
Submitted on 21 Jan 2016HAL is a multi-disciplinary open access archive for the deposit and dissemination of sci-entific research documents, whether they are pub-lished or not. The documents may come from teaching and research institutions in France or abroad, or from public or private research centers.
L’archive ouverte pluridisciplinaire HAL, est destinée au dépôt et à la diffusion de documents scientifiques de niveau recherche, publiés ou non, émanant des établissements d’enseignement et de recherche français ou étrangers, des laboratoires publics ou privés.
heavy machines
Manh-Tuan Bui
To cite this version:
Manh-Tuan Bui. Vision-based multi-sensor people detection system for heavy machines. Other. Université de Technologie de Compiègne, 2014. English. �NNT : 2014COMP2156�. �tel-01260330�
Par Manh-Tuan BUI
Thèse présentée
pour l’obtention du grade
de Docteur de l’UTC
Vision-based multi-sensor people detection system
for heavy machines
Soutenue le 27 novembre 2014
Spécialité : Information Technologies and Systems
Thesis
Submitted in partial fulfillment of the requirements for the degree of
Doctor of Philosophy
Area of specialization: Information Technologies and Systems by
Manh-Tuan BUI
Vision-based Multi-sensor People Detection System
for Heavy Machines
Heudiasyc Laboratory, UMR CNRS 7253
Thesis Committee:
Reviewers: Pascal Vasseur Prof. Lab. LITIS-Université de Rouen Cédric Demonceaux Prof. Lab. Le2i-IUT le Creusot
Examiners: Isabelle Fantoni Dr CNRS Lab. Heudiasyc-UTC Compiègne Sergio Alberto Rodriguez Florez Université Paris-Sud 11, MCF
Supervisors: Vincent Frémont Lab.Heudiasyc-UTC Compiègne, MCF-HDR Djamal Boukerroui Lab.Heudiasyc-UTC Compiègne, MCF-HDR Guest Pierrick Letort CETIM
Acknowledgments
This PhD thesis was carried out at the Heudiasyc Laboratory in the University of Technology of Compiègne from October 2011 to November 2014. This is without doubt the hardest and most tiring project I have been though. I would like to dedicate my gratitude to the people and institutions that have supported me along these years. Foremost, I wish to express my sincere thanks to my supervisors Vincent Frémont and Djamal Boukerroui, for their valuable advices, their continuous encouragements and their personal involvement. They have greatly influenced how I approach the problems though the critics and advises. Throughout our work together, they have kept my passion for research alive, especially during the tough times that we must all inevitably face. In short, I was lucky enough not to have just one great advisers but two.
To the staff at Cetim, especially to Pierrick Letort and Mansour Afzali, all these work could not be completed without all the investment and supports that they have done to this thesis.
I would like to thank the friends in Heudiasyc laboratory: Marek K., Bernard L., Dingfu Z., Aurore , Louis, Laura, Alberto and the ones that for sure I forget. Without them it would have been really hard to complete this journey. Thanks to my gang Tien, Truong, Nha for the absurd jokes, the chats (research/non-research), the good and bad moments.
I would like to thank my family who supported me unconditionally. My parents have always been a great source of motivation for me. Lastly, I would like to thank my beloved Thanh, who has always helped me pursue my dreams and given me confidence. Thank you for always standing by my side in success as well as in failures.
Abstract
This thesis has been carried out in the framework of the cooperation between the Compiègne University of Technology (UTC) and the Technical Centre for Mechani-cal Industries (CETIM). In this work, we present a vision-based multi-sensors people detection system for safety on heavy machines. A perception system composed of a monocular fisheye camera and a Lidar is proposed. The use of fisheye cameras pro-vides an advantage of a wide field-of-view but yields the problem of handling the strong distortions in the detection stage.
To the best of our knowledge, no research works have been dedicated to people detection in fisheye images. For that reason, we focus on investigating and quantifying the strong radial distortions impacts on people appearance and proposing adaptive approaches to handle that specificity. Our propositions are inspired by the two state-of-the-art people detection approaches: the Histogram of Oriented Gradient (HOG) and the Deformable Parts Model (DPM). First, by enriching the training dataset, we prove that the classifier can take into account the distortions. However, fitting the training samples to the model, is not the best solution to handle the deformation of people appearance. We then decided to adapt the DPM approach to handle properly the problem. It turned out that the deformable models can be modified to be even better adapted to the strong distortions of the fisheye images. Still, such approach has a drawback of the high computation cost and complexity.
In this thesis, we also present a framework that allows the fusion of the Lidar modality to enhance the vision-based people detection algorithm. A sequential Lidar-based fusion architecture is used, which addresses directly the problem of reducing the false detections and computation cost in vision-based-only system. A heavy machine dataset have been also built and different experiments have been carried out to evaluate the performances of the system. The results are promising, both in term of processing speed and performances.
Résumé
Ce travail de thèse a été réalisé dans le cadre de la coopération entre l’Université de Technologie de Compiègne (UTC) et le Centre Technique des Industries Mécaniques (CETIM). Nous présentons un système de détection de personnes pour l’aide à la conduite dans les engins de chantier. Une partie du travail a été dédiée à l’analyse du contexte de l’application, ce qui a permis de proposer un système de perception composé d’une caméra monoculaire fisheye et d’un Lidar. L’utilisation des caméras fisheye donne l’avantage d’un champ de vision très large avec en contrepartie, la nécessité de gérer les fortes distorsions dans l’étape de détection.
A notre connaissance, il n’y a pas eu de recherches dédiées au problème de la détection de personnes dans les images fisheye. Pour cette raison, nous nous sommes concentrés sur l’étude et la quantification de l’impact des distorsions radiales sur l’apparence des personnes dans les images et nous avons proposé des approches adaptatives pour gérer ces spécificités. Nos propositions se sont inspirées de deux approches de l’état-de l’art pour la détection des personnes : les histogrammes de gradient orientés (HOG) et le modèle des parties déformables (DPM). Tout d’abord, en enrichissant la base d’apprentissage avec des imagettes fisheye artificielles, nous avons pu montrer que les classificateurs peuvent prendre en compte les distorsions dans la phase d’apprentissage. Cependant, adapter les échantillons d’entrée, n’est pas la solution optimale pour traiter le problème de déformation de l’apparence des personnes dans les images. Nous avons alors décidé d’adapter l’approche de DPM pour prendre explicitement en compte le modèle de distorsions. Il est apparu que les modèles déformables peuvent être modifiés pour s’adapter aux fortes distorsions des images fisheye, mais ceci avec un cout de calculatoire supérieur.
Dans cette thèse, nous présentons également une approche de fusion Lidar/camera fisheye. Une architecture de fusion séquentielle est utilisée et permet de réduire les fausses détections et le coût calculatoire de manière importante. Un jeu de données en environnement de chantier a été construit et différentes expériences ont été réalisées pour évaluer les performances du système. Les résultats sont prometteurs, à la fois en terme de vitesse de traitement et de performance de détection.
Contents
Notations and Symbols v
Abbreviations vii
List of Figures xii
List of Tables xiii
1 Introduction 1
1.1 The Heavy Machine Context . . . 1
1.2 People Detection Systems . . . 3
1.3 Problem Statement . . . 6
1.3.1 The People Detection Systems’ Generic Framework . . . 6
1.3.2 Challenges . . . 8
1.4 Contributions and Organization of the Thesis . . . 10
2 The Proposed Multi-sensors System 13 2.1 The Sensor System . . . 13
2.1.1 Effective Sensor Range . . . 13
2.1.2 Proposed Sensors Combination . . . 15
2.1.3 Sensors Positions on Heavy Machines . . . 20
2.1.4 Sensor Calibration . . . 23
2.2 The Heavy Machine Dataset . . . 25
2.3 The Evaluation Method . . . 30
2.4 Conclusions . . . 33
3 Vision-based People Detection Systems 35 3.1 People Detection using Vision . . . 35
3.1.2 Industrial Solutions . . . 39
3.1.3 Chapter Outline. . . 40
3.2 Image Features Extraction Methods . . . 41
3.2.1 The Histogram of Oriented Gradients Features . . . 41
3.2.2 The Dimensionality Reduced HOG . . . 44
3.2.3 Discussions . . . 45
3.3 Detection Methods . . . 46
3.3.1 The Sliding Window Paradigm . . . 46
3.3.2 The Deformable Parts Model Approach . . . 47
3.3.3 Discussions . . . 50
3.4 Conclusion . . . 50
4 The Adaptive People Detection System for Fisheye Images 51 4.1 Introduction . . . 51
4.2 The Fisheye Image Context . . . 52
4.2.1 The Fisheye Camera Measurement Model . . . 52
4.2.2 People’s Appearance Distortion Analysis . . . 56
4.2.3 Warping Fisheye Images . . . 58
4.3 The Mix-training-dataset Approach . . . 61
4.3.1 Distortions Simulation . . . 62
4.3.2 Proposed People Detection Approach . . . 64
4.3.3 Experiments and Evaluations . . . 66
4.3.4 Discussions . . . 71
4.4 Adaptive-DPM Approach . . . 71
4.4.1 The Adaptive-DPM model . . . 72
4.4.2 Experiments and Evaluations . . . 74
4.4.3 Discussions . . . 77
4.5 Conclusions . . . 78
5 Toward a Multi-sensors People Detection System 81 5.1 Introduction . . . 81
5.1.1 Related Works . . . 82
5.1.2 Problem Statements . . . 83
5.2 The Multi-sensors People Detection System . . . 84
5.2.2 Adaptive ROIs Projection on the Image Frame. . . 88
5.3 Experiments and Evaluations . . . 89
5.3.1 Sensor Configurations . . . 90 5.3.2 Distances Analysis . . . 93 5.3.3 Machine States . . . 95 5.4 Conclusions . . . 95 6 Conclusions 99 6.1 Synthesis. . . 99 6.2 Perspectives . . . 100
6.2.1 Extensions to the Current Work . . . 100
6.2.2 Longer Term Developments . . . 101
Appendices A Dataset 103 A.1 Detail of the experiments . . . 103
A.2 The scenarios . . . 104
A.2.1 Scenario 1 . . . 104 A.2.2 Scenario 2 . . . 105 A.2.3 Scenario 3 . . . 106 A.2.4 Scenario 4 . . . 107 A.2.5 Scenario 5 . . . 107 A.2.6 Scenario 6 . . . 108
A.2.7 Scenario 7: Additional data sequences. . . 108
A.3 Remarks . . . 109
B Construction equipment visibility 113
Notations and Symbols
R, C Sets of real and complex numbers respectively
Rn, Cn Sets of n-dimensional real and complex linear space.
˛v An n-dimensional vector
M A matrix
xT, MT Transpose of vector x and matrix M
„, —, Â, ◊, µ Angle variables
L The Lidar frame
C The camera frame
I The image frame
LP = (◊l,dl) A point P in the L frame
CP = (X, Y, Z) = (R, ◊, „)T A point P in the C frame (in Cartesian and Spherical
coordinates)
NS Number of Lidar measurements in one scan
C[R, t]
L The rotation matrix and translation vector from L to C
frame
K Intrinsic parameters matrix.
“, “x, “y Focal length of the camera
p0 = (u0, v0)T The principal point of the camera
x = [u, v, 1]T Homogeneous coordinates of a point in the image plane kc= (k1, k2, k3, p1, p2) Vector of distortion coefficients
˜p = ˜(u, ˜v)T Distorted point coordinate on image frame
rd, ru Distance from a point p to p0 in rectify and distorted
images.
”u(r), ”v(r) The radial distortions
”u(t),”v(t) The tangential distortions
R Plane rectangle around an hypothesis person.
CP
R Center point of R in the C frame
H, W Height and width of R in C frame
h, w Height and width of R projected on image frame
l The dense feature maps at scale l
Gx(x, y), Gy(x, y) Gradient value at position (x, y) on I
Ê Number of gradient orientations in Histogram of Oriented
Gradient image features
Abbreviations
2D Two-dimentional
ACC Adaptive Cruise Control
ABS Anti-lock braking system
ADAS Advanced Driver Assistance System
CMOS Complementary metal–oxide–semiconductor DET Detection Error Trade-off
ESC Electronic Stability Control
FET The fisheye transform
FOV Field-of-view
FN/FP False Negative/False Positive FPPI False Positive Per Image FPPW False Positive Per Windows
FPR False Positive Rate
HFOV Horizontal Field of View
HOG Histogram of Oriented Gradient
IRNS Institut national de recherche et de sécurité
IV Intelligent Vehicle
KF Kalman filter
Lidar Light Detection And Ranging MAP Maximum a posteriori estimation
MSE Mean Square Error
MAD Mean Average Distance
MR Miss Rate
NIOSH National Institute for Occupational Safety and Health (USA)
PCA Principal Component Analysis
PDS People Detection System
PF Particle filter
PFET The polynomial fisheye transform Radar RAdio Detection And Ranging RFID Radio-frequency IDentification ROC Receiver Operating Characteristic
ROI Region of Interest
SFM Structure from Motion
SIFT Scale-Invariant Feature Transform SLAM Simultaneous Localization and Mapping
SVM Support Vectors Machine
TN True Negative
TPR true positive rate
TTC Time to collision
List of Figures
1.1 Example of common types of heavy machines. . . 2
1.2 Report accidents by types of machines. . . 3
1.3 Report on causes of accidents by operations. . . 3
1.4 Cat Electronics’ camera system for heavy machines. . . 6
1.5 A general architecture proposed for an on-board pedestrian detection system.. . . 7
1.6 Example of appearance deformation from VIPeR dataset [Gray 08]. . . 9
2.1 Comparison of high risk area in unassisted and assisted driving. . . 14
2.2 Breaking distance in function of the vehicle speed. . . 14
2.3 Typical risk areas of a heavy machine. . . 16
2.4 Example of accident cause by an excavator. . . 16
2.5 Examples of different camera optics. . . 17
2.6 Multi-sensors system characteristics. . . 18
2.7 Greensight ultrasonic detection system from Groeneveld . . . 18
2.8 The Lidar and fisheye camera used in our proposed system.. . . 19
2.9 Diagrams of the visualizing areas in L110E Volvo loaders (images from [Pratt 01]) . . . 21
2.10 Sensor configurations map. . . 22
2.11 Typical target-based calibration setup for a camera and a 3D Lidar using a planar checkerboard pattern.. . . 24
2.12 Calibration images taken by the fisheye PointGrey Firefly MV camera. 24 2.13 Positive examples from some different pedestrian datasets. . . 27
2.14 Illustration of the wide FOV advantage in covering blind angles in heavy machine. . . 28
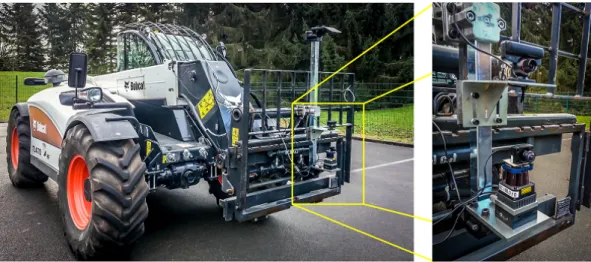
2.15 Architecture of the acquisition system. . . 29
2.16 The telescopic forklift Bobcat TL470: Real images of the acquisition system setup in the configuration 1. . . 29
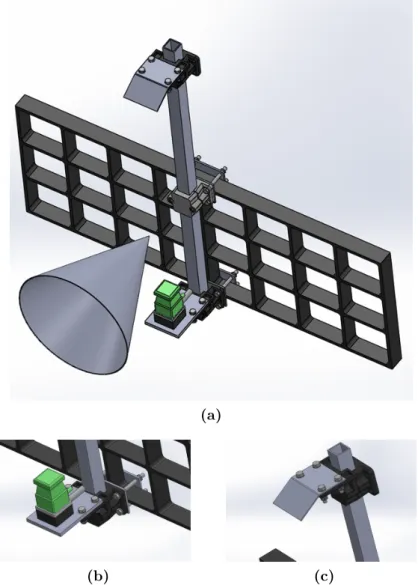
2.17 The designed support used to install the sensors system . . . 30
2.18 Test samples extracted from our heavy machine dataset. . . 32
2.19 Test sample of overlap-based evaluation for PDS. . . 32
2.20 The overlap criterion. . . 33
3.1 Haar and Haar-like features. . . 36
3.2 The Blaxtair system’s framework. . . 40
3.3 An illustration of voting process in Histogram of Oriented Gradients. . 42
3.4 The HOG-based features computation process:: Normalization blocks around one cell in HOG. . . 43
3.5 Transformation projection to reduce dimension of the reduced-HOG . . 44
3.6 Sliding window at scale Si. . . 47
3.7 The people detection process at one scale . . . 48
3.8 Detection process at one scale in the deformable part model approach [Felzenszwalb 10]. . . 49
4.1 Spherical coordinates used in fisheye cameras. . . 52
4.2 Mapping functions between an image with distortions and a rectified image. . . 54
4.3 Fisheye projection models (images from [Hughes 10]). . . 54
4.4 Mean-square-error of appearance on the fisheye image versus the relative position of a person to the camera. . . 57
4.5 Field of view. . . 58
4.6 Regions on the fisheye camera’s FOV. . . 58
4.7 An example of stretching effect in undistortion procedure. . . 59
4.8 Comparison of the different interpolation methods illustrated on a checker-board pattern (image from [Gadermayr 13]). . . 60
4.9 Example of artificial distorted images and their corresponding positions on the fisheye camera’s FOV. . . 63
4.10 Distortion functions. . . 63
4.11 Examples of pixel values in the padding zone. . . 64
4.12 Flow chart of the proposed detection approaches. . . 65
4.13 Results of different detectors trained with different percentage of dis-torted samples on fisheye test sequences. . . 66
4.14 Log-average miss-rate versus the percentage of distorted image in train-ing dataset. . . 67
4.15 Evaluation of detection performance along the horizontal axis of fisheye
images.. . . 67
4.16 A situation when people detection method works better on original fish-eye image than rectified image. . . 68
4.17 Visualization of HOG features in an original distorted image sample captured by a fisheye camera. . . 69
4.18 Visualization of HOG features in artificial distorted image samples. . . 69
4.19 Visualization of HOG feature from different border extension methods. 70 4.20 Visualization of HOG feature from different border extension methods after distortion simulation process. . . 70
4.21 ROC curves of the mix-training-dataset approach with 50% distorted training dataset, using different padding functions.. . . 71
4.22 Illustration of adapted deformable part model to fisheye FOV. . . 74
4.23 Detection performance of the dimensional-reduced-HOG vs the conventional-HOG using the root-filter only and using the DPM approach. . . . 75
4.24 Visualization of DPM models trained with different datasets. . . 76
4.25 Detection performance of the DPM approach trained with different datasets and the adaptive-DPM approach. . . 77
4.26 Examples of detection results with the DPM approach and the adaptive-DPM approach. . . 78
5.1 The Lidar-based sensor data fusion architecture. . . 84
5.2 Lidar coordinate. . . 85
5.3 Processing steps in the Lidar-based PDS. . . 87
5.4 Computation of the ROI’s angle on image . . . 88
5.5 Detection performances comparison between the vision-based only ap-proaches and the Lidar-fisheye camera PDS in configuration 1. . . 90
5.6 Raw detection result from adaptive-DPM. . . . 91
5.7 Detection performances comparison between the vision-based only ap-proaches and the Lidar-fisheye camera PDS in configuration 2. . . 92
5.8 Detection performances comparison between the vision-based only ap-proaches and the Lidar-fisheye camera PDS at different distances. . . . 93
5.9 Extreme case where the DPM apprach fails. . . 94
5.10 Diagram of the scenarios in the heavy machine dataset which illustrate the operation state of the machine. . . 96
5.11 Detection performances comparison between the vision-based only ap-proaches and the Lidar-fisheye camera PDS in different state of the machine. . . 97
A.1 Diagram of the scenario 1 . . . 104
A.2 Diagram of the scenario 2 . . . 105
A.3 Diagram of the scenario 3 . . . 106
A.4 Diagram of the scenario 5 . . . 107
List of Tables
2.1 Intrinsic camera parameters. . . 25
2.2 Extrinsic camera parameters. . . 25
2.3 Summary of some current pedestrian datasets. . . 27
2.4 The testing dataset statistics. . . 31
3.1 Reference people detection approach. . . 41
3.2 Block normalization methods in HOG features computation process. . . 44
4.1 Fisheye lens projection models. . . 54
4.2 Non-linear fisheye radial distortion models. . . 55
A.1 Scenario 1 descriptions . . . 104
A.2 Scenario 2 descriptions . . . 105
A.3 Scenario 3 descriptions . . . 106
A.4 Scenario 4 descriptions . . . 107
A.5 Scenario 5 descriptions . . . 107
A.6 Scenario 6 descriptions . . . 108
A.7 Additional data sequences description . . . 108
A.8 Summary of setup 1: configuration sensors 1 . . . 110
A.9 Summary of setup 2: configuration sensors 2 . . . 110
A.10 Summary of setup 3: configuration sensors 3 . . . 111
Chapter 1
Introduction
Contents
1.1 The Heavy Machine Context . . . . 1 1.2 People Detection Systems . . . . 3 1.3 Problem Statement . . . . 6
1.3.1 The People Detection Systems’ Generic Framework . . . 6
1.3.2 Challenges . . . 8 1.4 Contributions and Organization of the Thesis . . . . 10
1.1 The Heavy Machine Context
Construction sites are always considered as a high risk working environment. People who work near heavy machines are constantly at risk of being struck by machines or their components. Accidents between machines and people represent a significant part to construction health and safety hazards. Well trained operators as well as protection equipment are effective ways to reduce injuries and deaths; it is however difficult to remove altogether these hazards. In many cases, accidents are caused by experienced operators due to the lack of vision, especially on machines of large size. Drivers are required to keep watching all around their vehicle and fulfill their productive task. All manipulations on a usually complex machine need a lot of attention. The most experienced and watchful driver may not notice that some people are working in the vicinity of a machine, especially in blind angles. Without the help of efficient detection devices, safety is very difficult to maintain.
Due to their large different functionalities and shapes (see Fig. 1.1), accidents caused by heavy machines are various. From the IRNS document1 [Marsot 08], we obtained
(a) Loader (b) Excavator (c) Crane
(d) Forklift (e) Road grader (f) Truck
Figure 1.1: Example of common types of heavy machines.
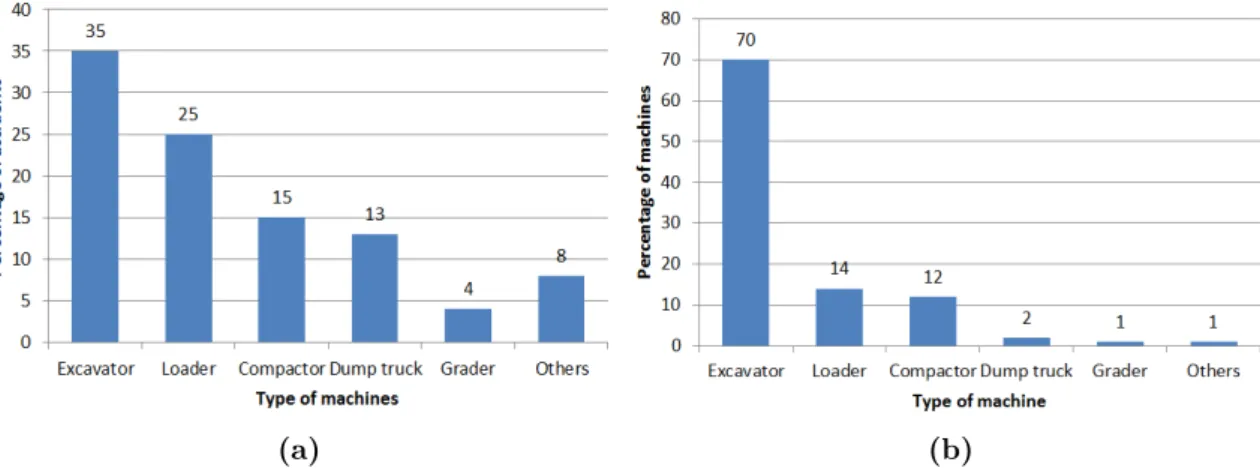
information about the investigations of accidents from the EPICEA database2, in the period starting from 1997 to 2008 for France. From 2157 accident cases of all kinds, there are about 15% caused by collisions between machines and people (Fig. 1.2a). Although, the number of accidents caused by excavators is high, it is not the most dangerous type of machines even if it represents up to 70% of all affective machines in construction (Fig. 1.2). Indeed, graders with a very few numbers of affective machines cause up to 4% of the accidents. It is therefore the most dangerous machine followed by dump trucks. The problem of these types of machine lies in the limited visibility of the driver, which will be addressed later in chapter 2.
If we go further into details, accidents often happen with machines in movement (69%), especially in backward motion (42%). In static working circumstances, most of the time accidents are caused by movements of the arms of the excavators (19%) and the remaining 1% happens during wheels turning (see Fig. 1.3).
Later on, the National Institute for Occupational Safety and Health (NIOSH) published another report on safety hazards in construction sites in USA [Stephens 13]. During the period 2003-2010, 962 workers were killed while working at construction sites. 87% of these deaths were to workers working on site at the time of the incident and the remaining 13% were to people passing through the construction site. Workers on site were primarily killed when struck by moving equipment, followed by fall from moving equipment, and collisions between machines when the victims were operating inside.
2EPICEA is a data base on working accidents, made by collaboration between CNAMTS (Caisse
nationale de l’assurance maladie), CRAM (les Caisses régionales d’assurance maladie) and INRS (Institut national de recherche et de sécurité) since 1988.
(a) (b)
Figure 1.2: Report accidents by types of machines: (a) Partition by number of accidents. (b) Partition by number of machines.
Figure 1.3: Report on causes of accidents by operations.
Incidents caused by moving equipments accounted for 76% of fatal injuries. These data once again confirm the remarks that the incidents caused by moving equipment take the majority.
1.2 People Detection Systems
In view of these worrying statistics, efforts have been made to improve the safety for people working around heavy machines. There are society concerns as it has direct im-pact in terms of casualties, economic and societal costs. As part of the actions leaded by the CETIM, the need for an intelligent safety system for heavy machines have been identified for construction equipment. A meeting in January 2013 was organized by the CETIM and its subscribers to gather the opinions from different heavy machines manufacturers. They all show strong interests in such issue. More important, inno-vations and developments associated to the topic are scientifically interesting. In the literature, there exist 3 radically different approaches:
• Infrastructure design enhancements: Construction sites design to improve safety, fix or moving surveillance cameras systems to predict risks of collisions.
• Passive safety systems, involving vehicle design: The physical parts of the vehicle are optimized in order to minimize impact severity.
• Active safety system based on Pedestrian Detection System (PDS).
The active safety system has many advantages compare to others. The infrastructure design approach [Hwang, Kunimatsu 06, Soungho 09] is adapted to large scale work (big buildings, roads, bridges etc.), but it is not suitable for small scale daily works such as: maintenance, trucks moving outside the construction site, rescue, public working on streets, etc. Passive safety systems have known improvements. Some examples of this research direction often referred to as improving safety through design by accom-modating the pedestrian’s head in the case of a crash [Koch 03, Crandall 02]. These approaches were popular and show promising results for automobiles but the applica-tion for heavy machines meets various practical problems because of their various sizes and complicated shapes. Moreover, this passive approach is useful in reducing severity of the accident to a certain limit but it is not the radical solution.
To better prevent than cure, active safety solutions took the lead recently. Research has moved toward intelligent systems which are able to predict dangerous situations and anticipate the accidents. They are referred as advanced driver assistance systems (ADAS), in the sense that they help the driver by providing warnings, assistance to take decisions and even taking automatic evasive actions in extreme cases. Nowadays we are familiar with ADAS in automobiles. For example, the first adaptive cruise control (ACC) system, which keeps a constant distance to the front vehicle by slowing or accelerating the host one, were introduced in high-end cars in the late 1990s3 . Lane Departure warning systems, which can warn the driver when the vehicle moves out of its driving lane, was first included in trucks in 2000 [IVsource 00].
Pedestrian Detection Systems (PDSs) are a particular type of ADAS. A PDS is capable of detecting both static and moving people in the surroundings of the vehicle in order to provide information to the driver. In some cases, it can perform overriding braking actions if needed.
Pedestrian detection is a research area that arose more than a decade ago. It gained a lot of attention thanks to their applicability in safety systems for the industry. Most of the techniques and methods come from areas of robotics, computer vision for au-tonomous navigation, and machine learning. Applications based on PDSs are popular in the context of intelligence vehicles. In fact, PDSs on automobile have known impor-tant progresses in the last decade [Enzweiler 11a, Felzenszwalb 10, Dalal 05].
Although the problematic is similar, the context of heavy machines have it owns char-acteristics and requirements. In the automobile field, cars need to stop if there is an
3Nissan Cima 1998; Toyota Celcior 1997; Lexus LS430 1996; Mercedes-Benz S, E, CLS, SL, CL,
obstacle, no matter if it is a pedestrian or any other object. The task of recognizing people is more important for heavy machines where the main requirement is human’s safety. Besides, cars often operate at a higher speed. While it is important for the sys-tem on automobile to be able to detect people at far distances, heavy machines need a larger field-of-view (FOV) to cover the nearby area. Construction machines often have a complicated shape and large size, which can also benefit from the large FOV. Also in the context of automobile, the assumption of the existence of a dominant plane is reasonable because most of roads are locally flat. Such a hypothesis is important to detect obstacles and region of interest (ROI) in view frames. This hypothesis is, however, not always true for the heavy machinery environments. . This is an essential difference between the two applications.
To this end, most of the vision safety systems dedicated to heavy machine do not include recognition functions. For example: Caterpillar Electronics and Electrical Systems de-veloped a machine-mounted closed-circuit vision system devoted to rugged applications and environments - the “Work area vision system” (WAVS). This system uses cameras in order to cover blind spot locations of large machines. It has been proven reliable against vibrations, pressure washing and adverse environmental conditions. Cameras are sealed with cover that can withstand high pressure wash and immersion and in-ternal heater for removal of condensation, snow and ice [Electronics 08]. Caterpillar further demonstrates commitment to mining safely with “Integrated Object Detection System”. It combines cameras, radar, and alarms to notify the operator of the pres-ence of an object close to the machine but not in the operator’s field of vision. A display screen in the cab provides visual confirmation of the objects detected by radar, which enables the operator to make informed decisions when moving a mining machine [Cat 09] (see Fig. 1.4).
The system has been built to be integrated within Caterpillar large mining trucks4, intended to aid an operator when starting to move a truck and during low speed maneuvering. Radars detect both moving and still objects, and camera views are available at all times [League 96]. The used radars are both short range, which detect objects as far as 7 meters, and medium range radars, which have a range of 20 me-ters [Sarangapani 00]. The Caterpillar Integrated Object Detection System has been available for many models of large mining trucks since early 2010.
Advanced Mining Technologies (AMT) with the help of the Australian Commonwealth Scientific Industry Research Organization (CSIRO) has developed a Collision Avoid-ance System (CAS) aimed at greatly improving heavy machine safety and eliminating the need for false alarms. It is now in operation at 27 mine sites around the world. This technology uses color video cameras with an LCD video display unit as a vision aid (CAS-CAM) and radio frequency (RF) transmitters and receivers for automatic
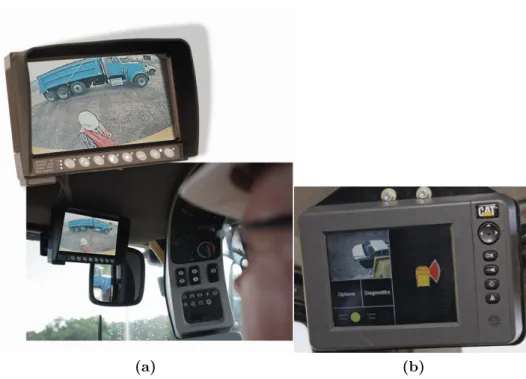
(a) (b)
Figure 1.4: Cat Electronics’ camera system for heavy machines: (a) The work area vision system (b)The integrated object detection system.
object detection and classification (CAS-RF). The combined video camera and RF technologies form the CAS-CAM/RF System.
For heavy mobile mining equipment, the system provides full 360¶ object detection that continuously identifies potential high-risk scenarios in all directions. When a risk scenario is detected, the camera view switches to the direction of the vehicle at risk and provides a warning of the pending danger to the operator. The two-way-alarm feature provides operators of other vehicles a warning to take appropriate action. The AMT CAS supports programmable “risk zones” to adapt to multiple mining equipments. Other elements apart from machines can be equipped with a transceiver alerting drivers of heavy mobile equipment, such as people and other non-moving obstacle. The system does not depend on any external infrastructure for operation as a safety device and the range is up to 150m surrounding each vehicle [Adv 07]. The combination of RFID technology and camera appears to be a smart choice to prevent collisions. The only limit is the exterior people and vehicles without the tags that are excluded from the protection.
1.3 Problem Statement
1.3.1 The People Detection Systems’ Generic Framework
Notwithstanding many years of progress, there are still unresolved issues of people detection and recognition in construction environment. In this thesis, we are mainly
concerned about what the system sees with the help of different perception sensors, and how we can extract useful information for robust people detection from these multi-modality sensors. Image-based systems are the most popular approaches to detect people so far. However, recent approaches tend to integrate more information, from other sensor technologies [Gandhi 07,Broggi 09, Geronimo 10a]. After considerations, we proposed a system using range (Lidar) and vision-based (camera fisheye) sensors. Deeper discussions about the system will be presented in chapter2. The system follows a PDS generic framework of 5 conceptual modules (Fig. 1.5).
Figure 1.5: A general architecture proposed for an on-board pedestrian detection system. The diagram is a simplification that covers most of the PDS structure.
• Preprocessing module: Raw sensor data need to be prepared for subsequent stages. The processes associated with this module are: sensor parameters adjust-ments, laser-camera calibration, data synchronization, filtering and distortions rectification.
• Candidate generation module: Here, the scene is analyzed to avoid as many background regions as possible. The entities of interest are extracted and fed to the classification module. Many approaches do not contain a specific segmenta-tion module but use a simple thorough scanning method (e.g., sliding window) in both space and scale. Pedestrian size constraints and the flat-world-assumption, which refers to the aspect ratio, size and position of the person is often arbitrary fixed [Gerónimo 07].
• Feature extraction and classification module: Learning and recognizing human’s forms from images data is a typical recognition problem where the lack of explicit models leads to the use of machine learning techniques. This module receives a list of candidates likely to contain a person, extracts features and classifies them with the aim of balancing false alarms and miss detections. • Fusion and tracking module: The candidates classified as people are verified
and refined using fusion rules or methods. The tracking module follows the detected people along time with several purposes, such as avoiding spurious false detections, predict the next pedestrian position and direction, to be robust to occlusions.
• Applications module. Higher level decisions and reactions are made using results from the previous modules, such as trigger the alarm, automatic brakes etc.
The applications module represents a complete area of research, which includes not only driver monitoring and vehicle control but also psychological issues, human-machine-interaction and so on. In the scope of this thesis, we are interested only in solving the perception part of the PDS system.
1.3.2 Challenges
Challenges faced by a people detection system for heavy machines knotty and they come from two main sources: the sensors and the context.
a - People Detection using Cameras
Compared to other sensors such as GPS, inertial or distance sensors (radar, laser, ul-trasonic), the cameras offer the greatest amount of information and, because of their versatility, allow to achieve both high-level contextual and low-level geometrical infor-mation about the observed scene, and this at a high speed and with a low cost. These are, again, passive sensors that consume little energy and are easily miniaturized. How-ever, their use is not so simple and poses a number of theoretical issues related to how this sensor perceives its environment since, the image formation is a lossy process in which a three-dimensional scene is projected onto a two-dimensional image plane. Since the camera data is sometimes incomplete and often noisy, the detection system must find the most essential characteristics of the appearance to distinguish objects classes. The deformation, the viewpoint, and the lighting conditions can dramatically change the shape and the appearance of an object in an image. Together, these factors produce numerous variations.
• Light variation: Under different lighting conditions, an identical scene captured by an imaging sensor can lead to very different results. It is a classic problem using visual sensor, and there is no radical solution but it can be improved by preprocessing methods to extract image features that can be invariant to changes in illumination conditions.
• Deformation: The deformation of a 3D object can cause a dramatic change in the projected 2D appearance of the object. At a conceptual level, a person composed of a large number of rigid parts, linked together through non-rigid con-nections. A person “deforms” when body parts change their relative positions. Given that people can change postures, wear different clothes, carry different
objects, the appearance variability is very high (Fig. 1.6). A successful object detection system must be able to recognize objects across a wide range of defor-mations.
• Viewpoint: The person’s appearance may change significantly when the cam-era’s viewpoint is altered. Small changes in viewpoint can be approximated as deformations. Larger viewpoint changes, however, often result into almost no shape similarity.
• Occlusion: A person can be partially or fully occluded by different obstacles in the scene. The occlusion in an image sequence might be compensated by recognition algorithms and by tracking methods. A lot of efforts have been made but at the best of ours knowledge, this problem is still unsolved.
Figure 1.6: Example of appearance deformation from VIPeR dataset [Gray 08].
b - The Heavy Machine Context
Harsh working conditions make the required performance of PDS systems for heavy machine quite demanding in terms of system reaction time and robustness (i.e., false alarms versus miss detections). Misses should be avoided, but too many false alarms may easily cause the system to become a nuisance to the driver.
• Computational complexity: Often, detection and recognition algorithm have a high computational complexity. The system consists of different sequential steps. Delay from the first instant when data collected from sensors until the last decision made, must respect the constraint of time. With such a complex system with dependencies between different layers, it can be a challenge. Fortunately, heavy machines in general do not operate at a high speed. Working rate of the system at some results per second can be considered as enough.
• Dynamic working environments: Given that not only the pedestrians move but also the sensors mounted on the machine do, the scenes are very dynamic. Pedestrians shall be identified in outdoor scenarios, that is, they shall be de-tected in a cluttered background (urban, construction areas are more complex than highways) under different illumination and weather conditions (dust, windy, rainy, various humidity and changes of temperature) that add variability to the quality of the sensed information (e.g., shadows and poor contrast in the visible spectrum). The challenges stated in subsection1.3.2is pushed to its limit by the harsh working condition.
• Variety Unlike automobile situations, shapes and functionalities of heavy ma-chines evolve very fast. Finding the best configuration of sensors for an optimized perception field-of-view is a tricky question which requires understanding about sensor characteristic, machines operation habit and accident statistic. We take advantage of the very wide FOV of fisheye cameras to cover blind angles in the context of heavy machines. These advantages come with a price of some degra-dation in detection performance of PDSs, mostly caused by the distortions.
1.4 Contributions and Organization of the Thesis
In this thesis, we started with an objective of building a PDS to improve the safety for people working around heavy machines. We approach the problem of people detection from a global viewpoint with clear needs, challenges and opportunities. Instead of focusing on improving specific tasks as it is frequent presented in the literature, our research approaches the topic from a more global perspective with many open possi-bilities. A thorough analysis of the context is essential to build an adapted system configuration. Existing methods for feature selection, classification, detection, fusion and tracking among others, were conveniently adapted and modified to solve the prob-lem of pedestrian detection in construction environment. The contributions and the organization of this dissertation can be resumed in three essential points:
• Chapter 2 serves as a prologue to our pedestrian detection problem. Practical issues such as: sensors’ characteristics, system configuration, sensor calibration, evaluation protocols are discussed. We present a prototype system mounted on-board a vehicle which has been used to acquire data and testing some of the proposed techniques along the thesis. It is not a complete detection system since it is not running in real time, but we aim to give a feeling of the current possibilities of the PDS concept. Since the configuration and the context have very specific characteristics, a novel dedicated dataset has been created with the CETIM. This dataset, called heavy machine dataset, contains data from a Laser-scanner and 2 cameras mounted on a heavy machine.
• Chapters 3 and 4 focus on quantifying the influences of distortions in fisheye images on people detection algorithms. The HOG and DPM approaches among others are studied and evaluated taking account the strong distortion of fish-eye images. From those analyses, two solutions to compensate the influences of distortion are proposed, namely the mix-training-dataset and the adaptive-DPM. • In chapter5, taking advantage of the multi-sensors system, we present a robust multi-views invariant regions of interest (ROIs) projection from Lidar to fisheye camera. This projection method allows us to build a sequential Lidar/camera fusion PDS that improves significantly the robustness of our proposed system.. Synthesis and limitations of the proposed approaches together with directions and future works are also discussed in the conclusion chapter. Parts of the work presented in this thesis have been published in the following conferences articles:
• Bui, M. T.; Frémont, V.; Boukerroui, D. & Letort, P. People Detection in Heavy Machines Applications, IEEE International Conference on Cybernetics and In-telligent Systems, 2013.
• Bui, M. T.; Frémont, V.; Boukerroui, D. & Letort, P. Deformable Parts Model for People Detection in Heavy Machines Applications, IEEE International Con-ference on Control, Automation, Robotics and Vision, 2014.
• Bui, M. T.; Frémont, V.; Boukerroui, D. & Letort, P. Multi-sensors people de-tection system for heavy machines, IEEE International Conference on Intelligent Transportation Systems, 2014.
Chapter 2
The Proposed Multi-sensors System
Contents
2.1 The Sensor System . . . . 13
2.1.1 Effective Sensor Range . . . 13
2.1.2 Proposed Sensors Combination . . . 15
2.1.3 Sensors Positions on Heavy Machines . . . 20
2.1.4 Sensor Calibration . . . 23 2.2 The Heavy Machine Dataset . . . . 25 2.3 The Evaluation Method . . . . 30 2.4 Conclusions . . . . 33
2.1 The Sensor System
In order to increase the safety during operations, ADAS on heavy machines require accurate, pertinent and reliable information about the vehicle’s surrounding. Since the environment is often complex and each sensor has a limited perception, single-sensor based solutions usually do not give satisfying solutions. In order to bypass these limitations, we propose to study a multiple sensing strategy to obtain an augmented field-of-view and redundant important perception information.
2.1.1 Effective Sensor Range
The injuries severity of people in accidents increases with the crashing vehicle’s speed. Effectively, a small speed reduction can reduce significantly the consequence of a crash. While a person has less than 50% chance of surviving to impacts at 45km/h, there is 90 chance of surviving to crashes at 30km/h or below [Ashton 83, Triggs 82]. As argued in the introduction chapter, actively detecting the risk of crash before the impact,
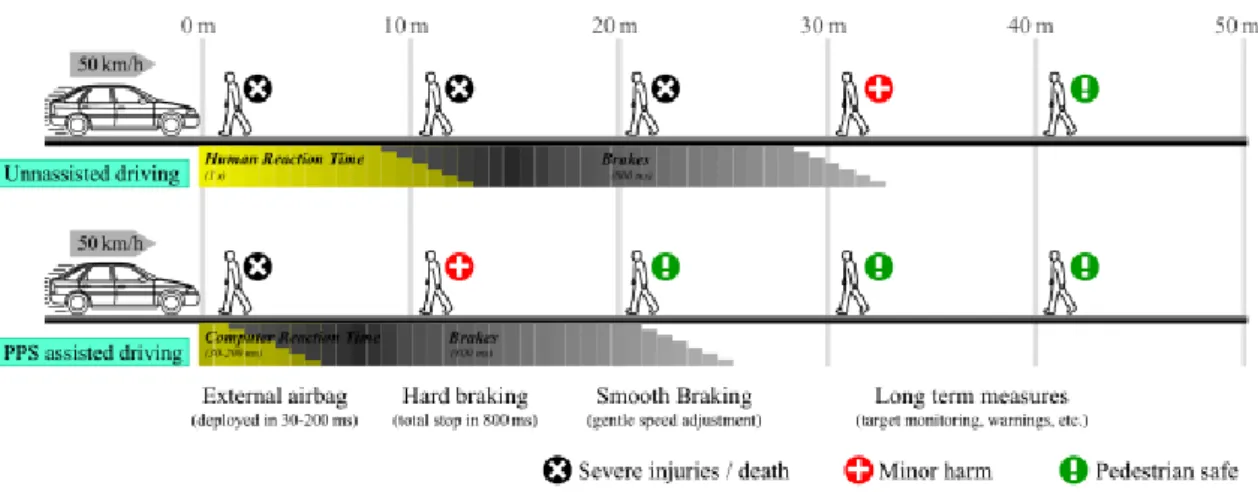
Figure 2.1: Comparison of high risk area in unassisted and assisted driving. Without assistance (top), a pedestrian is likely to suffer severe harm if he or she stays at less than 25m distance. With assistance (bottom), the reaction time is reduced to 100ms or less [Gavrila 04,
Shashua 04]. Beside providing warnings to the driver in a reduced time, they can also control different security actions like airbags or brakes. Hence, the distance where pedestrians can be severely damaged is significantly reduced (about 15m).
either at long or short distance, is then much more helpful than passively protecting the person during the impact. The relation between vehicle speed and the injuries is a classical topic of research in the automobile sector but the results are also very informative in the context of heavy machines.
Fig. 2.1illustrates potential of PDS systems from an automobile example [Geronimo 10a]. The typical scenario is a vehicle moving at 50km/h. The total stopping distance Dtc
is the sum of the perception-reaction distance Dpr and the braking distance Dbr. Dtc = Dpr+ Dbr = vtpr+
v2
2G(f ± s) (2.1)
Figure 2.2: Breaking distance in function of the vehicle speed.
The breaking distance has been computed using the equation v2
initial speed, G is the gravity acceleration (9.8m/s2), f is the friction coefficient (range from 0.5 to 1, depend on weather, tires, etc.) and s is the road slope. In this example, baseline values f = 0.7 and s = 0 have been used (see Fig. 2.2). The human perception-reaction time tpr depends on several driver (age, number of continuous driving hours,
alcohol consumption) and scene (distractors presence , day/night conditions) factors. Experts incorporate perception experiments, resulting in an average of perception-reaction time of 2s. This value corresponds to the ability of a typical driver under normal road conditions [Taoka 89, Jernigan 01]. The Driving Assistance System is expected to detect the person at the range of 30m to have sufficient distance to avoid the collision. For vision-based sensors like cameras, the main difficulty comes from the fact that far peoples appear very small and too close ones cannot be fully captured in the image. For example, with a VGA resolution (640 ◊ 480 pixels) and 36¶ vertical FOV, the image of a 1.8m height person at 25m is only 60 pixels high and is not fully visible at a distance closer than 4m. Most of the PDSs for automobile are focused on the distances range from 5 to 25m to the sensor, called the High Risk Area (e.g. the MobilEye System1). This range conforms to the stopping distance of cars in rural conditions.
Heavy machines have two main operation modes: they stay nearly static in working cir-cumstances or move from one to another working position. In the first case, a very wide FOV is desired to cover blind angles. In the latter case, the speed limitation depends on the machine’s category but it is always lower than for automobiles. For example in Europe, the construction machines’ maximum speed on public road is 25km/h. The high risk distance computed by Eq. 2.1 in unassisted driving case is about 11m where the Dpr ¥ 7m. As a result, we define the High Risk Area of heavy machines from 0 to
7m (see Fig. 2.3).
2.1.2 Proposed Sensors Combination
PDSs can be based on active or passive sensors. Various kinds of sensors, including ultrasonic, Lidar, radar, RFID and cameras have been tested and compared, individ-ually [Oliveira 10a,Premebida 09] or combined [Broggi 09, Spinello 08, Douillard 07]. Some of them are actually used in large scale in Australia and Africa [Swedberg 05], especially in mining applications [RFID 00, Wiborne 05]. Each type of sensor has its advantages and drawbacks. For example, active range sensors (Lidar, radar, ultrasonic) are very good at estimating distances in real-time, while cameras not only have the advantage of a high resolution (horizontal and vertical), but also provide others useful information like texture, color and depth. Range sensors are often used in obstacles detection applications. They are often equipped but are not very practical for heavy machine because these machines often work close together and have interactions with
Figure 2.3: Typical risk areas of a heavy machine.
different kind of obstacles. An example is illustrated in Fig. 2.4: A worker is staying between an excavator and a wall. Once the excavator makes a swing, worker would be crashed between them [Brech 09]. In this situation, Lidar and ultrasonic sensors are already in alarm mode because of the wall without noticing the presence of a human. Moreover, the annoying alarm distracts the driver instead of protecting the person.
Figure 2.4: Example of accident cause by an excavator.
Compared to other perception sensors such as GPS, inertial or distance sensors (radar, Lidar, ultrasonic), the cameras offer the greatest amount of information and, because of their versatility, allow to achieve both high-level contextual and low-level geometrical information about the observed scene, and this is at high speed and low cost. These are, again, passive sensors that consume little energy and are easily miniaturized. An
image is represented by a bi-dimensional array where each element (pixel) takes value over a discrete brightness range (typically 0 to 255 for 8bit quantization).
We are interested essentially in the problem of people recognition by their appearance so the camera is the obvious choice. Cameras typically cover a 45° horizontal field-of-view. There exists also special optics (so-called fisheye) that can cover up to 180° horizontal field-of-view, and the catadioptric camera (also called omnidirectional camera) that provide a coverage of a hemisphere field-of-view in a single image. Sample images of these vision sensors are shown in Fig. 2.5. It is worth mentioning that images obtained from catadioptric cameras are have low resolution at the border areas and have a central blind spot. These constraints have to be taken into account in the processing task.
(a) perspective image (b) Dioptric image (c) Catadioptric image
Figure 2.5: Examples of different camera optics.
In this work, we choose to use fisheye camera as the main sensor of the PDS because of numerous absolute advantages compared to other sensor types. Actually, very wide angle vision system is very popular. There are wide ranges of example in the nature. Defensive animals, typically many herbivores, have a large field-of-view (more than 300¶) to survey the area around to be vigilance to attackers. Migratory birds have a large field-of-view for localization through landmarks and for following the horizon, which has inspired to aerial robot navigation [Demonceaux 06,Scaramuzza 08]. In the robotic field, wide angle vision is popular used in autonomous navigation because it gives more discriminate results and more robustness to changes in the environment [Mei 07, Bazin 10]. In our case, the use of fisheye optic enhances the field-of-view of the camera and also keep the system less sensitive to vibrations [Fermüller 98] , which is perfectly suitable for the context of heavy machines.
The use of cameras is however, not so simple and poses a number of theoretical issues related to how this sensor perceives its environment. One drawback of this technol-ogy is its reliability. Since images are created by the exposition of the photosensitive CMOS/CCD sensor, vision systems are drastically sensitive to light condition changes (weather, dynamic content of the observed scene, light sources, etc.). For now, most of vision systems applied to construction machines safety do not have integrated recog-nition functions. For example, Caterpillar develops an “Integrated object detection system” on their machines which is claimed to work on very harsh conditions. To
summarize, it is an obstacle detection system using a radar with a camera assistance. Once an obstacle is detected, cameras are turned on and images of the obstacle are shown to the driver [Cat 09]. Similar systems are proposed by other manufacturers like Motec2, Orlaco3, and Waeco4 for the most popular.
Camera Lidar
Parameter Description/Value Parameter Description/value
Manufacturer PointGrey Manufacturer HOKUYO
Model Firefly MV Model UTM-30LX
FOV 190¶ Layers 1 layer
Sensor type CMOS FOV ≠135¶ to 135¶(see Fig. 2.8)
Resolution 752 ◊ 480 Range accuracy ±30mm
Frequency 60 F P S Angle resolution 0.25
Focal lenth 3mm Scan frequency 40Hz
Lens Range 0.1 to 30m
Figure 2.6: Multi-sensors system characteristics.
Range information of the scene is valuable and can be obtained by different ways. By means of vision, it is possible to use special Time-of-Flight (ToF) cameras or stereo vision system [Hartley 03]. ToF cameras constitute new sensor technology which is currently not appropriate for heavy machines applications especially in term of price. Stereo vision systems have also some drawbacks, such as a heavy computation cost for disparity map, and a limited detection area due to the necessity of cameras overlapping.
(a) (b)
Figure 2.7: Greensight ultrasonic detection system from Groeneveld (image from the product datasheet). The camera is turned on when ultrasonic sensor detects an object. The object position is obtained through (a) The ultrasonic sensors include 6 emitters and 6 receptors on each side of the machine. ((b) Mounting example on the machine: 1.Control box, 2.Ultrasonic sensors, 3.Interface monitor, 4.Additional sensors, 5.The camera, 6. Alarm sirens.
Because dense range information is not essential, range sensors like ultrasonic, Lidar
2http://www.motecgmbh.de
3http://www.orlaco.com/Documentation.htm 4http://www.waeco.com/fr/produits/4544.php
or radar, are more suitable. In practice, the most used range sensor type on heavy machines is the ultrasonic. It is often used as a modality to detect obstacles. The ultrasonic sensors are very useful to estimate the presence and the distance of objects at close range. It is possible to get the object position through overlap detections, as done in the Greensight ultrasonic detection system from Groeneveld5 (see Fig. 2.7). The system is designed to be robust to the context of heavy machines but the results of the position of obstacles are not so precise. Moreover, to get an equivalent FOV to the fisheye image, the system will become very cumbersome.
(a) (b)
(c) (d)
Figure 2.8: Sensors used in our system: The Lidar Hokuyo UTM-30LX (a) and its
hori-zontal field-of-view(b). The camera PointGrey Firefly MV (c) and its example image (d).
In this work, we choose to use the single layer-Lidar to take advantage of the precise measurements given by the Lidar to avoid the problem of uncertainty in the determi-nation the position of obstacles. Lidar sensors are also compact and the processing load is lighter than other sensor types.
2.1.3 Sensors Positions on Heavy Machines
The Lidar and the camera required for our system are installed on a rigid platform on the frontal part of the machine, and the camera is set above the Lidar, as depicted in Fig. 2.16. Tab. 2.6 resumes the main characteristics of the two sensors. Based on the survey of accidents caused by heavy machines presented in section 1.1, the system requirements and sensors configuration can be known in advance. The statistic shows that the danger is highly dependent on the action taken by the machine and its direction. Accidents rarely happen on the sides of the machines, except for “rotating-base machines”, such as excavators. The back and the front of a machine in motion are then the most dangerous parts.
The detailed diagrams of the visualizing areas around various construction vehicles and equipment (commonly referred to as blind area diagrams) are illustrated in Fig. 2.9. The reader can refer to AppendixB for blind area diagrams for others machine types. In general, the blind area covers at least 2m in front and behind the machines. In many cases, this blind zones range can reach 10m. The areas close to the machines, are at the same time the most dangerous areas and constitute also the blind areas for the drivers.
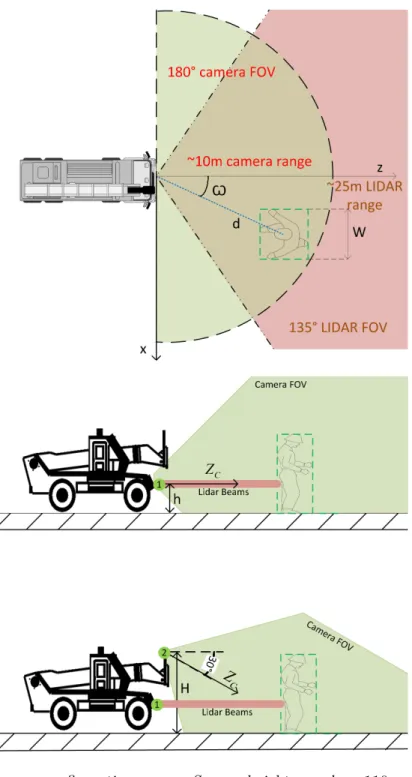
Based on the previous observations related to dangerous areas, fisheye cameras mounted at the back and in front of the machines, can fulfill most of the requirements. For that purpose, we defined two positions for the fisheye camera denoted by index 1 and 2 in Fig. 2.10 which give two different sensors configurations of the system:
• Configuration 1: The two sensors (camera and Lidar) are at position 1. In this configuration, the sensors are kept at a low position (height h = 110cm) and are mostly parallel to the ground plane. This is the most commonly used configu-ration in ADAS because the appearance of the person on the image is relatively the same at any position in the FOV of the camera. This advantage is not pre-served in fisheye images since the object appearance are distorted depending on its distance and its angle to the camera. A quantitative analysis of this distortion phenomenon is presented in section 4.2.2.
• Configuration 2: The fisheye camera is mounted at position 2 (height H = 210cm, at the forks level), looking down with an angle of precisely 30¶. The Lidar is at the same position as in configuration 1. The high position of the camera is commonly used in the context of heavy machines. The reasons are related to obtaining a better coverage of blind angles around the machine and to avoid collisions that can damage the sensors. In our case, it gives an additional advantage in observing the whole people appearance at a very close range, even when the persons can touch the machine. The main drawback is the complicated transformation of the person’s appearance obtained on the fisheye images.
(a) (b)
(c) (d)
Figure 2.9: Diagrams of the visualizing areas in L110E Volvo loaders (images from NIOSH): (a)The machine (b) Ground level diagrams (c) 900mm level diagrams (d) 1500mm level dia-grams (image from [Pratt 01]).
Let us assume that the Lidar is always parallel to the ground, which is usually the case for most of the range sensors used on the heavy machines. In the target application, this constraint will be broken whenever the heavy machine is moving on a non-flat ground, or simply due to large vehicle vibrations with respect to the ground. In practice, these
Figure 2.10: Sensor configurations map. Sensor heights are h = 110cm and H = 210cm respectively.
artifacts are minor with the use of a fisheye camera. A way to avoid this constraint is to use a multi-layers Lidar, along with a method to track the vehicle pitch [Hrovat 04, Gerónimo 06,Bawaqneh 11, Loomis 12].
In the same way, the multi-sensors system can also be mounted at the back of the machine. With the same sensors’ height and angle, we assume that the sensors data coming from the front of the machine moving forward is equivalent to the data issued by the sensors mounted at the back of the machine moving backward, and vice-versa. In practice, Position at the back is both more useful and easier to maintenance. For
safety reasons, the sensors are mounted in front of the machine in all of our data sequences.
2.1.4 Sensor Calibration
A calibration process is a prerequisite for any computer vision task that requires accu-rate geometric measurements from a given scene. It is hence a fundamental and very important task because cameras rarely follow the ideal pinhole model, in particular due to distortions effects caused by the lens elements. The calibration process can be decomposed into finding the internal (intrinsic) camera parameters and external (extrinsic) parameters.
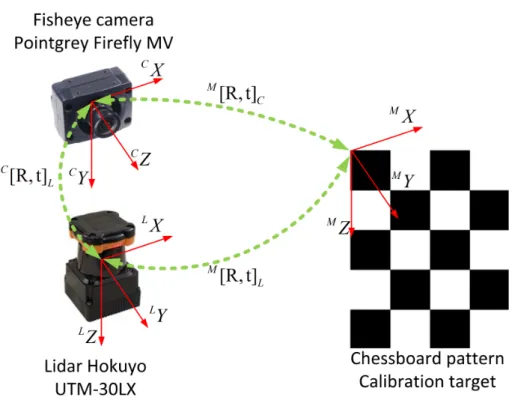
The external calibration parameters are the position and orientation (rigid body trans-formation) of the sensors relative to a given coordinate system [Hartley 03]. This rigid body transformation allows to reproject the points from the range sensor coordinate frame to the camera coordinate frame. Most of the existing algorithms for extrinsic cal-ibration of Lidar-camera systems require that the calcal-ibration targets are placed in the field-of-view of the two sensors. Many methods proposed in the past decade, use spe-cial calibration targets. The most common calibration targets used is a planar checker-board pattern (see Fig. 2.11), also called a chessboard. It was first used by Zhang et al. [Zhang 04] to extrinsically calibrate a single layer laser scanner and a monocular camera system. This was probably the first published method that addressed the problem of extrinsic calibration of Lidar/camera sensors in a robotics context. Thereafter, several modifications of Zhang’s method have been proposed. The authors of [Mei 06] reported a similar algorithm for the calibration of a 2D laser range finder and an omnidirectional camera for both visible and invisible lasers. In these works, the constraints between the laser points on the chessboard and the normal of the calibration plane estimated in the camera reference frame are used to estimate the transformation parameters by minimizing a specific cost function based on points’ reprojection error. There exist also methods that do not require any special targets but which rely upon extraction of some features (e.g. edges, lines, or corners) from the camera and Lidar data, either manually or automatically [Scaramuzza 07,Moghadam 13, Napier 13]. These automatic feature extraction methods are generally not as robust as target-based approaches and require manual supervision to achieve small calibration errors.
Based on the need of our system, the methodology adopted by [Mei 06] to calibrate the Lidar-camera setup is the most adapted. It consists in three fundamental steps while all parameters are assumed to stay constant during the experimental dataset acquisition:
• Acquisition of a synchronized set of laser scans and images (more than fifteen). The checkerboard pattern is placed in the overlapping FOV of the two sensors so
Figure 2.11: Typical target-based calibration setup for a camera and a 3D Lidar using a planar checkerboard pattern.
(a) (b) (c)
Figure 2.12: Calibration images taken by the fisheye PointGrey Firefly MV camera: (a) Estimation of the generalized focal length from line image points. (b) Extraction of the four corners belonging to the calibration grid. (c) Sub-pixel point extraction.
that it is observable in the data obtained from both sensors. (see Fig. 2.12) • Camera intrinsic parameters estimation. The internal parameters of the camera
represent the way that sensors sample the scene. Mei and Rives [Mei 06] proposed four calibration steps to initialize the unknown parameters, make the associations between the grid points and their reprojection in the image and finally run the cost minimization:
– Initialization of the principal point p0 = (u0, v0) as the center of the image. – Estimation of the generalized focal length “ (assuming “ = “x = “y) thanks
to have at least three points belonging to a non-radial line image (see Fig.
– For each image, four edge points of each grid are selected (see Fig. 2.12b), the extrinsic parameters can be estimated (see Fig. 2.12c)
– The final calibration step consists in the minimization of the global re-projection error (using for example the Levenberg-Marquardt algorithm [Moré 78]). Typically, in the case of a fisheye camera, the intrinsic pa-rameters include the focal length “, the position of the principal point p0 and the vector of lens distortion coefficients kc. All the intrinsic numerical values are summarized in Tab. 2.1.
• Lidar-camera coordinate transformation matrix (extrinsic parameters) estimation (see Tab. 2.2). It is important to notice that the auto-calibration between a camera and a laser range finder is impossible from a single image in the general case.
Point Grey Firefly MV Sony PlayStation Eye for PS3
Focal length “= [443.21; 443.07] “= [1166.05; 1140.70]
Principal point p0= [321.77; 234.43] p0= [318.72; 237.08]
Distortion coefficients kc= [≠0.177; 0.157; 6.963.10≠4; 0.002; 0] kc= [≠0.099; ≠0.006; 0.004; ≠0.001; 0.000]
Table 2.1: Intrinsic camera parameters.
Configuration 1 Configuration 2 Rotation matrix CR L= S W W W W W W W U 1 0 0 0 1 0 0 0 1 T X X X X X X X V Rotation matrix CR L= S W W W W W W W U 0.9976 0 ≠0.0698 0.0370 0.8480 0.5286 0.0592 ≠0.5299 0.8460 T X X X X X X X V Translation vector CT L= [0; 50; 0] Translation vector CTL= [0; 850; 380] Table 2.2: Extrinsic camera parameters.
2.2 The Heavy Machine Dataset
The datasets take a very important role in the development of an objects detection algorithm. Indeed, a well-defined dataset is not only useful for evaluating the approach but it also takes part in the training process to improve the performance of the objects detector. In contrast to other areas, such as face detection or document analysis, people detection lacks of well-established datasets and benchmarking protocols. Public datasets are necessary for evaluating algorithms with different example sets, taken at different places under different environmental conditions, but specifically from different

![Figure 2.13: Positive examples from different pedestrian datasets: (a)Daimler [Enzweiler 09]](https://thumb-eu.123doks.com/thumbv2/123doknet/14536856.724197/51.892.134.780.731.1081/figure-positive-examples-different-pedestrian-datasets-daimler-enzweiler.webp)