HAL Id: hal-00704248
https://hal.archives-ouvertes.fr/hal-00704248
Submitted on 5 Jun 2012
HAL is a multi-disciplinary open access
archive for the deposit and dissemination of
sci-entific research documents, whether they are
pub-lished or not. The documents may come from
teaching and research institutions in France or
abroad, or from public or private research centers.
L’archive ouverte pluridisciplinaire HAL, est
destinée au dépôt et à la diffusion de documents
scientifiques de niveau recherche, publiés ou non,
émanant des établissements d’enseignement et de
recherche français ou étrangers, des laboratoires
publics ou privés.
heterogeneous information.
Gwénolé Quellec, Mathieu Lamard, Guy Cazuguel, Christian Roux, Béatrice
Cochener
To cite this version:
Gwénolé Quellec, Mathieu Lamard, Guy Cazuguel, Christian Roux, Béatrice Cochener. Case retrieval
in medical databases by fusing heterogeneous information.. IEEE Transactions on Medical Imaging,
Institute of Electrical and Electronics Engineers, 2011, 30 (1), pp.108-18. �10.1109/TMI.2010.2063711�.
�hal-00704248�
Case Retrieval in Medical Databases by Fusing
Heterogeneous Information
Gw´enol´e Quellec, Mathieu Lamard, Guy Cazuguel, Member, IEEE, Christian Roux, Fellow Member, IEEE and
B´eatrice Cochener
Abstract—A novel content-based heterogeneous information retrieval framework, particularly well suited to browse med-ical databases and support new generation Computer Aided Diagnosis (CADx) systems, is presented in this paper. It was designed to retrieve possibly incomplete documents, consisting of several images and semantic information, from a database; more complex data types such as videos can also be included in the framework. The proposed retrieval method relies on image processing, in order to characterize each individual image in a document by their digital content, and information fusion. Once the available images in a query document are characterized, a degree of match, between the query document and each reference document stored in the database, is defined for each attribute (an image feature or a metadata). A Bayesian network is used to recover missing information if need be. Finally, two novel information fusion methods are proposed to combine these degrees of match, in order to rank the reference documents by decreasing relevance for the query. In the first method, the degrees of match are fused by the Bayesian network itself. In the second method, they are fused by the Dezert-Smarandache theory: the second approach lets us model our confidence in each source of information (i.e. each attribute) and take it into account in the fusion process for a better retrieval performance. The proposed methods were applied to two heterogeneous medical databases, a diabetic retinopathy database and a mammography screening database, for computer aided diagnosis. Precisions at five of 0.809±0.158 and 0.821±0.177, respectively, were obtained for these two databases, which is very promising.
Index Terms—Medical databases, Heterogeneous information retrieval, Information fusion, Diabetic retinopathy, Mammogra-phy
I. INTRODUCTION
T
WO main tasks in Computer Aided Diagnosis (CADx) using medical images are extraction of relevant informa-tion from images and combinainforma-tion of the extracted features with other sources of information to automatically or semi-automatically generate a reliable diagnosis. One promising Copyright (c) 2010 IEEE. Personal use of this material is permitted. However, permission to use this material for any other purposes must be obtained from the IEEE by sending a request to [email protected]. G. Quellec, G. Cazuguel, and C. Roux are with the INSTITUT TELE-COM/TELECOM Bretagne, Dpt ITI, Brest, F-29200 France, and also with the Institut National de la Sant´e et de la Recherche M´edicale (INSERM), U650, Brest, F-29200 France (e-mail: [email protected]; [email protected]; [email protected]).M. Lamard is with the University of Bretagne Occidentale, Brest, F-29200 France, and also with the Institut National de la Sant´e et de la Recherche M´edicale (INSERM), U650, Brest, F-29200 France (e-mail: [email protected]).
B. Cochener is with the Centre Hospitalier Universitaire de Brest, Service d’Ophtalmologie, Brest, F-29200 France, also with the University of Bretagne Occidentale, Brest, F-29200 France, and also with the Institut National de la Sant´e et de la Recherche M´edicale (INSERM), U650, Brest, F-29200 France (e-mail: [email protected])
way to achieve the second goal is to take advantage of the growing number of digital medical databases either for heterogeneous data mining, i.e. for extracting new knowledge, or for heterogeneous information retrieval, i.e. for finding similar heterogeneous medical records (e.g. consisting of digital images and metadata). This paper presents a generic solution to use digital medical databases for heterogeneous information retrieval, and solve CADx problems using Case-Based Reasoning (CBR) [1].
CBR was introduced in the early 1980s as a new decision support tool. It relies on the idea that analogous problems have similar solutions. In CBR, interpreting a new situation revolves around the retrieval of relevant documents in a case database. The knowledge of medical experts is a mixture of textbook knowledge and experience through real life clinical cases, so the assumption that analogous problems have similar solutions makes sense to them. This is the reason why there is a growing interest in CBR for the development of medical decision support systems [2]. Medical CBR systems are intended to be used as follows: should a physician be doubtful about his/her diagnosis, he/she can send the available data about the patient to the system; the system selects and displays the most similar documents, along with their associated medical interpretations, which may help him/her confirm or invalidate his/her diagnosis by analogy. Therefore, the purpose of such a system is not to replace physicians’ diagnosis, but rather to aid their diagnosis. Medical documents often consist of digital information such as images and symbolic information such as clinical annotations. In the case of Diabetic Retinopathy, for instance, physicians analyze heterogeneous series of images together with contextual information such as the age, sex and medical history of the patient. Moreover, medical information is sometimes incomplete and uncertain, two problems that require a particular attention. As a consequence, original CBR systems, designed to process simple documents such as homogeneous and comprehensive attribute vectors, are clearly unsuited to complex CADx applications. On one hand, some CBR systems have been designed to manage symbolic information [3]. On the other hand, some others, based on Content-Based Image Retrieval [4], have been designed to manage digital images [5]. However, few attempts have been made to merge the two kinds of approaches. We consider in this paper a larger class of problems: CBR in heterogeneous databases.
To retrieve heterogeneous information, some simple ap-proaches, based on early fusion (i.e. attributes are fused in feature space) [6], [7] or late fusion (i.e. attributes are fused in semantic space) [8], [9], [10] have been presented in the
literature. A few application-specific approaches [11], [12], [13], [14], [15], as well as a generic retrieval system, based on dissimilarity spaces and relevance feedback [16], have also been presented. We introduce in this paper a novel generic approach that does not require relevance feedback from the user. The proposed system is able to manage incomplete information and the aggregation of heterogeneous attributes: symbolic and multidimensional digital information (we focus on digital images, but the same principle can be applied to any n-dimensional signals). The proposed approach is based on a Bayesian network and the Dezert-Smarandache theory (DSmT) [17]. Bayesian networks have been used previously in retrieval systems, either for keyword based retrieval [18], [19] or for content-based image or video retrieval [20], [21]. The Dezert-Smarandache theory is more and more widely used in remote sensing applications [17], however, to our knowl-edge, this is its first medical application. In our approach, a Bayesian network is used to model the relationships between the different attributes (the extracted features of each digital image and each contextual information field): we associate each attribute with a variable in the Bayesian network. It lets us compare incomplete documents: the Bayesian network is used to estimate the probability of unknown variables (associated with missing attributes) knowing the value of other variables (associated with available attributes). Information coming from each attribute is then used to derive an estimation of the degree of match between a query document and a reference document in the database. Then, these estimations are fused; two fusion operators are introduced in this paper for this purpose. The first fusion operator is incorporated in the Bayesian network: the computation of the degree of match, with respect to a given attribute, relies on the design of conditional probabilities relating this attribute to the overall degree of match. An evolution of this fusion operator that models our confidence in each source of information (i.e. each attribute) is introduced. It is based on the Dezert-Smarandache theory. In order to model our confidence in each source of information, within this second fusion operator, an uncertainty component is included in the belief mass function characterizing the evidence coming from this source of information.
The main advantage of the proposed approach, over standard feature selection / feature classification approaches, is that a retrieval model is trained separately for each attribute. This is useful to process incomplete documents: in the proposed approach, we simply combine the models associated with all available attributes; as a comparison, a standard classifier relies on feature combinations, and therefore may become invalid when input feature vectors are incomplete. Also, because each attribute is processed separately, the curse of dimensionality is avoided. Therefore, it is not necessary to select the most relevant features: instead, we simply weight each feature by a confidence measure.
The paper is organized as follows. Section II presents the proposed Bayesian network based retrieval. Section III
presents the Bayesian network and Dezert-Smarandache theory based retrieval. These methods are applied in section IV to CADx in two heterogeneous databases: a diabetic retinopa-thy database and a mammography database. We end with a
discussion and a conclusion in section V.
II. BAYESIANNETWORK BASEDRETRIEVAL
A. Description of Bayesian Networks
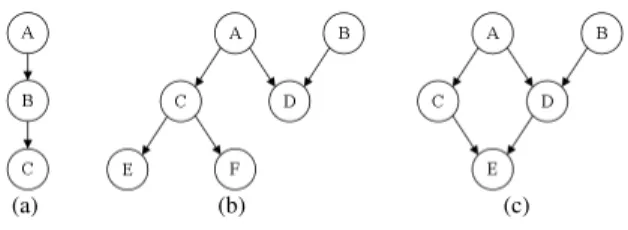
A Bayesian network [22] is a probabilistic graphical model that represents a set of variables and their probabilistic depen-dencies. It is a directed acyclic graph whose nodes represent variables, and whose edges encode conditional independencies between the variables. Examples of Bayesian networks are given in Fig. 1.
(a) (b) (c)
Fig. 1. Examples of Bayesian Networks. Fig. (a) shows a chain. Fig. (b) shows a polytree, i.e. a network in which there is at most one (undirected) path between two nodes. Fig. (c) shows a network containing a cycle: < A, D, E, C, A >.
In the example of Fig. 1 (b), the edge from the parent node A to its child node D indicates that variable A has a direct influence on variable D. Each edge in the graph is associated with a conditional probability matrix expressing the probability of a child variable given one of its parent variables. For instance, if A= {a0, a1} and D = {d0, d1, d2},
then A → D is assigned the following (3 × 2) conditional probability matrix P(D|A):
P(D|A) = P(D = d0|A = a0) P (D = d0|A = a1) P(D = d1|A = a0) P (D = d1|A = a1) P(D = d2|A = a0) P (D = d2|A = a1) (1) A directed acyclic graph is a Bayesian Network relative to a set of variables {X1, ..., Xn} if the joint distribution
P(X1, ..., Xn) can be expressed as in equation2:
P(X1, ..., Xn) = n
∏
i=1
P(Xi|parents(Xi)) (2)
where parents(X) is the set of nodes such that Y → X is in the graph ∀ Y ∈ parents(X). Because a Bayesian network can completely model the variables and their relationships, it can be used to answer queries about them. Typically, it is used to estimate unknown probabilities for a subset of variables when other variables (the evidence variables) are observed. This process of computing the posterior distribution of variables, given evidence, is called probabilistic inference. In Bayesian networks containing cycles, exact inference is a NP-hard problem. Approximate inference algorithms have been proposed, but their accuracies depend on the network’s structure; therefore, they are not general. By transforming the network into a cycle-free hypergraph, and performing infer-ence in this hypergraph, Lauritzen and Spiegelhalter proposed an exact inference algorithm with relatively low complexity [23]; this algorithm was used in the proposed system.
B. Learning a Bayesian Network from Data
A Bayesian network is defined by a structure and the conditional probability of each node given its parents in that structure (or its prior probability if it does not have any parent). These parameters can be learned automatically from data. Defining the structure consists in finding pairs of nodes(X, Y ) directly dependent, i.e. such that:
• X and Y are not independent (P(X, Y ) 6= P (X)P (Y ))
• There is no node set Z such that X and Y are indepen-dent givenZ (P (X, Y |Z) 6= P (X|Z)P (Y |Z))
Independence and conditional independence can be assessed by mutual information (see equation3) and conditional mutual information (see equation4), respectively.
I(X, Y ) =∑ x,y P(x, y) log P(x, y) P(x)P (y) (3) I(X, Y |Z) = ∑ x,y,z P(x, y, z) log P(x, y|z) P(x|z)P (y|z) (4) Two nodes are independent (resp. conditionally independent) if mutual information (resp. conditional mutual information) is smaller than a given threshold ǫ, 0 ≤ ǫ < 1. Ideally, ǫ should be equal to 0. However, in the presence of noise, some meaningless edges (links) can appear. These edges can also unnecessarily increase the computation time. To avoid this, in this study, ǫ was chosen in advance to be equal to 0.1. This number is independent of dataset cardinality [24].
The structure of the Bayesian network, as well as edge orientation, was obtained by Cheng’s algorithm [24]. This algorithm was chosen for its complexity: complexity is poly-nomial in the number of variables, as opposed to exponential in competing algorithms.
C. Including Images in a Bayesian Network
Contextual information are included as usual in a Bayesian network: a variable with a finite set of states, one for each possible attribute value, is defined for each field.
To include images in a Bayesian network, we first define a variable for each image in the sequence. For each “image variable”, we follow the usual steps of Content-Based Image Retrieval (CBIR) [4]: 1) building a signature for each image (i.e. extracting a feature vector summarizing their digital content), and 2) defining a distance measure between two signatures (see section II-C1). Thus, measuring the distance between two images comes down to measuring the distance between two signatures. Similarly, in a Bayesian network, defining states for an “image variable” comes down to defining states for the signature of the corresponding images. To this aim, similar image signatures are clustered, as described below, and each cluster is associated with a state. Thanks to this process, image signatures can be included in a Bayesian network like any other variable.
1) Image Signature and Distance Measure: in previous works on CBIR, we proposed to extract a signature for images from their wavelet transform [25]. These signatures model the distribution of the wavelet coefficients in each subband of the decomposition; as a consequence they provide
a multiscale description of images. To characterize the wavelet coefficient distribution in a given subband, Wouwer’s work was applied [26]: Wouwer has shown that this distribution can be modeled by a generalized Gaussian function. The maximum likelihood estimators of the wavelet coefficient distribution in each subband are used as a signature. These estimators can be computed directly from wavelet-based compressed images (such as JPEG-2000 compressed images), which can be useful when a large number of images has to be processed. A simplified version of Do’s generalized Gaussian parameter estimation method [27], [25] is proposed in appendix A to reduce computation times. Any wavelet basis can be used to decompose images. However, the effectiveness of the extracted signatures largely depends on the choice of this basis. For this reason, we proposed to search for an optimal wavelet basis [25] within the lifting scheme framework, which is implemented in the compression standards. To compare two signatures, Do proposed the use of the Kullback-Leibler di-vergence between wavelet coefficient distributions P and Q in two subbands [27]: D(P ||Q) = ∫ R p(x) logp(x) q(x)dx (5)
where p and q are the densities of P and Q, respectively. A symmetric version of the Kullback-Leibler divergence was used, since clustering algorithms require (symmetric) distance measures:
1
2(D(P ||Q) + D(Q||P )) (6)
Finally, the distance between two images is defined as a weighted sum of these distances over the subbands, noted W SD; weights are tuned by a genetic algorithm to maximize retrieval performance on the training set [25]. The ability to select a weight vector and a wavelet basis makes this image representation highly tunable. We have shown in previous works the superiority of the proposed image signature, in terms of retrieval performance, over several well-known image signatures [25].
2) Signature Clustering: in order to define several states for an “image variable”, similar images are clustered with an unsupervised classification algorithm, thanks to the image signatures and the associated distance measure above. Any algorithm can be used, provided that the distance measure can be specified. We chose the well-known Fuzzy C-Means algorithm (FCM) [28] and replaced the Euclidean distance by W SD described above. In this algorithm, each document is assigned to each cluster k = 1..K with a fuzzy membership uk, 0 ≤ uk ≤ 1, such that ∑Kk=1uk = 1, which can
be interpreted as a probability. Finding the right number of clusters is generally a difficult problem. However, when each sample has been assigned a class label, mutual information between clusters and class labels can be used to determine the optimal number of clusters ˆK [29] (see equation (7)).
ˆ K= argmax K C ∑ c=1 K ∑ k=1 P(c, k) logC+K P(c, k) P(c)P (k) (7) where c= 1..C are the class labels, P (c, k) is the joint proba-bility distribution function of the class and cluster labels, P(c)
and P(k) are the marginal probability distribution functions. Other continuous variables can be discretized similarly: the age of a person, one-dimensional signals, videos, etc.
D. System Design
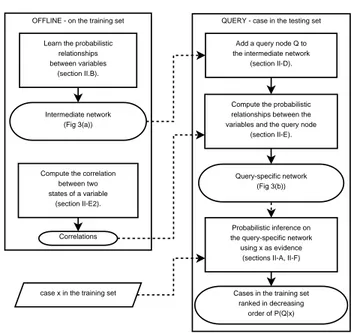
QUERY - case in the testing set OFFLINE - on the training set
Learn the probabilistic relationships between variables
(section II.B).
Compute the correlation between two states of a variable (section II-E2). Intermediate network (Fig 3(a)) Correlations
Compute the probabilistic relationships between the variables and the query node
(section II-E). Add a query node Q to the intermediate network
(section II-D).
Query-specific network (Fig 3(b))
case x in the training set
Probabilistic inference on the query-specific network using x as evidence
(sections II-A, II-F) Cases in the training set
ranked in decreasing order of P(Q|x)
Fig. 2. Bayesian Network based Retrieval. Solid-lined arrows mean “leads to” or “is followed by” and dashed-lined arrows mean “is used by”.
Let xq be a query document and M be the number of
attributes.
Definition: A document x is said to be relevant for xq if x
and xq belong to the same class.
To assess the relevance of each reference document in a database for xq, we define a Bayesian network with the
following variables:
• a set of variables {Ai, i= 1..M }, where Ai represents
the ith attribute of x,
• a Boolean variable Q= “x is relevant for xq” ( ¯Q= “x
is not relevant for xq”).
The design of the system is described hereafter and illustrated in Fig. 2. To build the network, the first step is to learn the different relationships between the attributes {Ai, i= 1..M }.
So, an intermediate network is built from data, using Cheng’s algorithm (see section II-B). In that purpose, the studied database is divided into a training dataset and a test dataset. Cheng’s algorithm is applied to the training dataset. In our experiments, the query document xq belongs to the test dataset
and x belongs to the training dataset. To build this Bayesian network, a finite number of states aij is defined for each
variable Ai, i= 1..M . To learn the relationships between these
variables, we use the membership degree of any document y in the training dataset to each state aij of each variable Ai,
noted αij(y). If Ai is a nominal variable, αij(y) is boolean;
for instance, if y is a male then α“sex′′,“male′′(y) = 1 and α“sex′′,“f emale′′(y) = 0. If Ai is a continuous variable (such as an image-based feature), αik(y) is the fuzzy membership
of y to each cluster k= 1..K (see sectionII-C2). An example of intermediate network is given in Fig. 3 (a).
(a) Intermediate network
(b) Query-specific network
Fig. 3. Retrieval Bayesian Network (built for the database presented in sectionIV-A). In the example of Fig. (b), attributes A1, ..., A6, A8, A10, A13, A14, A15, A17, A18, A22, A23are available for the query document xq, so the associated nodes are then connected to node Q.
Q is then integrated in the network. For retrieval, the attributes of x are observable evidences for Q, as a con-sequence the associated variables should be descendants of Q. In the retrieval network, the probabilistic dependences between Q and each variable Ai depend on xq. In fact, xq
specifies which attributes should be found in the retrieved documents in order to meet the user’s needs. So, when the ith attribute of x
q is available, we connect the two nodes Q
and Ai and we estimate the associated conditional probability
matrix Pq(Ai = aij|Q) according to xq (see Fig. 3 (b)).
The index q denotes that the probability depends on xq. A
query-specific network is obtained: its structure depends on which attributes are available for the query document and the conditional probability matrices depend on the value taken for these available attributes by the query document. This network is used to assess the relevance of any reference document for xq.
E. Computing the Conditional ProbabilitiesPq(Ai= aij|Q)
To compute Pq(Ai= aij|Q), we first estimate Pq(Q|Ai=
aij): the probability that a reference document x, with full
membership to the state aij of attribute Ai, is relevant.
Pq(Ai = aij|Q) can then be computed thanks to Bayes’
theorem (see equation (8)). The prior probability Pq(Q) is
required; it can be estimated by the probability that two documents belong to the same class, i.e. the probability that both documents belong to class 1 or that both documents belong to class 2, etc., hence equation9:
P(A|B) = P(B|A)P (A)
P(B) (8) Pq(Q) = C ∑ c=1 (P (c))2 (9)
where c = 1..C are the class labels (as a consequence the prior probability Pq(Q) is actually independent of xq).
1) Objectives: we want to define Pq(Q|Ai= aij) such that
the posterior probability Pq(Q|x) is as close to 1 as possible
if x and xq belong to the same class, and as close to 0 as
possible otherwise (note that the class label of xqis unknown).
We define the semantic similarity between documents x and xq, with respect to Ai, as follows:
∑
j
∑
k
αij(x)Sijkαik(xq) (10)
where Sikl is the correlation between two states aik and ail
of Ai, regarding the class of the documents at these states.
2) Correlation Between Two States of a Variable: to com-pute Sikl, we first compute the mean membership Dikc(resp.
Dilc) of documents y in a given class c to the state aik(resp.
ail) (y belongs to the training dataset):
{ Dijc= β ∑ y∑δ(y,c)αij(y) yδ(y,c) ∑C c=1(Dijc)2= 1, ∀(i, j) (11) where δ(y, c) = 1 if y is in class c, δ(y, c) = 0 otherwise, and β is a normalizing factor chosen to meet the second relation. Siklis given by equation12:
Sikl= C
∑
c=1
DikcDilc (12)
3) Degree of Match Between x and xq With
Re-spect to Ai: when computing the posterior probability
Pq(Q|x), the Bayesian inference algorithm fuses probabilities
Pq(Q|Ai)P (Ai) coming from each node Ai connected to Q
(see Fig. 3 (b)). In the remainder of this paper, probability dmi(x, xq) = Pq(Q|Ai)P (Ai) is referred to as the degree of
match between x and xq with respect to attribute Ai. This
degree of match can be rewritten as follows: dmi(x, xq) =
∑
j
Pq(Q|Ai= aij)αij(x) (13)
where αij(x), the membership degree of x to the state
aij of Ai, is known or computed by the Bayesian
net-work. Pq(Q|Ai = aij) is chosen proportional to rij =
∑M
k=1αik(xq)Sijk. It implies that dmi(x, xq) is proportional
to the semantic similarity between x and xq (13). As a
con-sequence, the reference documents maximizing the semantic similarity with xq will maximize Pq(Q|x), which was our
objective. Computation details for Pq(Q|Ai = aij) are given
in appendixB.
F. Retrieval Process
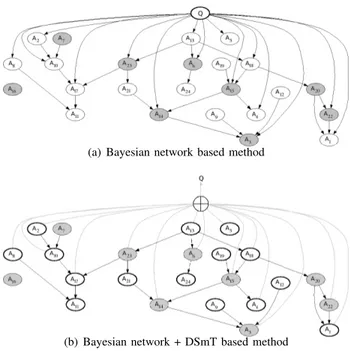
The different reference documents in the database are then processed sequentially. To process a document x, every avail-able attribute for x is processed as evidence and Lauritzen and Spiegelhalter’s inference algorithm is used to compute the posterior probability of each variable, the posterior probability of Q, Pq(Q|x), in particular (see Fig. 4 (a)). The reference
documents in the database are then ranked in decreasing order of the computed posterior probability Pq(Q|x).
(a) Bayesian network based method
(b) Bayesian network + DSmT based method
Fig. 4. Assessing the relevance of a reference document x for the query by the proposed methods. In this example, attributes A6, A7, A14, A15, A16, A20, A22and A23are available for xq. Evidence nodes are colored in gray and target nodes are brightly encircled. In Fig. (b), the fusion system is colored in gray (⊕).
III. BAYESIANNETWORK ANDDEZERT-SMARANDACHE
BASEDRETRIEVAL
A. Description of the Dezert-Smarandache Theory
The Dezert-Smarandache Theory (DSmT) of plausible and paradoxical reasoning, proposed in recent years [17], lets us combine any types of independent sources of information rep-resented in term of belief functions. It generalizes the theory of belief functions (Dempster-Shafer Theory - DST) [30], which itself generalizes the Bayesian theory, used in the system above. DSmT is mainly focused on the fusion of uncertain, highly conflicting and imprecise sources of evidence. Let θ= {θ1, θ2, ...} be a set of hypotheses under consideration
for the fusion problem; θ is called the frame of discern-ment. For our problem, θ = { ¯Q, Q}. In Bayesian theory, a probability P(θi) is assigned to each element θi of the
frame, such that ∑
θi∈θP(θi) = 1. More generally, in DST, a belief mass m(A) is assigned to each element A of the power set2θ={∅, Q, ¯Q, Q∪ ¯Q}, i.e. the set of all composite
propositions built from elements of θ with ∪ operators, such that m(∅) = 0 and ∑
A∈2θm(A) = 1. Belief masses let us express our uncertainty; it is possible for instance to define confidence intervals on probabilities: depending on external circumstances, the probability of Q can range from m(Q) and m(Q) + m(Q ∪ ¯Q). DSmT takes one step further: a (generalized) belief mass m(A) is assigned to each element A of the hyper-power set D(θ) ={∅, Q, ¯Q, Q∩ ¯Q, Q∪ ¯Q}, i.e. the set of all composite propositions built from elements of θ with ∩ and ∪ operators, such that m(∅) = 0 and ∑
A∈D(θ)m(A) = 1.
The belief mass functions mimust be first specified by the user
in our system are described below, in paragraphIII-C). Then, mass functions miare fused into the global mass function mf,
according to a given rule of combination. Another difference between DST and DSmT comes from the underlying rules of combinations. Several rules, designed to better manage conflicts between sources, were proposed in DSmT, including the hybrid rule of combination [17] and the Proportional Conflict Redistribution (PCR) rules [31]. It is possible to introduce constraints in the model [17]: we can specify pairs of incompatible hypotheses(θa, θb), i.e. each subset A of θa∩ θb
must have a null mass, noted A∈ C(θ).
Once the fused mass function mf has been computed, we can
compute the belief (credibility) and the plausibility of each hypothesis A (or any other element of D(θ)) as follows:
Bel(A) = ∑ Bi⊆A,Bi∈D(θ) mf(Bi) (14) P l(A) = ∑ Bi∩A∈C(θ)∪∅,Bi∈D(θ) mf(Bi) = 1 − Bel( ¯A) (15)
Belief and plausibility are respectively pessimistic and opti-mistic. Pignistic probability [32], a possible compromise, is used instead (see below, in paragraphIII-D); other probabilis-tic transformations are available [33].
B. Link with Bayesian Network based Retrieval
Our motivation for using the theory of belief functions, instead of the Bayesian theory, is that the former lets us model our confidence in each source of information, instead of taking each piece of information at face value. This property is partic-ularly attractive for a medical decision support system where heterogeneous sources of information, with varying reliability, are combined. Because its fusion operators better manage conflicting sources of information, a common occurrence when these sources are unreliable, DSmT was used instead of the original theory of belief functions.
In the Bayesian network based method (see section II), the relevance of a reference document for the query, according to a given attribute Ai, has been estimated through the design
of conditional probabilities Pq(Q|Ai = aij). The M sources
of information (represented by the network variables Ai,
i= 1..M ) were then fused by the Bayesian network inference algorithm (see Fig.3(b)) to compute the posterior probability of Q, Pq(Q|x), for a document x in the database. We can
translate this Bayesian fusion problem into the framework of the belief mass theory. Let θ = { ¯Q, Q} be the frame of discernment. For each source i (Ai), we defined (13) a degree
of match dmi(x, xq) between x and the query xq, which may
be viewed as the belief mass mi(Q) assigned to hypothesis Q
and consequently mi( ¯Q)=1−mi(Q) was assigned to ¯Q.
In that first approach, we did not model our confidence in the estimation of the relevance provided by each source of evidence (through the design of conditional probabilities). And poor estimations of the relevance provided by some sources might mislead the computation of the fused estimation. So we would like to give more importance in the fusion process to the trusted sources of evidence. We propose to use DSmT to
model our confidence in each source of evidence, as explained below.
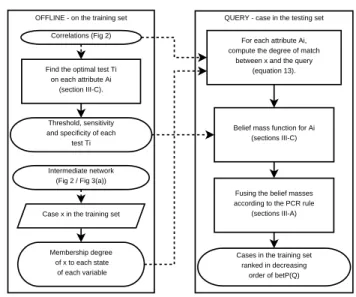
C. System Design
QUERY - case in the testing set OFFLINE - on the training set
Find the optimal test Ti on each attribute Ai
(section III-C).
Intermediate network (Fig 2 / Fig 3(a)) Correlations (Fig 2)
For each attribute Ai, compute the degree of match
between x and the query (equation 13).
Case x in the training set
Belief mass function for Ai (sections III-C)
Cases in the training set ranked in decreasing
order of betP(Q) Threshold, sensitivity
and specificity of each test Ti
Membership degree of x to each state
of each variable
Fusing the belief masses according to the PCR rule
(sections III-A)
Fig. 5. Bayesian Network and Dezert-Smarandache based Retrieval. To extend the previous method in the DSmT framework, we assign a mass not only to Q and ¯Q, but to each element in D(θ) = {∅, Q, ¯Q, Q∩ ¯Q, Q∪ ¯Q}. Assigning a mass to Q∩ ¯Q is meaningless, so we only assign a mass to elements in D(θ) \ Q ∩ ¯Q = {∅, Q, ¯Q, Q∪ ¯Q}
= 2θ (it is actually
Shafer’s model [30]).
To compute the belief masses for a given source of infor-mation i, we defined a test Ti on the degree of match dmi:
Ti(x, xq) is true if dm(x, xq) >= τi, 0 ≤ τi ≤ 1, and false
otherwise. The mass functions are then assigned according to Ti(x, xq): • if Ti(x, xq) is true: – mi(Q) = P (Ti(x, xq)|x is relevant f or xq) (the sensitivity of Ti) – mi(Q ∪ ¯Q) = 1 − mi(Q) – mi( ¯Q) = 0 • else
– mi( ¯Q) = P (Ti(x, xq)|x is not relevant f or xq) (the
specificity of Ti)
– mi(Q ∪ ¯Q) = 1 − mi( ¯Q)
– mi(Q) = 0
The sensitivity (resp. the specificity) represents the degree of confidence in a positive (resp. negative) answer to test Ti; mi(Q ∪ ¯Q) is assigned the degree of uncertainty. The
sensitivity of Ti, for a given threshold τi, is defined as
the percentage of pairs of training documents (y1, y2) from
the same class such that Ti(y1, y2) is true. Similarly, the
specificity of Tiis defined as the percentage of pairs of training
documents(z1, z2) from different classes such that Ti(z1, z2)
is false. Test Ti is relevant if it is both sensitive and specific.
As τi increases, sensitivity increases and specificity decreases.
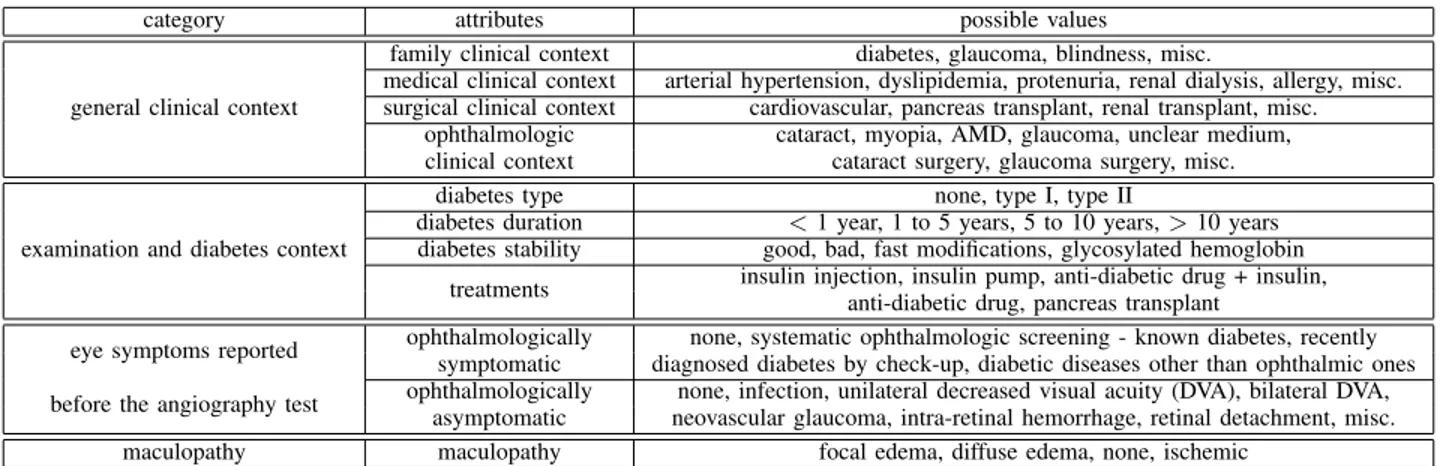
TABLE I
STRUCTURED CONTEXTUAL INFORMATION FOR DIABETIC RETINOPATHY PATIENTS
category attributes possible values
general clinical context
family clinical context diabetes, glaucoma, blindness, misc.
medical clinical context arterial hypertension, dyslipidemia, protenuria, renal dialysis, allergy, misc. surgical clinical context cardiovascular, pancreas transplant, renal transplant, misc.
ophthalmologic cataract, myopia, AMD, glaucoma, unclear medium, clinical context cataract surgery, glaucoma surgery, misc.
examination and diabetes context
diabetes type none, type I, type II
diabetes duration < 1 year, 1 to 5 years, 5 to 10 years, > 10 years diabetes stability good, bad, fast modifications, glycosylated hemoglobin
treatments insulin injection, insulin pump, anti-diabetic drug + insulin, anti-diabetic drug, pancreas transplant
eye symptoms reported ophthalmologically none, systematic ophthalmologic screening - known diabetes, recently symptomatic diagnosed diabetes by check-up, diabetic diseases other than ophthalmic ones before the angiography test ophthalmologically none, infection, unilateral decreased visual acuity (DVA), bilateral DVA,
asymptomatic neovascular glaucoma, intra-retinal hemorrhage, retinal detachment, misc.
maculopathy maculopathy focal edema, diffuse edema, none, ischemic
according to τi” and “specificity according to τi”. A binary
search is used to find the optimal τi.
D. Retrieval Process
To process a reference document x, every available attribute for x is processed as evidence and Lauritzen and Spiegel-halter’s inference algorithm is used to estimate αij(x) ∀j,
i = 1..M . If the ith attribute of x
q is available, the degree
of match dmi(x, xq) is computed according to αij(x) (see
equation 13) and the belief masses are computed according to test Ti(x, xq). The sources available for xq are then fused.
Usual rules of combination have a time complexity exponential in M , which might be a limitation. So we proposed a rule of combination for two-hypotheses problems (Q and ¯Q in our application), adapted from the PCR rules, with a time complexity polynomial in M [34]. Once the sources available for xq are fused by the proposed rule of combination, the
pignistic probability betP(Q) is computed following equation
16.
betP(Q) = mf(Q) +
mf(Q ∪ ¯Q)
2 (16)
The process is illustrated in Fig.4(b) and Fig.5. The reference documents are then ranked in decreasing order of betP(Q).
IV. APPLICATION TOMEDICALIMAGEDATABASES The proposed method has been applied to CADx on two heterogeneous databases. First, it has been applied to diabetic retinopathy severity assessment on a dataset (DRD) built at the Inserm U650 laboratory, in collaboration with ophthalmolo-gists of Brest University Hospital. Then, it has been applied to breast cancer screening on a public access database (DDSM).
A. Diabetic Retinopathy Database (DRD)
The diabetic retinopathy database contains retinal images of diabetic patients, with associated anonymized information on the pathology. Diabetes is a metabolic disorder characterized by sustained inappropriately high blood sugar levels. This progressively affects blood vessels in many organs, which may lead to serious renal, cardiovascular, cerebral and also retinal complications. The latter case, namely diabetic retinopathy,
can lead to blindness. The database consists of 67 patient files containing 1112 photographs altogether. Images have a definition of 1280 pixels/line for 1008 lines/image. They are lossless compressed images. Patients have been recruited at Brest University Hospital (France) since June 2003 and images were acquired by experts using a Topcon Retinal Digital Camera (TRC-50IA) connected to a computer. An image series is given in Fig.6.
(a) (b) (c) (d) (e)
(f) (g) (h) (i) (j)
Fig. 6. Photograph sequence of a patient eye. Images (a), (b) and (c) are photographs obtained with different color filters. Images (d) to (j) constitute a temporal angiographic series: a contrast agent (fluorescein) is injected and photographs are taken at different stages (early (d), intermediate (e)-(i), late (j)). At the intermediate stage, photographs from the periphery of the retina are available.
The contextual information available is the age and sex of the patient, as well as structured medical information (see table
I). Patients records consist of at most 10 images per eye (see Fig. 6) and 13 contextual attributes; 12.1% of these images and 40.5% of these contextual attribute values are missing. The disease severity level, according to ICDRS classification [35], was assessed by a single expert for all 67 patients: because of intra-observer variability, the reference standard is imperfect. The distribution of the disease severity among the above-mentioned 67 patients is given in table II.
B. Digital Database for Screening Mammography (DDSM)
The DDSM project [36], involving the Massachusetts Gen-eral Hospital, the University of South Florida and the San-dia National laboratories, has built a mammographic image database for research on breast cancer screening. It consists of 2277 patient files. Each of them includes two images of
TABLE II
PATIENT DISEASE SEVERITY DISTRIBUTION
database disease severity number of patients
DRD
no apparent diabetic retinopathy 7 mild non-proliferative 9 moderate non-proliferative 22 severe non-proliferative 9 proliferative 9 treated/non active diabetic retinopathy 11
DDSM
normal 695
benign 669
cancer 913
each breast, associated with patient information (age at time of study, subtlety rating for abnormalities, American College of Radiology breast density rating and keyword description of abnormalities) and image information (scanner, spatial resolution, ...). The following contextual attributes are used in this study:
• the age at time of study • the breast density rating
Images have a varying definition, of about 2000 pixels/line for 5000 lines/image. An example of image sequence is given in Fig.7. There is no missing information in DDSM.
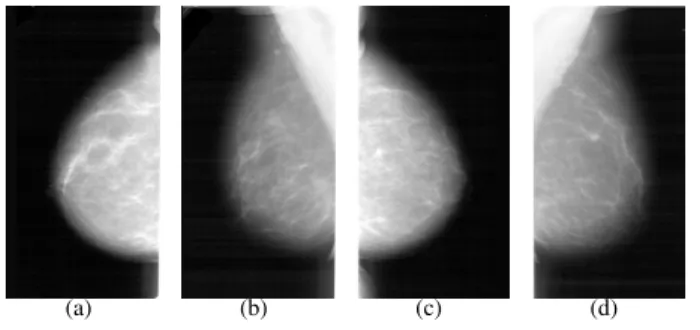
(a) (b) (c) (d)
Fig. 7. Mammographic image sequence of the same patient. (a) and (b) are two views of the left breast, (c) and (d) are two views of the right one.
Each patient file has been graded by a physician. Patients are then classified in three groups: normal, benign and cancer. The distribution of grades among the patients is given in table
II. The reference standard is also affected by intra- and inter-observer variability in this dataset.
C. Objective of the System
Definition: let xq be a query document, and x1, x2, ..., xK
be its K most similar documents within the training set. The precision at K for xq is the fraction of documents, among
{x1, x2, ..., xK}, that belong to the same class as xq.
For each query document, we want to retrieve the most similar reference documents in a given database. Satisfaction of the user’s needs can thus be assessed by the precision at K. The average precision at K measures how good a fusion method is at combining feature-specific distance measures into a semantically meaningful distance measure.
D. Patient File Features
In those databases, each patient file consists of both digital images and contextual information. Contextual attributes (13
in DRD, 2 in DDSM) are processed as-is in the CBR system. Images need to be processed in order to extract relevant digital features. A possible solution is to segment these images and extract domain specific information (such as the number of lesions); for DRD, the number of automatically detected microaneurysms (the most frequent lesion of diabetic retinopa-thy) [37] is used. However, this kind of approach requires expert knowledge and a robust segmentation of images, which is not always possible because of acquisition variability. So, an additional solution to characterize images by their digital content, without segmenting images, is proposed: a feature vector is extracted from the wavelet decomposition of the image [25]. An image signature is computed for each image field in a document (4 in DDSM: RCC, RMLO, LCC, LMLO and 10 in DRD); each image signature is associated with an attribute (see section II-C). In conclusion, there are 24 attributes in DRD and 6 attributes in DDSM.
E. Training and Test Sets
Retrieval performance is assessed as follows. Both datasets are randomly divided into five subsets V1, V2, ..., V5 of equal
size. Each subset Vi, i= 1..5, is used in turn as test set while
the remaining four subsets are used for training the retrieval system. Note that the test set is completely independent from the training process.
F. Results
The number of documents proposed by the system is typically set toK ∈ {5, 10, 20}. Precisions obtained with each fusion method are reported in tableIII. Because the cardinality of each class is small in DRD, performance was expected to decrease as K increases. For both databases, at K = 5, the average precision is greater than 0.8; it means that, on average, more than 80% of the selected documents are relevant for a query. We can see that, on DRD, the use of DSmT increases the average precision at K = 5 by about 10%, but not on DDSM. This can be explained by the the fact that, on DRD, many sources of information are contextual: less reliable similarity measures are derived from these contextual sources (the sensitivity/specificity values of the corresponding tests Ti are lower), hence the interest of DSmT for this database.
To assess the performance of the proposed fusion framework, independently of the underlying image signatures (described in II-C1), it was compared to an early fusion [6] and a late fusion method [8] based on the same image signatures. The results we obtained for these methods are summarized in table
III.
The average computation time to retrieve the five closest documents for the second method is given in tableIV (compu-tation times are similar with the first method). Clearly, most of the time is spent during the computation of image signatures. All experiments were conducted using an AMD Athlon 64-bit based computer running at 2 GHz.
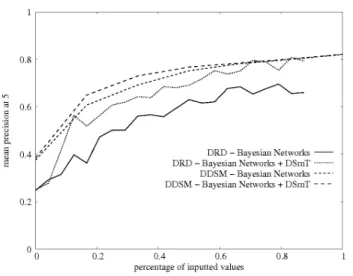
To study the robustness of the method with respect to missing values the following test was carried out:
• for each document xiin the database, 100 new documents
TABLE III
PRECISION OBTAINED WITH DIFFERENT METHODS
Dataset DRD DDSM
Number of retrieved documents (K) 5 10 20 5 10 20
Bayesian network (see sectionII) 0.704±0.168 0.654±0.174 0.551±0.191 0.821±0.177 0.813±0.179 0.798±0.191 Bayesian network + DSmT (see sectionIII) 0.809±0.158 0.693±0.165 0.590±0.180 0.803±0.182 0.801±0.185 0.787±0.188 Bayesian network + DSmT (simplified signature computation) 0.806±0.158 0.693±0.165 0.587±0.180 0.800±0.184 0.799±0.186 0.787±0.189 Bayesian network + DSmT (images only) 0.704±0.176 0.640±0.181 0.529±0.200 0.759±0.192 0.740±0.194 0.725±0.194 Early fusion [6] 0.430±0.207 0.448±0.203 0.432±0.212 0.714±0.193 0.731±0.192 0.718±0.196 Late fusion [8] 0.394±0.210 0.431±0.194 0.427±0.204 0.703±0.192 0.717±0.191 0.700±0.200
TABLE IV
COMPUTATION TIMES FOR THEDSMTBASED METHOD
database DRD DDSM
retrieval (once signatures are computed) 0.37 s 4.67 s
Do’s generalized Gaussian estimation method
computing the signatures (for 1 image) 4.57 s 35.89 s average retrieval time (the average number of images 40.58 s 148.27 s per document is ≃ 9 for DRD and 4 for DDSM)
Simplified generalized Gaussian estimation method — see appendixA
computing the signatures (for 1 image) 0.25 s 2.23 s average retrieval time 2.58 s 13.59 s
attributes available for xi, each new example was
ob-tained by removing a number of attribute values randomly selected in {0, 1, ..., ni}.
• the precision at five obtained for these generated docu-ments, with respect to the number of available attributes, was plotted in Fig.8.
Fig. 8. Robustness with respect to missing values. Note that documents are returned at random when no attributes are available (0 on the x-axis).
Finally, for comparison purposes, the proposed system was applied to abnormal (‘benign’ or ‘cancer’) versus ‘normal’ document classification:
• for each document xiin the database (1364 abnormal and
695 normal), an abnormality index a(xi) was defined;
a(xi) is the percentage of abnormal documents among
the topmostK results (if xibelongs to Vj, then the results
are selected within the database minus Vj),
• the Receiver-Operating Curve (ROC) [38] of a(.) was plotted and the area under this curve, noted Az, was
computed.
An area under the ROC curve of Az= 0.921, Az= 0.917 and
Az = 0.914 was obtained for K = 5, K = 10 and K = 20,
respectively. In comparison, for the task of classifying regions of interest of 512 × 512 pixels (489 malignant masses, 412 benign masses and 919 normal breasts), Mazurowski et al. obtained an area under the ROC curve of Az= 0.907 ± 0.024
using mutual information [38].
V. DISCUSSION ANDCONCLUSIONS
In this paper, we introduced two methods to include image series and their signatures, with contextual information, in a CBR system. The first method uses a Bayesian network to model the relationships between attributes. It allows us to manage missing information, and to fuse several sources of in-formation. In particular, a method to include image signatures in a Bayesian network was proposed. In this first method, we modeled the relevance of a reference document in the database for the query, according to a given attribute Ai, through the
design of conditional probabilities Pq(Ai= aij|Q). The
sec-ond method, based on the Dezert-Smarandache theory, extends the first one by improving the fusion operator: we modeled our confidence in each estimation of the relevance through the design of belief mass functions. These methods have been successfully applied to two medical image databases. These methods are generic: they can be extended to databases containing sound, video, etc. The wavelet transform based signature, presented in section II-C, can be applied to any n-dimensional digital signal, using its n-dimensional wavelet transform (n = 1 for sound, n = 3 for video, etc) [39]. Extending the proposed image signature to n-dimensional wavelet transforms is trivial: characterizing the distribution of wavelet coefficients simply implies iterating over rows, columns, depth (or time), etc., instead of rows and columns for a 2-D image (see appendixA). The proposed methods are also convenient in the sense that they do not need to be retrained each time a new document is included in the database.
The precision at five obtained for DRD (0.809±0.158) is particularly interesting, considering the few examples avail-able, the large number of missing values and the large number of classes taken into account. On this database, the methods outperform usual methods by almost a factor of 2 in terms of precision at 5. The improvement is also noticeable on DDSM (0.821±0.177 compared to 0.714±0.193). The pro-posed retrieval methods are fast: most of the computation time is spent during the image processing steps. The code may be parallelized to decrease computation times further. Moreover, sufficient precision can be reached before all the
attributes are provided by the user. As a consequence, the user can stop formulating his query when the returned results are satisfactory. On DRD for instance, a precision at five of 0.6 can be reached by providing less than 30% of the attributes (see Fig. 8): with this precision, the majority of the retrieved documents (3 out of 5) belong to the right class. Table III
shows that the difference, in terms of retrieval performance, between single image retrieval [25] and heterogeneous docu-ment retrieval, comes from the combination of image features extracted from several images, more than the inclusion of contextual attributes.
This study has three limitations. First, only one type of image feature [25] has been included in the retrieval system (two for DRD [25], [37]). In particular, the inclusion of application-specific image features will have to be validated on several medical image databases. Second, the reference standards are affected by inter- and intra- observer variability, further validation and observer studies are needed. Finally, as it has been shown by Cheng et al., the size of the dataset has an influence on the correctness of the generated Bayesian networks. DRD, in particular, is small compared to the datasets used to validate Bayesian network generation methods [24]. The limited size of the dataset may also impact the performance on the test set, especially ifK is larger than (or is in the order of) the number of cases belonging to some of the classes within the dataset.
As a conclusion, using appropriate information fusion oper-ators, heterogeneous case retrieval in medical digital databases is a powerful tool to build reliable CADx systems. In future works, we will try to improve retrieval performance further through the use of relevance feedback [4] and through the inclusion of localized image features. A web interface, that will permit relevance feedback, is being developed to allow assessment of clinical usefulness by physicians.
APPENDIXA
FASTPARAMETERESTIMATION FORGENERALIZED
GAUSSIANDISTRIBUTIONS
In Do’s parameter estimation method [27], the parameters of the wavelet coefficient distribution in a M× N subband X = {xi,j, i= 1..M, j = 1..N }, namely ˆα and ˆβ, are obtained by
iterating over all coefficients in this subband. For instance,αˆ is obtained as follows: ˆ α= β M N M ∑ i=1 N ∑ j=1 |xi,j|β 1 β (17)
where β is an approximation of ˆβ, which is iteratively refined using the Newton-Raphson procedure [27]. The computation of β relies, for each wavelet coefficient, on multiple eval-uations of the logarithm and the digamma function, which implies slow computations.
We propose to significantly reduce the number of such evalu-ations by applying Do’s estimation method, not directly toX , but to a histogram of X :
1) the standard deviation σ of X is computed,
2) a B-bins histogram of X , restricted to the [−nσ; nσ] interval, is computed (we used B=64 and n=5 — these numbers were chosen to reduce the approximation error on an independent dataset1),
3) let hk be the number of coefficients assigned to the kth
bin, and vk the centroid of that bin
vk= −nσ +(k −12) 2nσ B (18) Equation 17becomes ˆ α= ( β M N B ∑ k=1 hk|vk|β )β1 (19) All other equations in [27] are modified similarly.
APPENDIXB
Pq(Ai= aij|Q): COMPUTATIONDETAILS
For each attribute Ai, i= 1..M , we want Pq(Q|Ai= aij)
to be proportional to rij = ∑Mk=1αik(xq)Sijk (see section
II-E). In that purpose, we first determine pi = Pq(Q|Ai =
aiargmaxj(rij)). Let ˜rij =
rij
maxk(rik). The following constraints have to be satisfied: Pq(Q|Ai = aij) + Pq( ¯Q|Ai= aij) = 1 (20) ∑ j Pq(Q|Ai= aij)P (Ai= aij) = Pq(Q) (21) ∑ j Pq( ¯Q|Ai= aij)P (Ai= aij) = Pq( ¯Q) (22)
where Pq(Q), Pq( ¯Q) and P (Ai= aij) are prior probabilities.
Injecting pi andr˜ij in equation 21, we obtain equation23.
∑
j
pi.˜rij.P(Ai= aij) = Pq(Q), i= 1..M (23)
pi is then extracted from equation23:
pi=
Pq(Q)
∑
jr˜ij.P(Ai = aij)
, i= 1..M (24)
Once piis computed, Pq( ¯Q|Ai= aiargmaxj(rij)) = 1− pican be computed (see equation20). Other conditional probabilities are deduced from the definition of ˜rij : Pq(Q|Ai = aij) =
pi.˜rij.
If the most desirable state for attribute Ai (argmaxj(rij)) is
a rare state, it is possible that pi >1. Indeed, in constraint
21, Pq(Q|Ai= aiargmaxk(rik)) is multiplied by a small value (P(Ai = aiargmaxk(rik))), the result of this product is small and the other terms of the sum (with a value Pq(Q|Ai = aij)
smaller than Pq(Q|Ai = aiargmaxj(rij)) by definition) might be too small for the sum to reach Pq(Q). In that case, the
conditional probabilities should be changed as follows:
• we set pi= 1,
• each ˜rij, j 6= argmaxk(rik), is multiplied by a constant
γ >0.
With this setup, constraint21 becomes equation25. P(Ai= aij) + ∑ j6=argmaxk(rik) γ.˜rij.P(Ai= aij) = Pq(Q) (25) Finally, γ is extracted from equation 26 and conditional probabilities from equation27.
γ= Pq(Q) − P (Ai= aiargmaxj(rij)) ∑
j6=argmaxk(rik)r˜ij.P(Ai = aij)
(26) Pq(Q|Ai= aij) = γ.˜rij, j6= argmaxj(rij) (27)
The inequality Pq(Q) ≥ P (Ai = aiargmaxk(rik)) always holds, as a consequence γ >0. Indeed Pq(Q) ≥ Pq(Q|Ai=
aiargmaxk(rik))P (Ai = aiargmaxk(rik)) (according to con-straint 21), i.e. Pq(Q) ≥ pi.P(Ai = aiargmaxk(rik)); given that pi= 1, the following inequality holds: Pq(Q) ≥ P (Ai=
aiargmaxk(rik)).
REFERENCES
[1] A. Aamodt, “Case-based reasoning: Foundational issues, methodological variations, and system approaches,” AI Communications, vol. 7, no. 1, pp. 39–59, 1994.
[2] I. Bichindaritz and C. Marling, “Case-based reasoning in the health sciences: What’s next?” Artif Intell Med, vol. 36, no. 2, pp. 127–135, 2006.
[3] J.-M. Cauvin, C. le Guillou, B. Solaiman, M. Robaszkiewicz, P. le Beux, and C. Roux, “Computer-assisted diagnosis system in digestive en-doscopy,” IEEE Trans Inf Technol Biomed, vol. 7, no. 4, pp. 256–262, 2003.
[4] A. W. M. Smeulders, M. Worring, S. Santini, A. Gupta, and R. Jain, “Content-based image retrieval at the end of the early years,” IEEE Trans
Pattern Anal Mach Intell, vol. 22, no. 12, pp. 1349–1380, 2000. [5] H. M¨uller, N. Michoux, D. Bandon, and A. Geissbuhler, “A review of
content-based image retrieval systems in medical applications - clinical benefits and future directions,” Int J Med Inform, vol. 73, no. 1, pp. 1–23, 2004.
[6] D. R. Wilson and T. R. Martinez, “Improved heterogeneous distance functions,” J Artif Intell Res, vol. 6, pp. 1–34, 1997.
[7] R. K. Srihari, A. Rao, B. Han, S. Munirathnam, and X. Wu, “A model for multimodal information retrieval,” in IEEE International Conference
on Multimedia and Expo, New York City, NY, USA, 2000, pp. 701–704. [8] R. Nuray and F. Can, “Automatic ranking of information retrieval systems using data fusion,” Inf Process Manag, vol. 42, no. 3, pp. 595– 614, 2006.
[9] S. Wu and S. McClean, “Performance prediction of data fusion for information retrieval,” Inf Process Manag, vol. 42, no. 4, pp. 899–915, 2006.
[10] H. Shao, W.-C. Cui, and H. Zhao, “Medical image retrieval based on visual contents and text information,” in IEEE International Conference
on Systems, Man and Cybernetics, The Hague, The Netherlands, 2004, pp. 1098–1103.
[11] Z. Zhang, R. Zhang, and J. Ohya, “Exploiting the cognitive synergy between different media modalities in multimodal information retrieval,” in IEEE International Conference on Multimedia and Expo, Taipei,
Taiwan, 2004, pp. 2227–2230.
[12] P. Buitelaar, P. Cimiano, A. Frank, M. Hartung, and S. Racioppa, “Ontology-based information extraction and integration from hetero-geneous data sources,” Int J Hum Comput Stud, vol. 66, no. 11, pp. 759–788, 2008.
[13] S. Antani, L. R. Long, and G. R. Thoma, “A biomedical information system for combined content-based retrieval of spine x-ray images and associated text information,” in Proceedings of the Indian Conference on
Computer Vision, Graphics, and Image Processing, Ahmadabad, India, 2002, pp. 242–247.
[14] C. le Bozec, E. Zapletal, M. C. Jaulent, D. Heudes, and P. Degoulet, “Towards content-based image retrieval in a HIS-integrated PACS,” in
Proceedings of the Annual Symposium of the American Society for Medical Informatics, Los Angeles, CA, USA, 2000, pp. 477–481.
[15] E. Chaum, T. P. Karnowski, V. P. Govindasamy, M. Abdelrahman, and K. W. Tobin, “Automated diagnosis of retinopathy by content-based image retrieval,” Retina, vol. 28, no. 10, pp. 1463–1477, 2008. [16] E. Bruno, N. Moenne-Loccoz, and S. Marchand-Maillet, “Design of
multimodal dissimilarity spaces for retrieval of video documents,” IEEE
Trans Pattern Anal Mach Intell, vol. 30, no. 9, pp. 1520–1533, 2008. [17] F. Smarandache and J. Dezert, Advances and Applications of DSmT
for Information Fusion I. American Research Press Rehoboth, 2004, http://fs.gallup.unm.edu/DSmT-book1.pdf.
[18] H. Turtle, “Inference networks for document retrieval,” Ph.D. disserta-tion, University of Massachusetts, MA, USA, 1991.
[19] M. Indrawan, “A framework for information retrieval based on bayesian networks,” Ph.D. dissertation, Monash University, Australia, 1998. [20] C. Wilson, B. Srinivasan, and M. Indrawan, “A general inference
network based architecture for multimedia information retrieval,” in
IEEE International Conference on Multimedia and Expo, New York City, NY, USA, 2000, pp. 347–350.
[21] H. Ghosh, P. Poornachander, A. Mallik, and S. Chaudhury, “Learning ontology for personalized video retrieval,” in International Multimedia
Conference, Augsburg, Germany, 2007, pp. 39–46.
[22] J. Pearl, Probabilistic Reasoning in Intelligent Systems: Networks of
Plausible Inference. Morgan Kaufmann, 1988.
[23] S. L. Lauritzen and D. J. Spiegelhalter, “Local computations with probabilities on graphical structures and their application to expert systems,” J R Stat Soc, vol. 50, no. 2, pp. 157–224, 1988.
[24] J. Cheng, R. Greiner, J. Kelly, D. Bell, and W. Liu, “Learning bayesian networks from data: An information-theory based approach,” Artif Intell, vol. 137, no. 1, pp. 43–90, 2002.
[25] G. Quellec, M. Lamard, G. Cazuguel, B. Cochener, and C. Roux, “Wavelet optimization for content-based image retrieval in medical databases,” Med Image Anal, vol. 14, no. 2, pp. 227–241, 2010. [26] G. van de Wouwer, P. Scheunders, and D. van Dyck, “Statistical texture
characterization from discrete wavelet representations,” IEEE Trans
Image Process, vol. 8, no. 4, pp. 592–598, 1999.
[27] M. N. Do and M. Vetterli, “Wavelet-based texture retrieval using generalized gaussian density and Kullback-Leibler distance,” IEEE Trans
Image Process, vol. 11, no. 2, pp. 146–158, 2002.
[28] J. C. Bezdek, “Fuzzy mathemathics in pattern classification,” Ph.D. dissertation, Cornell University, NY, USA, 1973.
[29] A. Strehl, “Relationship-based clustering and cluster ensembles for high-dimensional data mining,” Ph.D. dissertation, The University of Texas, TX, USA, 2002.
[30] G. Shafer, A Mathematical Theory of Evidence. Princeton University Press, 1976.
[31] F. Smarandache and J. Dezert, Advances and Applications of DSmT
for Information Fusion II. American Research Press Rehoboth, 2006, http://fs.gallup.unm.edu/DSmT-book2.pdf.
[32] P. Smets, “Constructing the pignistic probability function in a context of uncertainty,” in Proceedings of the Fifth Annual Conference on
Uncertainty in Artificial Intelligence, North-Holland, 1990, pp. 29–40. [33] J. Dezert and F. Smarandache, “An introduction to DSmT,” French
Aerospace Research Lab. & University of New Mexico, Tech. Rep., 2009, http://fs.gallup.unm.edu/IntroductionToDSmT.pdf.
[34] G. Quellec, “Indexation et fusion multimodale pour la recherche d’information par le contenu. application aux bases de donn´ees d’images m´edicales.” Ph.D. dissertation, TELECOM Bretagne, France, 2008. [35] C. Wilkinson, F. Ferris, R. Klein, and al., “Proposed international clinical
diabetic retinopathy and diabetic macular edema disease severity scales,”
Ophthalmology, vol. 110, no. 9, pp. 1677–1682, 2003.
[36] M. Heath, K. Bowyer, D. Kopans, R. Moore, and W. P. Kegelmeyer, “The digital database for screening mammography,” in Proceedings of
the Fifth International Workshop on Digital Mammography, Toronto, Canada, 2000, pp. 212–218.
[37] G. Quellec, M. Lamard, P. M. Josselin, G. Cazuguel, B. Cochener, and C. Roux, “Optimal wavelet transform for the detection of microa-neurysms in retina photographs,” IEEE Trans Med Imaging, vol. 27, no. 9, pp. 1230–1241, 2008.
[38] M. A. Mazurowski, P. A. Habas, J. M. Zurada, and G. D. Tourassi, “Decision optimization of case-based computer-aided decision systems using genetic algorithms with application to mammography,” Phys Med
Biol, vol. 53, no. 4, pp. 895–908, February 2008.
[39] G. Quellec, M. Lamard, G. Cazuguel, B. Cochener, and C. Roux, “Adaptive nonseparable wavelet transform via lifting and its application to content-based image retrieval,” IEEE Trans Image Process, vol. 19, no. 1, pp. 25–35, January 2010.