The Application of Prediction Markets to Business
by
Jared M. Schrieber
B.S., Supply Chain Management (1998) Arizona State University
Submitted to the Engineering Systems Division in Partial Fulfillment of the Requirements for the Degree of
Master of Engineering in Logistics at the
Massachusetts Institute of Technology June 2004
c 2004 Jared Schrieber. All rights reserved.
The author hereby grants to MIT permission to reproduce and to distribute publicly paper and electronic copies of this thesis document in whole or in part.
Signature of Autho. ...
Engineering Systems Division May 7 th, 2004 C ertified b y ... ... ... ... Abbott Weiss Senior Lecturer Thesis Supervisor A ccep ted b y ... ... // Yossi Sheffi
Director, MIT Center or Transportation & Logistics
BARKER
MASSACHUSETTS INSTiTjTE OF TECHNOLOGY
JUL
2
7 2004
The Application of Prediction Markets to Business
by
Jared M. Schrieber
Submitted to the Engineering Systems Division on May 7th, 2004 in Partial Fulfillment of the
Requirements for the Degree of Master of Engineering in Logistics
ABSTRACT
According to financial theory, open markets efficiently and effectively aggregate all available information about future events into their prices. Recent empirical evidence has shown that speculative markets, from gambling to web-games, are better at predicting the future than more commonly used statistical or survey-based forecasting methods. As a result, a number of companies have conducted experiments to evaluate the use of
prediction markets as an alternative forecasting methodology. This paper offers a
comprehensive framework for determining when and how prediction markets should be employed in a business context.
Thesis Supervisor: Abbott Weiss
Title: Senior Lecturer, Engineering Systems Division
Table of Contents
1. Introduction ... 4
2. Literature Review ... 8
2.1 Financial Markets & Economic Theory ... 8
2.2 Gambling & Betting Markets ... 9
2.3 Idea Futures & Web Games ... 10
2.4 Business A pplications ... 12
3. Benefits of Prediction Markets ... 15
3.1 A ccuracy ... 15
3.2 Im m ediacy ... 15
3 .3 In sight ... .. 16
3.4 Scalability ... 17
3.5 Incentives ... 17
4. Prediction Market Implementation ... 19
4.1 Guidelines for When to Use a Prediction Market ... 19
4.2 Considerations for Prediction Market Design ... 22
4.2a Forecast Objectives ... 23
4.2b Participation ... 24
4.2c Trading Mechanisms ... 27
4.2d C laim Structure ... 28
4.2e Claim D efinition ... 32
4.2f Incentives ... 37
4.2g Account Balances ... 38
4.2h Trading Interface ... 39
5. Applications Beyond Forecasting ... 41
5.1 Resource Allocation ... 41
5.2 R isk H edging ... 43
6. C onclusion ... 45 7. B ibliography ... 4 7
Acknowledgements
I would like to acknowledge the generous support and guidance of Dr. Abbott Weiss and my wife, Reka Cseresnyes. This has been a truly rewarding experience. Thank you both.
1. Introduction
Businesses rely on forecasts, whether formal or informal, to guide almost every important decision they make. Expectations related to revenue, margins, unit demand, capacity requirements, production yields, material prices, project budgets and timelines,
competitor actions and customer behaviors are what drive corporate behavior. A single demand forecast alone may be used to drive important decisions throughout a company, including: sales quotas, marketing budgets, materials procurement contracts, production levels and factory hiring, capital investment for manufacturing capacity, and more. However, a recent survey of nearly 250 senior financial executives reported that 'difficulty accurately forecasting demand' was by-far the most common, significant problem within their companies' supply chains (CFO Research Services, 2003). It seems that no matter how much time and effort goes into predicting the future, it is practically assured that the prediction will still be wrong.
Given that accurate expectations about the future are critical to the successful
management of a business, and knowing that those expectations will invariably err to some degree, companies must strive to find efficient methods for the systemic
improvement of their predictive abilities. Simply removing a single percentage point of error from a demand forecast can add millions of dollars to a company's bottom-line (Kahn, 2003). In the extreme case of Cisco, poor demand forecasting resulted in a single-quarter loss of $2 billion when the resulting excess inventory had to be written-off.
In order to improve forecasting methods, we must first evaluate the limitations of approaches most-commonly employed in businesses today. There are two broad categories of forecasting methods used in business today: statistical approaches and survey-like methods. Statistical forecasts apply algorithms to transform predefined data into predictions, while survey-like methods generate forecasts from human opinions (Spann and Skiera, 2003). A primary difficulty in using such methods is the time they require to incorporate new information into a forecast. Most statistical models, such as time-series, regression, and multivariate approaches, have strict limitations regarding the timing and types of information they can assimilate. Once the inputs to these models are
C 2004 Jared Schrieber, schrieber(alum.mit.edu 4
determined, the resulting forecasts are based upon a narrow set of assumptions about why the future will behave like the past. This is a primary reason why people tend to add their own judgments to statistically-based forecasts before making decisions. While humans are more adept at assimilating new information from a multitude of sources at any time, it is quite challenging to create a single forecast from the opinions of group members. This
task is often time-consuming and highly prone to biases caused by wishful thinking, politicized viewpoints, dominant personalities, and the influence of powerful members. Techniques used to generate forecasts from peoples' opinions include committees, surveys and Delphi analysis. Although these methods are theoretically capable of providing forecasts that represent the average participant's viewpoint, this is quite different than a true consensus that appropriately weights the knowledge and conviction of all informed individuals.
The recent development ofprediction marketsI offers a promising new approach to forecasting. These speculative markets allow informed individuals to trade shares of claims (stocks) about the future. For example, a sample claim might state that, "Demand for Product A will fall between 1,000 and 1,499 units in Q3 of this year." If the claim proves to be true, then the claim pays $1, else it pays nothing. When the claim trades at a price of 30-cents, then the market is said to believe that there is a 30% chance that the claim will hold true. Of course, the person who bought shares of the claim at 30-cents believes that there is at least a 30% chance that the claim is true. The person that sold the claim believes that there is less than a 30% chance that the claim will become true. The number of shares exchanged in the transaction serves as an indicator of the relative confidence that these traders have in their opinions. Non-action from other traders thus represents a lack of significant dissent regarding the claim's value (forecast) and
demonstrates that the market has reached a consensus. The hypothesis that such markets have remarkable predictive powers is more than mere conjecture; it is well founded in economic theory, laboratory research and empirical studies.
1 In the literature, there is no common name used to describe what this paper will refer to as 'prediction markets'. Alternative names with similar meanings include: idea futures, idea stocks, artificial markets, decision markets, forecasting markets, information markets, information aggregation mechanisms, virtual stock markets, and even web-games.
Prediction markets have been proven to offer Simple Newsvendor Problem
more than just accurate forecasts however. USA News Inc. sells its daily newspaper for $1.00 although each copy only costs They have demonstrated an ability to support $0.35 to print and distribute. If its demand
forecasts for almost any future event, quickly forecast for tomorrow's paper is 100,000, how many copies should USA News print? aggregate input from any number of sources,
The answer depends on the level of continuously update their predictions, and uncertainty in the forecast. Because these provide insight into the future's variability. A newspapers have a gross margin percentage of 65%, USA News can
simple newsvendor problem2 demonstrates the achieve optimal profits by printing enough value of understanding the uncertainty within copies to fully support 65% of all possibledemand scenarios. a forecast (see sidebar), yet most businesses
base their most important decisions on a . Demand Variability
single 'best guess' (or 'best case') point- (
0
-estimate, failing to quantify and plan for
uncertainty. Fisher et al (1994) argue that a 00k Print Qty probabilistic model should underlie all supply
As demand vaniability increases, so does chain plans: "Contrary to what many believe, the optimal print quantity for USA News. m ." ,This is because the cost of lost-sales market uncertainty is a manageable risk." exceeds the cost of excess inventory for When used properly, the probability these high-margin papers. If USA News
were to only print the 100,000 copies in its distributions created by prediction markets demand forecast, it would experience some fundamentally change critical decision making level of stock-outs 50% of the time. This would result in lower revenue, reduced processes by guiding informed decision profits and the potential for lost customers.
making in the face of uncertainty.
The objective of this thesis is to look beyond the questions of 'if and 'why' prediction markets should be used in business and address the subsequent issues concerning 'when' and 'how' prediction markets should be deployed in a business context. Section 2, Literature Review, provides a comprehensive history of prediction markets from their roots in financial theory through the lessons learned from recent experiments in business
2 For a more thorough understanding of the newsvendor problem and the mathematics behind it, see:
http-//www.msb.edu/faculty/bios/schmidt/newvendor.pdf
6 2004 Jared Schrieber, schrieber(alalum.mit.edu 6
forecasting. Section 3, Benefits of Prediction Markets, draws upon both theory and empirical evidence to identify five distinct benefits of prediction markets over alternative forecasting methods. Section 4, Prediction Market Implementation, provides a
framework for evaluating when a prediction market should be employed and a detailed analysis of the considerations for optimal market design in support of forecast-based decisions. Section 5, Applications Beyond Forecasting, proposes some additional uses for internal markets such as resource allocation and risk hedging. Section 6, Conclusions, summarizes some of the key findings presented in this thesis and offers some ideas for areas of further research.
Those interested in only a high-level understanding of prediction markets may find the following sections sufficient:
Section 2.1 -Financial Markets & Economic Theory; Section 2.4 -Business Applications;
Section 3 -Benefits of Prediction Markets;
Section 4.1 -Guidelines for When to Use a Prediction Market; Section 4.2d -Claim Structure;
Section 5.1 -Resource Allocation; and, Section 6 -Conclusion.
2. Literature Review
The roots of prediction markets can be found in two distinct fields: financial markets and gambling. Only recently have the lines between these practices blurred as speculative, prediction markets take on the form of web games, betting exchanges, and corporate forecasting tools.
2.1 Financial Markets & Economic Theory
In 1945, Friedrich Hayek first suggested that open markets efficiently and effectively facilitate the aggregation and transmission of information through prices (Hayek 1945). Twenty years later, Eugene Fama offered the efficient market hypothesis which states that an efficient market continuously reflects all available information about future events into security prices (Fama, 1965). This implies that security prices reflect their true expected value and that no additional, available information can be combined with efficient market prices to improve the market's forecast accuracy. Vernon Smith
demonstrated that people behave rationally in experimental markets, and was awarded the 2003 Nobel Prize in Economics for using experimental markets to prove and refine important theories about market behavior.
In 1972, Richard Sandor introduced the concepts of financial (interest rate) futures and weather futures (Pomerantz, 2003). Although futures trading for tangible commodities had long existed, the idea of trading the 'untangible' was foreign to the financial
community. These ideas have been remarkable successes, with over 200 million interest rate futures trades taking place each year and weather-derivatives trade approaching $16 billion per annum. In fact, the weather futures market has even proven to be a valuable tool in the forecasting of weather (Kulkarni, 2003). In addition, guidelines for the trade
of sulphur dioxide pollution credits (futures) were included in the 1990 Clean Air Act and are widely credited for the legislation's success. This demonstrates that a carefully
structured futures market can be a powerful tool to motivate desirable behaviors from otherwise disinterested parties.
80 2004 Jared Schrieber, schrieber&alum.mit.edu 8
Economic theory also explains three primary sources from which contingent commodities (claims that pay out depending on the outcome of an uncertain future event) derive social utility. They allow for efficient risk sharing and pooling, quickly assimilate information useful in making predictions, and can be enjoyable to trade as in the case of gambling (Wolfers and Zitzewitz, 2003).
2.2 Gambling & Betting Markets
While gambling has existed for centuries, only recently has published research appeared related to the predictive accuracy of betting markets. In 1971, Winkler found that published book-maker point spreads significantly outperformed a set of students and professors in predicting the outcomes of football games (Winkler, 1971). He also found that a weighted-average consensus of the students and professors had strong predictive abilities, although it was still outperformed by the point spreads from the bookies (which represent the consensus from a large betting market). Winkler also discovered that the use of scoring rules and wagers in his study caused participants to carefully assess their performance and decision making process. Finally, Winkler concluded that the use of real-money wagers drove higher participant interest levels and superior performance than simple scoring rules.
An in depth study of the predictive power of Nevada's NFL betting market found that the market outperformed newspaper sports editors, power scores based on probit regressions, and other forecasting methods in the prediction of game outcomes (Boulier and Stekler, 2001). In addition, research indicates that changes in published point-spreads greatly improve the likelihood that the betting market will accurately predict a game's outcome (Gandar et al, 1998). This demonstrates that changes in market sentiment reflect valuable information that usually leads to improved forecasts. Finally, there have been a number of papers that evaluate whether or not various betting markets are truly efficient.
Although a number of anomalies have been discovered, the vast majority of them have already been disproved and the general consensus is that most betting markets are truly efficient.
2.3 Idea Futures & Web Games
The historical line between betting markets and financial futures blurred when Robin Hanson introduced the concept of 'idea futures' in 1988 (Hanson, 1996).
"Such markets pool the information that is known to diverse individuals into a common resource, and have many advantages over standard institutions for information aggregation, such as news media, peer review, trials, and opinion polls. Speculative markets are decentralized and relatively egalitarian, and can offer direct, concise, timely, and precise estimates in answer to questions we pose. These estimates are self-consistent across a wide range of issues and respond quickly to new information. They also seem to be cheap and relatively accurate." (Hanson, 1999)
The first web-based artificial market, Idea Futures, covering science, math and
miscellaneous other categories was implemented in 1994 (Kittlitz, 1999). It was the first trading system on the internet, although it only used play-money. Over the last several years, the market (now called the Foresight Exchange) has been proven to accurately predict events as often as it would expect to. For example, when evaluating all trades made at a price of .75 (out of 1.00), one finds them to pay-out roughly 75% of the time. However, a 'favorite-longshot bias' did appear, such that events with just a 1% chance of
occurring were usually traded at higher values. One explanation for this is that such low prices afford players with contrary opinions the ability to easily influence the consensus
market price without much capital or risk. Ken Kittlitz, who administers the Foresight Exchange, has also found that the market rapidly incorporates new information into its prices. Finally, he has found that the claims attracting the greatest trading interest are usually the least ambiguous to judge (e.g., George W. Bush will be President of the
United States of America on February 1s, 2005).
The use of markets to forecast the outcome of election results is quite common. For example, the Iowa Electronic Market has consistently outperformed traditional polls and expert opinions in predicting election results (Feder, 2002). In addition, this market has employed more complex claim structures that allow for greater insights into participant beliefs. It has been argued that Republican delegates using the Iowa Electronic Market as
10 2004 Jared Schrieber, schrieber(alum.mit.edu 10
a guide should have known that Dole would not defeat Clinton in the 1996 presidential election, but that selecting Colin Powell instead may have turned the odds in their favor (Berg and Rietz, 2003).
In 2001, Pennock et al found that the forecasts of play-money markets such as the Hollywood Stock Exchange, the Foresight Exchange, and the Formula One Pick Six competition were generally more reliable than those of other sources, including expert opinion (Pennock et al, 2001). In their report, the authors stated, "The games themselves appear to serve as a mechanism for collecting, merging, and cleaning data from human experts, naturally handling some of the more difficult steps in a typical data mining application."
Research from these web-games also indicates that markets with fewer traders and/or lower financial incentives tend to incorporate new information a little more slowly than their larger counterparts (Wolfers and Zitzewitz, 2003). Wolfers and Zitzewitz also demonstrated that lower volume exchanges tend to exhibit a 'favorite-longshot bias' more than higher volume markets. Speculative bubbles, however, appear to be less likely in prediction markets because informed participants generally have sufficient leverage to keep prices in-check. Although attempts to manipulate market prices have occurred in these markets, their impact has been insignificant and the duration of their impact was
quite short. The research of Wolfers and Zitzewitz also indicates that the performance of prediction markets versus the average (consensus) of a large group of expert forecasters is often quite similar. In such cases the prediction markets add value by more accurately quantifying the uncertainty in the forecast (e.g., standard error or the shape of probability distribution curve).
The previously mentioned Hollywood Stock Exchange is more than just a web game, it is one of the movie industry's most trusted predictors of how new films will perform at the box office. Nearly 1-million registered users actively trade 'movie-stocks' and 'star-bonds' using play-money. Summarized data generated by their trades is then sold to entertainment companies seeking to understand public opinion and forecast revenues for
their upcoming movies (Feder, 2002). In addition, a number of pharmaceutical
companies have recently turned to public web-games (NewsFutures.com) as an attempt to predict demand for their drugs. Although the jury is still out on the results of this
experiment, there are several examples where prediction markets have been used successfully in industry.
2.4 Business Applications
In 1997, Gerhard Ortner developed and administered a prediction market used by
Siemens to predict a large software project's completion date (Ortner, 1998). The project had roughly 200 employees involved over a 6 month period. The prediction market included 60 participants wagering 100 Austrian Schillings (ATS) of their own money (although they were guaranteed 200 ATS for participating). Although most of the participants were unfamiliar with trading stocks in real-life, they were able to learn with little effort and became active traders early in the life of the market.
Throughout the project, claim prices quickly adjusted to reflect new information (prior to the public announcement of that information), thus achieving one of the goals of the prediction market: to encourage immediate sharing of information that may impact the project's deadline. Almost 3-months before the scheduled deadline, the claim designed to predict the project's actual completion date had already predicted the 2-week delay that would inevitably occur. One month prior to the project's final due-date, the price of
'on-time' contracts fell to almost zero, although the management team still saw on-time completion as feasible based on their traditional planning methods. The study also found that the vast majority of orders were placed during break-times, and were not seen to have impacted productivity in any way. Although half of the traders lost-money in the market, almost 90% of them stated that they would participate again.
From 1996 to 1999, Kay-Yut Chen and Charles Plott administered prediction markets at Hewlett Packard on twelve occasions in order to predict the sales volume (dollars and/or units) of printers three months in advance (Chen and Plott, 2002). Participation was limited to marketing and finance, with the exception of a few uninformed traders from
C 2004 Jared Schrieber, schrieber(&,alum.mit.edu 12
HP Labs used to add liquidity. Each time, the market was open to between 7 and 24 participants during lunch and after-work-hours. Trading was done with apparently nominal amounts of real-money, fully subsidized by the company.
The prediction markets outperformed HP's official forecast 75% of the time and had a significantly lower absolute percent error, even though the markets' predictions were known prior to when the official forecasts were made. Since the prediction markets offered a complete set of claims that were related to specified ranges of demand (e.g.
-Claim A is used for demand less than or equal to 1000, -Claim B for demand between 1000 and 2000, and etc.), they provided additional information beyond a point-estimate. The result was an accurate representation of the probability distributions surrounding each forecast, which would likely be of significant benefit to individuals responsible for materials procurement, production capacity or inventory planning. In fact, it is known that HP secured materials from its suppliers at a lower cost than competitor Compaq simply because HP had a better ability to forecast and quantify the risk of demand fluctuations (CFO Research Services, 2003).
In 2001, a large German telecommunications company experimented with a prediction market to forecast demand for five of its services. The market was found to be more accurate than the four statistical methods it was compared against, as well as the consensus of an expert panel (Spann and Skiera, 2003). The study had 20 participants (12 of which traded actively) from the marketing and planning departments trading claims for each of the five services. The market used play-money and the only
remuneration was a $500 mobile-phone set to be given the single trader with the highest final account balance.
In 1999 and 2000, three experiments were run to test a prediction market's ability to be used as a market research tool, in place of traditional mechanisms such as surveys, focus groups and conjoint analysis (Chan et al, 2002). Participants in the experiment bought
and sold shares of up to 10 comparable product concepts (e.g., different types of bike pumps) based on their perceived value of each product. Some of the products were real,
while others were truly just concepts; and, the price of one product was fixed to help anchor the value of the market's currency. The relative product share prices proved to be consistent with the product preference results achieved by conventional methods.
(However, no tests were performed to determine which method actually did the best job of predicting end-consumer preferences.) While more research is required, there is great promise for the use of prediction markets to remove time, costs and bias from market research efforts.
C 2004 Jared Schrieber, schrieber( alum.mit.edu 14
3. Benefits of Prediction Markets
As alluded to in the above literature review, prediction markets offer distinct benefits over alternative forecasting methods used by businesses today. This section describes how prediction markets derive their value in terms of accuracy, immediacy, insight, scalability and incentives.
3.1 Accuracy
Economic theory suggests efficient market prices are the best possible predictors of future events. Laboratory experiments have demonstrated that prediction markets tend to perform just as well as the single best individual (Chen, 2004), without requiring
knowledge of who that individual is in advance. In practice, prediction markets have already been proven to outperform common forecasting practices such as polls, expert surveys, advanced statistical methods and hybrid techniques that allow experts to apply judgment to statistically-based forecasts. Such markets are not limited by the source or
type of information they can aggregate and are capable of performing best under difficult circumstances, such as when bits of relevant information are highly dispersed among participants.
Prediction markets automatically penalize inaccurate forecasters through the depletion of account balances when they are wrong. The resulting changes in account balances give a capital advantage to proven forecasters that can be used to exert more influence over market prices. The natural allocation of forecasting weight, combined with participant anonymity, makes prediction markets particularly adept at removing bias by preventing dominant personalities or powerful individuals from consistently influencing consensus-based forecasts in the wrong direction.
3.2 Immediacy
Prediction markets continuously reflect the knowledge of their participants and quickly assimilate new information as it becomes available. In prediction markets, people are rewarded for quickly applying accurate 'insider' information in the form of trades. As a result, market-based forecasts do not have to wait for the next reporting cycle, staff
meeting or committee approval to reflect important information. Even 'bad-news' is immediately shared in such markets because anonymous participation bypasses the potential for stigmas and other negative repercussions.
Since prediction markets are capable of quickly assimilating new information into prices, it stands to reason that the market will continuously reflect the best possible prediction of the future. If business processes are engineered to take advantage of continuous
forecasts, companies can be assured that they are always making decisions based upon the best possible information. Imagine a manufacturer that uses a monthly forecast to determine its production schedule. If the business environment changes between when an official forecast is published and production for a given product occurs, then a
prediction market could enable the factory to respond appropriately, and with confidence.
3.3 Insight
There will always be error in forecasts. Therefore, every organization should understand the risks inherent within each forecast and make informed decisions that proactively mitigate the consequences of likely deviations. Beyond point forecasts (e.g., Demand in Q2 is expected to be 1250 units), prediction markets can provide valuable insights into risk through variances and the shape of probability distributions. When tied to demand forecasts, such information can be critical to those responsible for supplier contracts, manufacturing capacity and inventory planning.
Prediction markets provide managers with additional insights as well. For example, a market allows them to easily assess how much impact the introduction of particular information has on a forecast. If new information is released to market participants and the price for a given claim (stock) jumps by 20%, then one can infer the importance that such information has on the expected outcome. Managers could then focus their efforts on improving processes that would yield such important information as early as possible. In addition, account balances (or percent of correct trades) can be used to identify which individuals or organizations have the most relevant information regarding a particular
C 2004 Jared Schrieber, schrieber(&alum.mit.edu
forecast or set of forecasts. This may lead managers to reengineer decision making processes to allow for more input from these proven experts.
3.4 Scalability
Most forecasting processes employed by businesses today lack the ability to efficiently adapt to changes in the type and sources of new information. Prediction markets are capable of transforming practically limitless amounts of qualitative information into accurate, quantitative assessments of the future. Unlike their traditional alternatives, these markets continue to operate efficiently as the number of inputs and/or participants increases. (In fact, prediction markets generally function better with more participants and higher trading volume.) Thanks to the internet, prediction markets also have the ability to aggregate information at any time, from any place. This enables large,
multinational corporations to give all informed employees the opportunity to contribute to a collaborative forecasting process. The addition of participants from additional organizations and/or lower levels of responsibility is likely to improve forecast accuracy while transforming these people into valued forecast contributors and stakeholders.
3.5 Incentives
A primary reason for the superior performance of prediction markets is that they have built-in feedback mechanisms and incentive structures. The potential for rewards and losses (either intrinsic or extrinsic) based on forecasting performance has a number of positive effects on the forecasting process:
* Rewards those who share information through trades that lead to accurate predictions;
* Motivates people to share relevant information in a timely manner; * Dampens personal and political motives for withholding information; * Attracts informed individuals to participate in the forecasting process, while
discouraging those that have bad information or intuition;
" Encourages people to carefully evaluate their decision making processes; * Drives participants to find new ways of obtaining useful information; and, " Forces individuals to honestly assess the confidence they have in their opinion.
In addition, a company can easily adjust a market's compensation mechanisms to encourage more or less diligence in the forecasting process. For example, forecasts that are more important to the company's performance may have higher remuneration attached to successful predictions. This in turn, would drive participants to focus more attention to gathering and applying information towards particular claims, naturally reprioritizing their relative efforts.
10 2004 Jared Schrieber, schrieber(&,alum.mit.edu
4. Prediction Market Implementation
The question surrounding prediction markets is no longer whether they can add value in a corporate setting, but should be: "When and how should prediction markets be used in business?"
4.1 Guidelines for When to Use a Prediction Market
Determining when a prediction market can add value over alternative forecasting
methods first requires one to consider how any forecast derives its value. The following formula is offered as a tool for gaining insight into this question:
Forecast Value = Importance * Quality * Acceptance Effort
Importance relates to the business impact of decisions and actions that are influenced by
the forecast. The quality of a forecast is derived from the degree of accuracy and the usefulness of information provided to the forecast's users. (e.g., A point-estimate is of lower quality than a probability distribution in forecasting demand.) Acceptance measures the extent to which the forecast is used in the decision making process. If a manager looks at a forecast, and then applies additional judgment before taking action, the forecast is not fully accepted. More importantly, if a number of managers in different departments each apply their own judgments before making decisions, then a forecast's acceptance is quite low. In addition, a forecast that is not timely may not be accepted at all, and could reduce the overall forecast value to zero. Finally, effort is a reflection of the amount of resources (people, time and money) invested in formulating a forecast.
Although the importance of a forecast does not change depending on the forecasting method employed, the above formula implies that quality and acceptance have a greater impact on the value of important decisions than less important ones. This is quite
intuitive in practice and explains why greater effort is generally exerted on improving the quality and acceptance of the most important forecasts. Thus, the use of appropriate forecasting methodologies for various tasks can help optimize the use of scarce resources
to maximize forecast value. The diagram below depicts one method of identifying the general forecasting technique that is most appropriate for a particular decision making problem. Effort Required Iortance We of Quality Strveys
Under this depiction, prediction markets add the most value when:
* high levels of effort are required to aggregate predictive inputs; and/or, * the impending decisions are highly sensitive to the quality of the information
taken from the forecast; and/or,
* there is high risk of biased decision making and/or the need to make decisions prior to an updated and approved forecast becoming available.
It is important to note that the use of survey methods does not preclude the use of statistical methods in deriving a particular forecast, just as the use of prediction markets does not exclude people from trading based on statistical analysis or expert judgment. In addition, many experts who participate in survey-type forecasting actually derive their knowledge from underlying statistical models and analysis. A prediction market that
2 2004 Jared Schrieber, schrieber(alum.mit.edu
ImpArtance of
Acceptance
provides meaningful incentives to its participants will actually encourage the use of these other techniques to justify informed trading decisions.
Another framework for considering when to use a prediction market over other forecasting methods is shown below.
Sensitivity
stat
Complexity Uncertainty
In this diagram, prediction markets are best applied in situations where:
" there are a number of significantly different actions that can be taken depending on the specific value(s) of the forecast (e.g, capacity expansions to support demand through new processes, shifts, equipment, lines or factories); and/or, " the complexity of inputs that could influence a forecast or decision making
process make it cumbersome to aggregate the information in a meaningful and timely manner (e.g., impacts of regional promotions and competitor pricing on
aggregate demand for CPG products); and/or,
* history is unlikely to repeat itself and expectations regarding potential outcomes may vary greatly as new information becomes available (e.g., new product introductions).
As stated above, the complexity of aggregating forecast information and the effort required to generate a meaningful forecast are important indicators of when a prediction market may be of significant value. However, prediction markets also require that useful information be dispersed across a number of informed
individuals. If a very small number of people have a major informational advantage over other market participants, the
prediction market is likely to fail. For example, if two sales # of Participants representatives support clients that represent the vast majority of a company's demand, then their insider knowledge could discourage others from trading claims used for
demand forecasting. In this case, a survey-based method is probably a better approach to forecasting.
The number of tradable claims per participant is just as important as the number of participants. Since each participant is likely to focus their trading on just a few claims, this effectively reduces the number of participants contributing their knowledge to the accuracy of each claim's price. Although there is no empirical evidence that quantifies the effects of having too few traders and/or too many claims, most authors recommend at
least five informed participants per claim (or claim-set).
4.2 Considerations for Prediction Market Design
Once the decision to implement a prediction market is made, it is important to consider a number of design variables that can impact the type and quality of information revealed
by the market. We have already seen how important the natures of the decisions being made from a forecast are to determining the appropriate methodology. This
understanding is doubly important when actually designing a prediction market. While the work of Hanson (1999), Spann and Skiera (2003), and Wolfers and Zitzewitz (2003) offer some guidelines for market design, this section offers a more comprehensive and detailed framework. Specifically, this section offers an in-depth analysis of the key considerations involving the following design elements: Forecast Objectives,
Participation, Trading Mechanisms, Claim Structures, Claim Definitions, Incentives, Account Management, and the Trading Interface.
C 2004 Jared Schrieber, schrieber(alum.mit.edu
... .... ...
4.2a Forecast Objectives
The primary objective of a forecast is to support important decisions; therefore it is essential to understand exactly how these decisions are influenced by the forecasting process. Mapping the flow of forecast information throughout the enterprise (and potentially beyond) is a valuable exercise that may help achieve this understanding. The
following questions may serve as a useful guide in this process:
" What is being forecasted and at what level(s) of detail? (e.g., Forecast Horizon, Time Buckets, Product Levels, and Location Levels)
* Who currently creates the forecast and what information and procedures do they use to create it?
" Who provides inputs to the forecast and what information do they provide? * Who uses the forecast, and what do they use it for?
* How sensitive are the decisions these people make to a range of potential forecast outcomes? What is a significant change in the forecast according to them? What increment of change in a forecast could lead to a different decision on their part? What is the difference in cost or risk between those decisions?
" What is the impact of forecast error and how does this impact change in relation to the size of the forecast error?
" Do the users judge the forecasts in anyway or feel that they could do a better job of forecasting?
* What additional information would they like to see incorporated into the forecast, either as an input or output?
" Who else uses this forecast or a variation of it?
Even if a prediction market is not used, the above process questions may be useful in discovering ways to improve upon existing forecast methodologies. In addition, it may lead to some fruitful discussions regarding whether or not the forecast is even necessary. For example, some forecasts may be replaced by improved information sharing or the reduction of lead-times (e.g. -supplier, production or decision).
4.2b Participation
Mapping the forecast process should help identify individuals who have unique
perspectives or relevant information pertaining to the future. Ideally, these individuals will comprise the set of market participants. In addition, there may be other informed individuals in adjacent organizations, or even outside the company, who are not currently associated with the forecasting process, but could add value to the collective wisdom of a prediction market. Unlike traditional forecasting methods, the costs of involving
additional people in the creation of a prediction market's forecast are quite small.
Therefore, additional participants should be able to join-in at any time if they are likely to add new information to the market (Ortner, 1998). If the amount of time participants may spend trading is a productivity concern, then it may make sense to restrict trading to certain time-periods (e.g., lunch-time), rather than preventing people with distinct
information from participating. A reduction in market hours can actually lead to more intense trading because participants are likely to encounter a market full of activity on a consistent basis.
There are very few reasons why an employee who desires to be a part of a prediction market should be turned away. Legitimate concern regarding the confidentiality of forecast information is one such reason. Another reason to restrict participation is the potential for 'moral hazard' situations, where an employee has the power to profit from
causing a negative outcome to come about. For example, in the Siemens project
management case described earlier, first-line managers were not allowed to participate in the market because they could easily manipulate outcomes to achieve trading profits. Although such employee gamesmanship with quotas and budgets is commonplace, it should be avoided whenever possible. However, this does not mean that decision makers should be prevented from trading just because they can influence the outcome in
question. These people often have the best information to share with the market, so it is important to ensure that potential incentives for hazardous behavior are mitigated (e.g., by reducing market payouts and/or prizes). Such proactive steps will also remedy concerns over potential insider-trading by those in power that would otherwise deter others from participating (Wolfers and Zitzewitz, 2003).
C 2004 Jared Schrieber, schrieber(&,alum.mit.edu 24
If there is a significant risk of bias formed by having too many participants from a particular organization represented, there are other alternatives to limiting their influence than removing potentially knowledgeable traders. One option is to simply reduce/limit the initial endowments given to any one group of people. Over time, those individuals who are adding the most information to the market will accumulate market wealth which gives them the influence they deserve, regardless of their rank or organizational
affiliation. In addition, uninformed participants are known to increase market liquidity, which can lead to improvements in accuracy because knowledgeable traders have more opportunities to share their insights for profit (Chen and Plott, 2002).
In some cases, informed traders may be added to the marketplace without increasing the number of human participants involved. When relevant statistical methods may be used to support the forecasting process, they can be transformed into automated agents that buy and sell claims on their own accord. For example, a particular agent may be
designed to execute trades whenever claim prices deviate significantly from the forecast generated by a predefined moving average forecast. This creates a naturally occurring methodology for weighting particularly useful statistical forecasting methods while allowing people to focus on the aggregation of more qualitative information. If a small number of statistical models and/or participants significantly outperform the rest of the market over a period of time, then one should reasonably question whether a prediction market is the most appropriate forecasting solution.
Another important consideration is the degree of trader anonymity to be maintained in the marketplace. When information regarding the 'owners' of open orders, actual trades, and/or account balances (performance) is made visible in a marketplace, then some degree of participant anonymity may be desirable. The range of alternatives includes: completely anonymous trading, randomly assigned user IDs, user defined IDs (e.g. - like a person's Yahoo e-mail ID), and full disclosure. The selection of one alternative over another is highly dependent on the behavioral dynamics involved in the forecasting process. The following table offers some insight into when each of these options may be the preferred choice.
Degree of
Anonymity Reason for Use
Full Disclosure If an important objective is to encourage communication of information, methods and ideas across organizations.
User Defined IDs If some participants wish to remain anonymous, while others would like to share their identities with trading partners.
Randomly If the anonymity of peoples' names is important, but the ability to Assigned IDs 'read' the trading patterns of individuals may provide some traders
or observers with meaningful insights.
Completely If there is potential for people not to share information that could Anonymous lead to negative feedback, and it is likely that the ID could be
decoded based on historical trading patterns or performance.
As previously mentioned, prediction markets add value when they are able to aggregate information that is irregularly distributed across a number of traders. Having too few traders can diminish the benefits of prediction markets
altogether. A 'thin-market' problem occurs when participants are unlikely to trade claims that they believe
have a low probability of resulting in a near-term transaction. = of Participants This creates a powerful negative feedback loop that can practically halt trading. At a minimum, thin-markets tend to aggregate information more slowly, are more subject to price manipulation, and exhibit a more pronounced 'favorite-longshot bias'. While it is unknown how many different informed traders are required for a prediction market to
function properly, we have seen successful examples where as few as seven people participated. One trick for overcoming a thin-market is to intensify trading by requiring
all traders to participate in the same, short timeframe; although this may be especially challenging when participants are in different geographies (Chen, 2004). In addition, there are trading mechanisms (discussed in the following section) that appreciably reduce the adverse affects of a thin-market3.
3 The problems with thin-markets are well documented, yet thick-markets may offer a unique problem of
their own. If the most useful information is focused in a few people's hands and they don't have sufficient capital to move the entire market, this can cause 'drift' and reduce forecast accuracy (Chen, 2004).
C 2004 Jared Schrieber, schrieber(&,alum.mit.edu 26
4.2c Trading Mechanisms
There are two primary mechanisms by which trades occur in prediction markets:
continuous double-auctions and 'market-makers'. Continuous double-auctions require a buyer and seller to agree upon a specified price and quantity for a trade to be made.
While this is perfectly acceptable for most active markets, in thin market situations, it can lead to illiquidity and large spreads between the highest 'bid' and lowest 'ask'. The resulting low trading volumes and high price volatility reduce the quality of the information generated by a predictive market.
An automated 'market-maker' can be added to a continuous double-auction to reduce the bid-ask spread and increase liquidity by placing buy and sell orders near the last traded price for a claim (Kittlitz, 1999). While this may eliminate the need for 'dummy' participants (e.g., HP's market example), it comes at a price. The 'market-maker' assumes positions in various claims and takes on risk for the administrator if the participants' remuneration is tied to their absolute performance. In addition, the rapid liquidity a 'market-maker' provides could facilitate short-term price manipulations (especially before the close of trading) before other traders are able to step-in and restore prices to a point of equilibrium. An automated 'market-maker' may also be used to test a market's equilibrium when trade stalls. This is achieved by creating an order (or
complete trade) outside of the current range to see if informed participants drive the market price back to its previous consensus level.
Unfortunately, there is no empirical evidence to demonstrate the accuracy benefits of one trading mechanism over another. As a rule of thumb, continuous double-auctions are the easiest to implement and are perfectly suited to markets with a large number of
participants or high trading volume. In the event that a thin-market problem (few traders per claim and / or slow trading over long periods of time) is likely to occur, the addition of an automated 'market-maker' is probably worth the risk of higher payouts. When more complex types of trades are necessary (e.g., conditional or grouped trades), the use of Hanson's market scoring rule or Pennock's dynamic pari-mutual mechanism should be considered (Hanson, 2004; Pennock, 2004). While these mechanisms are conceptually
brilliant, they are likely too complex for use in most corporate prediction markets.
Finally, trading commissions and interest rates for unspent balances should be avoided in all circumstances as they both unnecessarily discourage important trading activity.
4.2d Claim Structure
A claim is a statement about the future that is traded like a stock within a prediction market. The type of claims (or families of claims) that participants can trade may vary widely depending on the type of information being sought from a prediction market.
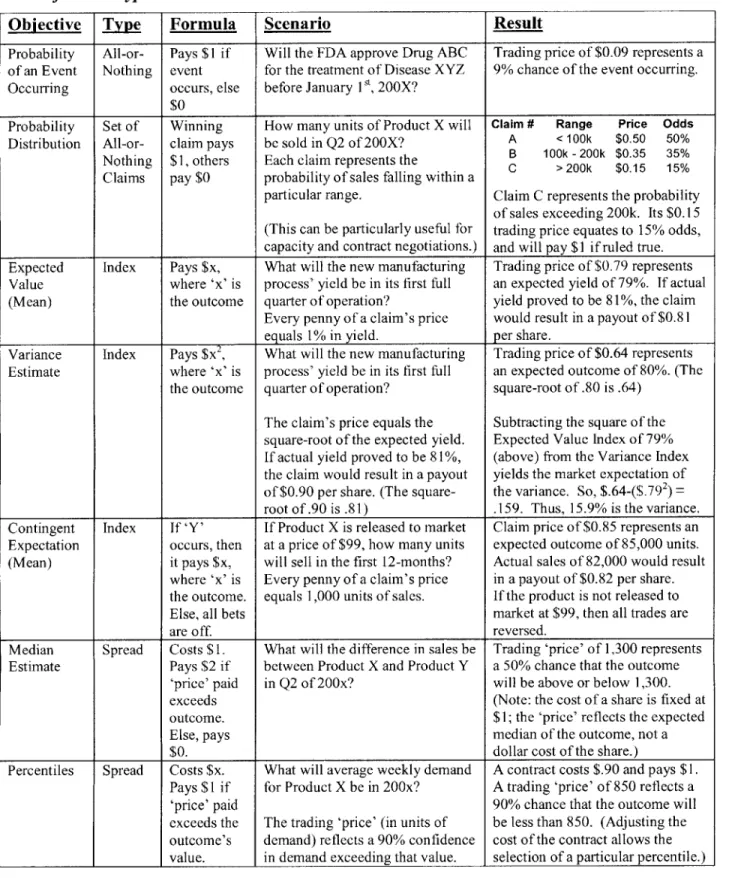
The Table of Claim Types (opposite), based primarily on the work of Wolfers and Zitzewitz (2003), defines the claim structures that are best suited for particular
forecasting objectives. Each of these claim types - All-or-Nothing, Index, and Spread
-are explored in further detail throughout this section.
All-or-Nothing Claims
All-or-Nothing claims (and sets of them) are the most common type of claims used in practice. Not only are they simple to comprehend, but a set of these claims creates a
probability distribution that can yield insights about the expected mean, variance and percentile values for the event in question. For example, the opposite table's example for the 'Probability Distribution' structure would lead to the following conclusions:
" The market believes there is a 50% chance that demand will be less than 100k, and an 85% (50% + 35%) chance that it will be less than 200k;
" The expected value (mean) for the outcome is 115k, assuming that Claims A, B, & C have average values of 50k, 150k, & 250k respectively;
* The variance of the distribution is roughly 5329k, for a standard deviation of 73k.
C 2004 Jared Schrieber, schrieberdalum.mit.edu 28
Table of Claim Types
Objective Type Formula Scenario Result
Probability All-or- Pays $1 if Will the FDA approve Drug ABC Trading price of $0.09 represents a of an Event Nothing event for the treatment of Disease XYZ 9% chance of the event occurring.
Occurring occurs, else before January 1V, 200X?
$0
Probability Set of Winning How many units of Product X will Claim # Range Price Odds
Distribution All-or- claim pays be sold in Q2 of 200X? A < 100k $0.50 50% Nothing $1, others Each claim represents the B 100k- 200k $0.35 35% Claims pay $0 probability of sales falling within a
particular range. Claim C represents the probability of sales exceeding 200k. Its $0.15 (This can be particularly useful for trading price equates to 15% odds, capacity and contract negotiations.) and will pay $1 if ruled true. Expected Index Pays $x, What will the new manufacturing Trading price of $0.79 represents Value where 'x' is process' yield be in its first full an expected yield of 79%. If actual (Mean) the outcome quarter of operation? yield proved to be 81%, the claim
Every penny of a claim's price would result in a payout of $0.81 equals 1% in yield. per share.
Variance Index Pays $x2
, What will the new manufacturing Trading price of $0.64 represents Estimate where 'x' is process' yield be in its first full an expected outcome of 80%. (The
the outcome quarter of operation? square-root of .80 is .64) The claim's price equals the Subtracting the square of the square-root of the expected yield. Expected Value Index of 79%
If actual yield proved to be 81%, (above) from the Variance Index the claim would result in a payout yields the market expectation of of $0.90 per share. (The square- the variance. So, $.64-($.792) root of.90 is .81) .159. Thus, 15.9% is the variance.
Contingent Index If 'Y' If Product X is released to market Claim price of $0.85 represents an Expectation occurs, then at a price of $99, how many units expected outcome of 85,000 units. (Mean) it pays $x, will sell in the first 12-months? Actual sales of 82,000 would result
where 'x' is Every penny of a claim's price in a payout of $0.82 per share. the outcome. equals 1,000 units of sales. If the product is not released to
Else, all bets market at $99, then all trades are
are off. reversed.
Median Spread Costs $1. What will the difference in sales be Trading 'price' of 1,300 represents Estimate Pays $2 if between Product X and Product Y a 50% chance that the outcome
'price' paid in Q2 of 200x? will be above or below 1,300.
exceeds (Note: the cost of a share is fixed at
outcome. $1; the 'price' reflects the expected
Else, pays median of the outcome, not a
$0. dollar cost of the share.)
Percentiles Spread Costs $x. What will average weekly demand A contract costs $.90 and pays $1.
Pays $1 if for Product X be in 200x? A trading 'price' of 850 reflects a
'price' paid 90% chance that the outcome will
exceeds the The trading 'price' (in units of be less than 850. (Adjusting the outcome's demand) reflects a 90% confidence cost of the contract allows the value. in demand exceeding that value. selection of a particular percentile.)
Using wide ranges to define claims, however, can lead to a number of issues. First, we have no insight into whether or not the mid-point of a claim's range fairly represents the market's expected value (mean) for that claim.
Lipitor: Global Sales Q1 2004:
Secondly, unbounded ranges provide very little What will be Upitor's alobal sales
revenue in 01 2004?
information if the claim trades at a high value 1_1
2..+ 54
(probability). In the adjacent chart, forecast users have 12.5.2.. 32
12.42.5[= 8 no way to discern the probability of sales exceeding 12.3.2.41 8
2.3-um2
$3.0 billion. Therefore it is important when using Source: NewsFutures.com
claim-sets to select appropriate increments for each claim and to use as many claims as necessary to obtain meaningful information from the upper and lower bounds of the
distribution curve. Obviously, this could result in a large number of claims (ranges) that may lead to trading difficulties such as a thin-market problem (i.e., by asking too many questions, one may not receive a single meaningful answer). In this case, it may be important to re-evaluate what information or level of detail is required from the forecast, and whether a set of 'all-or-nothing' claims is the best approach.
The considerations described above also lead one to question what the appropriate increments of claim ranges or trading prices are. This question ties back to the original forecast process mapping exercise (Section 4.2a) that was designed to identify the sensitivities of various decisions to increments of change in the forecast. In addition, the following points may serve as an additional guide for determining the appropriate level of detail built into each claim:
" Trading increments should be small enough to allow decision makers to spot important trends that may influence key decisions or strategy.
" The output of forecasts must be at a level of detail that allows for the direct allocation of resources to potential system constraints. These constraints may include people (by skillset), process lead-times, or equipment.
* Alternatively, some situations may dictate that forecasts provide visibility into the utilization of potentially divestible resources (e.g., excess factory equipment). * Finally, the ability to forecast at a particular level of detail may be limited by the
participants' knowledge and/or interest.
C 2004 Jared Schrieber, schrieber~Aalum.mit.edu 30
Index Claims
Index claims are particularly useful for obtaining the market's expected value (mean estimate) for a future outcome. Common uses include demand forecasts and project completion dates, but index claims can be used to create almost any kind of point
forecast. For example, index claims may be particularly useful in estimating demand curves and establishing prices for new product introductions. (e.g., What will demand be if the price is $X? What if the price is $Y?) The primary draw-back of index claims is that they do not offer visibility into the uncertainty of a forecast. Wolfers and Zitzewitz (2003) proposed using an index claim that pays according to the square of an outcome as a tool for predicting forecast variance (see table of claim types above for details). While this method is incredibly clever, it could be a bit confusing for business users because it requires participants to calculate squares and square-roots in order to place trades. If
insight into forecast variance is required, a set of all-or-nothing claims will generally suffice.
Spread Claims
Although spread claims are the most commonly used claim type in the context of gambling (e.g., Patriots by 7 points over the Panthers), their applicability to business is quite limited. One is hard-pressed to identify examples of important business decisions that require knowledge of 50-50 odds. However, some break-even analyses for major
investments could require assumptions regarding a 90% (or other) confidence interval. For example, a factory expansion analysis might reveal that as long as there is a 90% chance that average weekly demand for Product X will exceed 850 units, then the
expansion project should be approved. By creating a claim with a fixed cost of $0.90 and a payout of $1.00, the claim's trading 'price' fluctuates to represent an average weekly demand that should be exceeded 90% of the time. If the market reaches equilibrium at a trading 'price' of 600 units, then this sends a clear signal to the decision maker(s) to postpone the expansion. In this example, it is probably not wise to inform participants of
the 850 units per week break-point that will determine whether or not the factory expansion should move forward. This number may 'anchor' participant's expectations and introduce bias to their trading.
All Claim Types
A final consideration regarding claim structure is that of price, especially when participants are expected to trade a number of different types of claims. When claim prices are low relative to available funds or alternative investments, one can easily reflect
their relative conviction by issuing orders for smaller or larger share quantities.
However, if some claims cost exponentially more than others, or a single share represents a significant investment of one's account balance, then it requires the trader to have more confidence in their opinion before entering an order at all. If the goal is to encourage the continuous sharing of information in the form of market prices, then the cost of shares should be normalized to a consistent level, regardless of which claim is being traded. This can be achieved through the use of basic addition, subtraction, multiplication and division to transform potential outcomes into appropriate share prices. For example, if an index claim (designed to estimate the mean outcome of a future event) is used to forecast demand for a product that will sell roughly 1,000 to 3,000 units, then share prices could reflect expected demand divided by 1,000. Therefore, shares priced at $1.35 reflect a demand expectation of 1,350 units. Note that this implies that forecasting in tens-of-units instead of single units is inconsequential.
4.2e Claim Definition
Perhaps the single most important feature of a prediction market is the claim definition. All claims should be defined in such a way that they can be easily interpreted,
unambiguously judged, and clearly associated with the objectives of the forecasting process. No matter how well a market has been designed thus far, a poorly worded claim can lead to participant confusion and market prices that do not reflect their expectations about the future. In addition, claims whose outcomes are left open to subjective
interpretation are less likely to invite trading activity (Kittlitz, 1999). Clear rules for judging are very important and should include: judging criteria, a date or event that triggers judging, and who the (preferably impartial) judge(s) will be. For example, if participants are trading claims to forecast unit demand for the next quarter and stock-outs occur, then the exclusive use of sales/shipment data may not be an appropriate way to measure the outcome.
C 2004 Jared Schrieber, schrieber(Adalum.mit.edu 32