RESEARCH OUTPUTS / RÉSULTATS DE RECHERCHE
Author(s) - Auteur(s) :
Publication date - Date de publication :
Permanent link - Permalien :
Rights / License - Licence de droit d’auteur :
Dépôt Institutionnel - Portail de la Recherche
researchportal.unamur.be
University of Namur
Controlled fluorescence in a beetle’s photonic structure and its sensitivity to
environmentally induced changes
Mouchet, Sébastien R.; Lobet, Michaël; Kolaric, Branko; Kaczmarek, Anna M.; van Deun, Rik;
Vukusic, Peter; Deparis, Olivier; Van Hooijdonk, Eloise
Published in:
Royal Society of London. Proceedings B. Biological Sciences
DOI: 10.1098/rspb.2016.2334 10.1098/rspb.2016.2334 Publication date: 2016 Link to publication
Citation for pulished version (HARVARD):
Mouchet, SR, Lobet, M, Kolaric, B, Kaczmarek, AM, van Deun, R, Vukusic, P, Deparis, O & Van Hooijdonk, E 2016, 'Controlled fluorescence in a beetle’s photonic structure and its sensitivity to environmentally induced changes', Royal Society of London. Proceedings B. Biological Sciences, vol. 283, no. 1845, 20162334. https://doi.org/10.1098/rspb.2016.2334, https://doi.org/10.1098/rspb.2016.2334
General rights
Copyright and moral rights for the publications made accessible in the public portal are retained by the authors and/or other copyright owners and it is a condition of accessing publications that users recognise and abide by the legal requirements associated with these rights. • Users may download and print one copy of any publication from the public portal for the purpose of private study or research. • You may not further distribute the material or use it for any profit-making activity or commercial gain
• You may freely distribute the URL identifying the publication in the public portal ?
Take down policy
If you believe that this document breaches copyright please contact us providing details, and we will remove access to the work immediately and investigate your claim.
Controlled fluorescence in a beetle’s photonic structure and its sensitivity to environmentally induced changes
Journal: Proceedings B
Manuscript ID RSPB-2016-2334.R1
Article Type: Research
Date Submitted by the Author: 14-Nov-2016
Complete List of Authors: Mouchet, Sébastien; University of Exeter, School of Physics; Universite de Namur, Department of Physics
Lobet, Michaël; Universite de Namur, Department of Physics
Kolaric, Branko; Universite de Namur, Department of Physics; University of Mons, Currently with Micro- and Nanophotonic Materials Group, Faculty of Science
Kaczmarek, Anna; Universiteit Gent, L3 – Luminescent Lanthanide Lab, Department of Inorganic & Physical Chemistry
Van Deun, Rik; Universiteit Gent, L3 – Luminescent Lanthanide Lab, Department of Inorganic & Physical Chemistry
Vukusic, Pete; University of Exeter, School of Physics
Deparis, Olivier; Universite de Namur, Department of Physics Van Hooijdonk, Eloise; Universite de Namur, Department of Physics Subject: Biophysics < BIOLOGY, Biomaterials < BIOLOGY
Keywords: Beetle scale, Fluorescence, Natural photonic crystal, Photonic bandgap materials, Structural colour, <i>Hoplia coerulea</i>
Proceedings B category: Development & Physiology
Title: Controlled fluorescence in a beetle’s photonic structure and its sensitivity to 1
environmentally induced changes
2
Authors: Sébastien R. Mouchet1,2, Michaël Lobet1, Branko Kolaric1,3, Anna M. 3
Kaczmarek4, Rik Van Deun4, Peter Vukusic2, Olivier Deparis1 and 4
Eloise Van Hooijdonk1 5
Affiliations: 1 Department of Physics, University of Namur, Rue de Bruxelles 61, B-6
5000 Namur, Belgium 7
2
School of Physics, University of Exeter, Stocker Road, Exeter EX4 8
4QL, United Kingdom 9
3
Currently with Micro- and Nanophotonic Materials Group, Faculty of 10
Science, University of Mons, Place du Parc 20, B-7000 Mons, Belgium 11
4
L3 – Luminescent Lanthanide Lab, Department of Inorganic & 12
Physical Chemistry, Ghent University, Krijgslaan 281-S3, B-9000 13
Ghent, Belgium 14
15
Email addresses: [email protected], [email protected], 16 [email protected], [email protected], 17 [email protected], [email protected], 18 [email protected], [email protected] 19
Contact details of the corresponding author: 20 21 Sébastien R. Mouchet 22 School of Physics 23 University of Exeter 24
Physics building, Stocker Road 25 Exeter EX4 4QL 26 United Kingdom 27 T. +44 (0)1392 724156 28 [email protected] 29 30
C
ONTROLLED FLUORESCENCE IN A BEETLE
’
S
31PHOTONIC STRUCTURE AND ITS SENSITIVITY TO
32ENVIRONMENTALLY INDUCED CHANGES
33Sébastien R. Mouchet1,2, Michaël Lobet1, Branko Kolaric1,3, Anna M. Kaczmarek4, Rik Van 34
Deun4, Peter Vukusic2, Olivier Deparis1 and Eloise Van Hooijdonk1 35
1
Department of Physics, University of Namur, Rue de Bruxelles 61, B-5000 Namur, Belgium 36
2
School of Physics, University of Exeter, Stocker Road, Exeter EX4 4QL, United Kingdom 37
3
Currently with Micro- and Nanophotonic Materials Group, Faculty of Science, University of 38
Mons, Place du Parc 20, B-7000 Mons, Belgium 39
4
L3 – Luminescent Lanthanide Lab, Department of Inorganic & Physical Chemistry, Ghent 40
University, Krijgslaan 281-S3, B-9000 Ghent, Belgium 41
The scales covering the elytra of the male Hoplia coerulea beetle contain fluorophores
42
embedded within a porous photonic structure. The photonic structure controls both
43
insect colour (reflected light) and fluorescence emission. Herein, the effects of
water-44
induced changes on the fluorescence emission from the beetle were investigated. The
45
fluorescence emission peak wavelength was observed to blue-shift on water
46
immersion of the elytra whereas its reflectance peak wavelength was observed to
red-47
shift. Time-resolved fluorescence measurements, together with optical simulations,
48
confirmed that the radiative emission is controlled by a naturally engineered photonic
49
bandgap while the elytra are in the dry state, whereas non-radiative relaxation
50
pathways dominate the emission response of wet elytra.
51
KEYWORDS: Beetle scale; fluorescence; natural photonic crystal; photonic bandgap materials; 52
structural colour 53
1.INTRODUCTION
54
Natural photonic structures such as those found in insects exhibit a large variety of optical 55
properties, among which structural colours (i.e. colours due to coherent scattering)1-3, liquid-56
induced colour changes4-9 and colour sensitivity to gas or vapour10-15 have attracted much 57
interest. Many biological photonic structures are porous and comprise biopolymers such as 58
chitin, keratin and cellulose. The range of structures and optical effects found in biological 59
systems which have been optimised through evolution for millions of years, enables the 60
development of new designs and possible technological applications through an approach 61
that incorporates bioinspired principles16-19. Another optical phenomenon found in living 62
organisms is fluorescence emission. This phenomenon consists of a process of radiative 63
decay (i.e. light emitting) of a substance that has previously been excited by absorption of 64
electromagnetic radiation of higher energy. Fluorescence is found in many living organisms, 65
terrestrial as well as aquatic, including arthropods20,21 (e.g. butterflies22-25, beetles21,26, 66
scorpions27), marine invertebrates (e.g. corals28, sea anemones29), birds (such as parrots30 67
and penguins31), plants32 as well as mammals33 (e.g. tooth enamel, white hair and nails). 68
These organisms emit visible light and thus display colours when they are illuminated by 69
ultraviolet (UV) light. This light emission arises due to the presence of fluorophores, such as 70
biopterin or papilochrome II. Colour emission through fluorescence can range from blue, 71
green, yellow to red21 depending on the fluorophores. 72
The confinement of fluorophores within photonic structures can lead to controlled 73
fluorescence, through modification of the system’s density of optical states (DOS)34-37. When 74
fluorescence occurs within the photonic bandgap (PhBG) of a photonic structure, a decrease 75
in the emission intensity is observed. This arises as a consequence of the associated 76
increase in decay time τ of the excited states34-38. This sort of photonic confinement can be 77
found in several living organisms24,25,39-48. We note that the contribution of fluorescence 78
emission to the colour appearance of a living organism is not always striking, often because, 79
available solar UV intensity and insect fluorophore internal quantum efficiency can be low. 80
This was highlighted in several nireus group butterflies (Papilio bromius, Papilio epiphorbas, 81
Papilio nireus and Papilio oribazus) for which the contribution of the fluorescent blue 82
emission to their colour is minor25. Fluorescence emission in living organisms is not 83
necessarily always functional. There is no known purpose, for instance, for the fluorescence 84
of mammalian nails or tooth enamel. In contrast, however, the absorption of UV by 85
fluorophores can provide insect species with protection against potential damage1. 86
The male Hoplia coerulea (Drury 1773), a beetle from the family Scarabaeidae, exhibits a 87
variety of optical properties including vivid iridescent colour2,49,50, liquid- and vapour-induced 88
colour changes6,8,14,15,51 and fluorescence43. The source of all these properties lies in the flat 89
circular scales covering the beetle’s elytra. Each scale exhibits a bright blue iridescent 90
colour2,49,50 (Figure 1a) under incident white light due to its more or less ordered 91
macroporous photonic structure. This structure can be described as a periodic stacked 92
combination of thin pure cuticle layers and mixed air-cuticle porous layers50 (Figure 1b-c). In 93
the dry state, these give rise to a Bragg reflectance peak in the blue part of the visible 94
spectrum (at approximately 460 nm at normal incidence). The wavelength of this peak blue-95
shifts as incidence angle increases. When the insect is in contact with liquids6,8,51 or 96
vapour14,15, its colour reversibly changes from blue to green, as a consequence of the fluids 97
penetrating within the photonic structure and inducing changes in refractive index 98
contrast6,8,14,15,51. One interesting aspect of this fluid-induced colour change is that it takes 99
place in a photonic structure that is not directly open to the surrounding environment8. An 100
envelope encases this photonic structure and mediates fluid exchanges with the 101
environment. Due to similarities with typical biological cells, this H. coerulea photonic 102
structure was previously referred to as a “photonic cell”8. Moreover, fluorophores are 103
embedded within the structure. In other work43 it was demonstrated that the confinement of 104
fluorescent sources in the modelled photonic structure of the scales gave rise both to 105
enhancement and inhibition of the fluorescent emission at particular wavelengths. 106
Although there have been a few studies of liquid-induced fluorescence changes in insects’ 107
photonic structures, specifically relating to three butterflies (Morpho sulkowskyi47, Papilio 108
zalmoxis47 and P. nireus23), the area is very much under-explored. In these previously 109
reported studies23,47, a liquid with a refractive index close to chitin was used to remove the 110
effects of the photonic structure on the fluorescence steady state, by index matching. 111
Significant decreases in the emitted energy47 and the decay time23 were observed with the 112
decrease of the refractive index contrast, while variations of the emission peak wavelength 113
as function of refractive index change were rather small (blue-shift of less than 10 nm)47. 114
In this work, changes in the fluorescence steady state of the fluorophores located in the 115
elytra of male H. coerulea beetles, upon contact with water, were experimentally observed. 116
This led to a blue-shift of the fluorescent emission from the insect structure, a feature that 117
was previously unnoticed. The fluorescence-associated colour changed from turquoise (blue-118
green) to dark blue. Using several morphological and optical characterisation techniques in 119
addition to optical simulations, this surprising response was explained in terms of water-120
induced changes of the photonic environment in the scales’ porous structure. 121
2.MATERIALS AND METHODS
122
(A)PHOTONIC STRUCTURE MORPHOLOGY
123
The morphology of the elytra was investigated using a FEI Tecnai 10 (Hillsboro, Oregon, 124
USA) transmission electron microscope (TEM) and a FEI Nova Nanolab 200 Dual-Beam 125
(Hillsboro, Oregon, USA) scanning electron microscope (SEM). Elytra of dead H. coerulea 126
were prepared following a standard sample preparation method52. 100 nm-thick cross 127
sections were ultramicrotomed and transferred onto TEM analysis grids. For SEM analysis, 128
elytra were cut into pieces of about 5 ×5mm2and attached to the sample mount by 129
conducting adhesive tape. This was sputter-coated with 20 nm of platinum. The focussed-ion 130
beam facility (FIB) on the FEI Nova Nanolab 200 Dual-Beam SEM was used to reconstruct a 131
three dimensional representation of the scale structure (FEI Avizo 3D Software). 132
(B)OPTICAL CHARACTERISATION
133
Optical microscopy was performed using an Olympus BX61 (Tokyo, Japan) microscope, an 134
Olympus XC50 camera and an Olympus BX-UCB visible light source (in reflection mode) or 135
a Lumen Dynamics X-cite Series 120PCQ (Mississauga, Ontario, Canada) UV-lamp (in 136
fluorescence mode). Further details are available as supplementary material. 137
The normalised reflection spectra R=
(
I−B) (
W−B)
, i.e. the ratio between the spectral 138intensities I and W reflected by the sample and by an Avantes WS-2 (Apeldoorn, The 139
Netherlands) white reference, respectively, including noise corrections B , were measured 140
using an Ocean Optics QE65Pro (Dunedin, Florida, USA) spectrophotometer connected to 141
the microscope. The numerical aperture of the microscope objective was equal to 0.50. The 142
use of a microspectrophotometer allowed us to analyse very small areas of the elytra 143
comprising only a few scales (i.e. spot sizes of approximately 30 µm diameter). 144
Fluorescence measurements were performed using an Edinburgh Instruments (Livingston, 145
UK) FLSP920 UV−vis−NIR spectrofluorimeter equipped with a Hamamatsu R928P 146
(Hamamatsu City, Japan) photomultiplier-tube. The recorded time-resolved dynamics were 147
fitted by single exponential functions. Only in the case of the dry sample within the PhBG (at 148
466 nm), the best fit was obtained using a double exponential function. These closest 149
theoretical fits enabled us to determine the decay time of the fluorescence emission. Further 150
details regarding spectrofluorimetry measurements are available as supplementary material. 151
The chemistry of H. coerulea’s fluorophores has not yet been identified. Furthermore, the 152
distribution of this pigment in the photonic structure has not yet been experimentally 153
determined. More detailed investigations of the fluorophores are necessary and are beyond 154
the scope of the present study. 155
(C)PHOTONIC MODEL OF THE BEETLE SCALE AND NUMERICAL METHODS
156
The elytra of male H. coerulea beetles are covered by almost circular scales, composed 157
principally of chitin. Their average diameter is approximately 80 µm and their thickness is 158
approximately 3.5 µm. The photonic structure responsible for the specular reflection of light 159
at these scales’ surfaces is revealed by electron microscope images (Figure 1b-c). It is a 160
porous multilayer formed by the periodic stacking of thin, flat pure cuticle layers and thick 161
mixed air-cuticle porous layers (network of rods separated by air gaps). 162
Based on similar electron microscope images, Vigneron et al.50 and Rassart et al.6 identified 163
the geometrical parameters of the structure. In our study, we used the same photonic model 164
as was presented in the two earlier studies6,50. On average, 12 bilayers are found in the 165
periodic stack (Figure 1b-d). Vigneron and Rassart give the thickness of cuticle layers as 166
35 nm and the thickness of the mixed air-cuticle layers as 140 nm. Their stated width of the 167
rods is 90 nm and the air gap between two successive rods is 85 nm. 168
The refractive index nchitin of cuticle material (mainly chitin) is often quoted as equal to 1.56 in 169
the visible range53. This average dispersionless value is a good trade-off between dispersion 170
relations found in the literature54-56 for butterfly scales and beetle exocuticle. These relations 171
are valid only in the visible range whereas the refractive index of cuticle material in the near-172
UV range is actually not known. As first approximation, the same refractive index value was 173
used in all our simulations from near-UV to visible ranges. In the dry state, the mixed air-174
cuticle layers are approximated by a homogeneous material with an effective refractive index 175
mixed
n lying between 1 (air) and 1.56 (chitin). Using a previously reported effective medium 176
approximation6, a value of nmixed=1.26 is calculated for the mixed air-cuticle layers. The 177
modelled photonic structure therefore consists of a 1D periodic stack of thin pure cuticle 178
layers and thicker effective layers (Figure 1d). In the wet state, since water (nwater=1.33)
179
replaces air in pores, the effective refractive index becomes nmixed =1.44. Using an effective 180
medium approximation is justified since the photonic structure does not give rise to non zero-181
order diffraction at visible wavelengths50 as a result of the disorder in the orientations of the 182
rods and the small distances between them (i.e. 175 nm). 183
A conventional one-dimensional transfer-matrix (1D-TM) method approach57 was used to 184
simulate reflectance spectra of the H. coerulea multilayer structure in dry and wet states. 185
This method rigorously solves Maxwell’s equations in each layer of the photonic structure for 186
the propagation of electromagnetic waves through layered media. In this formalism, the 187
electromagnetic field wave is decomposed in each layer into forward and backward waves 188
propagating in the direction perpendicular to the layers. An extension of the 1D-TM 189
method43,47 was employed in order to model light emission from the structure. This extended 190
method relies on the calculation of spectral variations in the emitted intensity, normalised 191
with respect to a source in free space. It requires light to be homogeneously emitted by a 192
single layer, in which a non-zero current density vector is included in Maxwell’s equations in 193
order to represent a uniform distribution of fluorophores. For a more realistic simulation of 194
arbitrary fluorophore distribution, emission spectra were calculated with the emission source 195
located in each pure cuticle layer separately, and then averaged in order to simulate light 196
emission by the sources (fluorophores) distributed across the whole photonic structure. 197
Simulations were also performed using the finite-difference time-domain (FDTD) method58, 198
using the MIT Electromagnetic Equation Propagation (MEEP 1.2) package59. Further details 199
regarding these simulations are available as supplementary material. 200
The photonic band structure and the Density Of optical States (DOS) were calculated in the 201
specific case of an infinite 1D photonic crystal based on the H. coerulea photonic structure 202
using a Kronig-Penney model approach and presented in ref. 60. A frequency-domain 203
method, based on an eigensolver for Maxwell’s equations in a plane wave basis, was used to 204
compute the Local Density Of optical States (LDOS)61. The LDOS NLDOS
( )
r,ω counts the 205available number of electromagnetic modes in which photons can be emitted at the specific 206
location of the emitting source. It depends therefore on the frequency
ω
and the position r 207of the emitting source in the environment but not on the propagation direction. It is known to 208
be related to the emitter decay time (according to Fermi’s golden rule) by the relation: 209
( )
( )
r N r N 0 , LDOS LDOS 0 ,ω τ τ= where τ0 is the decay time of one emitter located in free space, τ is the 210
decay time of the emitter and N
( )
r0 ,
LDOS is the LDOS of the emitter in free space. When 211
( )
,ωLDOSr
N is equal to zero, no propagation mode is available at position r and frequency 212
ω. In this case, the decay time τ is infinite and light emission is inhibited. 213
The same structural model was used in all simulation methods. However, for calculations of 214
the photonic band structure, namely DOS and LDOS, the number of bilayers was assumed 215
to be infinite instead of equal to 12. 216
3.RESULTS AND DISCUSSION
217
The colour displayed by the male H. coerulea beetle scales is violet-blue (Figure 2a) and 218
turns to green when they are in contact with water (Figure 2b). This arises due to the filling of 219
the scales’ macropores with water6. This appearance change corresponds to the shift of the 220
reflectance peak maximum from 458 nm to 525 nm (namely, a red-shift) (Figure 2c). 221
Decreases in reflectance intensity as well as in peak reflectance width are also observed. 222
Under exposure to UV light, the fluorescence emission from the H. coerulea elytra changes 223
from turquoise to dark blue upon contact with water (Figure 2d-e). The main features of the 224
excitation spectrum are consistent (Figure 2f): the peak wavelength is found at 365 nm and 225
367 nm in the dry and wet states, respectively, and their associated full width at half 226
maximum (FWHM) values are equal to 72 nm and 67 nm, respectively. Excitation of the 227
fluorophores is not influenced by contact with water. This indicates that the observed liquid-228
induced changes do not affect the ground states of the fluorophores. However, clearly the 229
emission spectrum of the scales is significantly modified (Figure 2f): they exhibit an 230
immersion-mediated blue-shift from 463 nm to 446 nm (∆
λ
=17nm) and a decrease in 231FWHM from 121 nm to 105 nm. This response largely exceeds the responses measured in 232
the cases of butterfly species (typically of less than 10 nm)47. Notably, the direction of the 233
immersion-mediated change of fluorescence emission peak wavelength is opposite to that of 234
the immersion-mediated shift of reflectance peak wavelength. 235
The water-induced changes in fluorescence emission were found to be reversible, a property 236
also associated with the changes in reflectance. This infers that the fluorophores are not 237
significantly altered chemically by exposure to water and UV under our experimental 238
conditions. For both excitation and emission spectra, a decrease in intensity upon contact 239
with water is observed (Figure 2f). It can be explained by, among other processes, the 240
presence of water at the surface of the sample modifying light scattering efficiency. 241
If fluorophores are located in an infinite photonic crystal with a significant refractive index 242
contrast, as well as a complete PhBG preventing emission, and provided their fluorescence 243
efficiency is assumed to be equal to 1 (namely, the only decay process is fluorescence), they 244
will remain in their excited states. However, in the case of a finite crystal, or one with a low 245
refractive index contrast, the decay will be radiative with an associated decay time longer 246
than in free space. In order to investigate the effect of the environment on the fluorescence 247
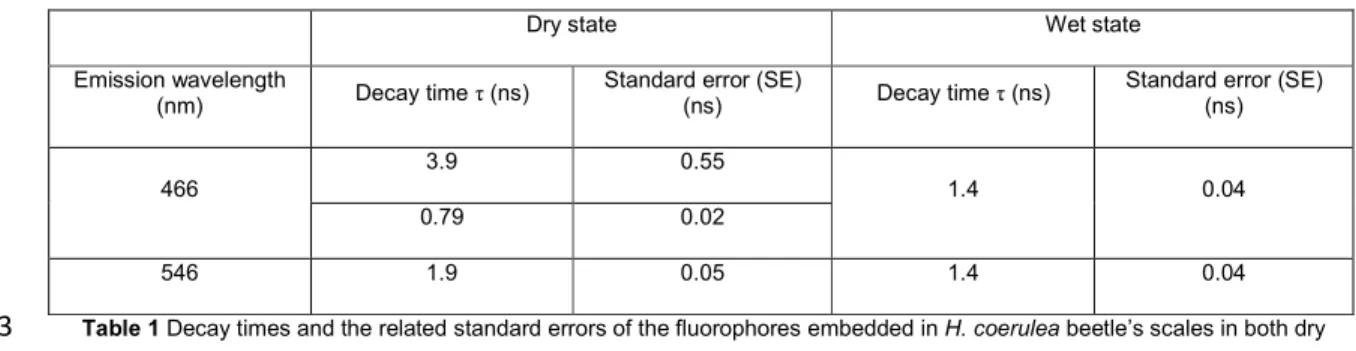
emission further, time-resolved measurements were performed. Data from these 248
measurements indicate that when the elytron is in the dry state and has an emission 249
wavelength inside the PhBG (at 466 nm), the decay time τ (Table 1) is significantly longer 250
(3.9 ns) than for a wet elytron (1.4 ns). Outside the PhBG (at 546 nm), regardless of the wet 251
or dry state, τ is shorter (1.9 ns and 1.4 ns in the dry and wet states, respectively). In the 252
case of the wet state, the decay time of the fluorescence emission is the same both inside 253
and outside the PhBG. This may be partly explained by the decrease in the system’s 254
refractive index contrast that leads to an associated decrease of the fluorescence inhibition in 255
the wet state62. However, combined with the experimentally measured decrease in 256
fluorescence emission intensity, this observation clearly indicates that the wet state opens 257
non-radiative relaxation pathways, for instance quenching processes, that in parallel 258
decrease the effect of the optical system’s PhBG on fluorescence emission. In contrast, in 259
the dry state the presence of the PhBG strongly influences emission properties and causes 260
an increase in fluorescence emission decay time as well as a double exponential decay. The 261
inhibition of fluorescence emission related to the observed increase of decay time is 262
explained by a lack of available modes for the radiative decay of the fluorophores embedded 263
within the photonic structure with respect to the same fluorophores in a homogeneous 264
medium. Due to this inhibition, a redistribution of energy has hence to take place leading to 265
non-radiative transfers to the environment38. The longest decay time (3.9 ns) corresponds to 266
the real life time of the fluorophores within the photonic structure. The shortest decay time 267
(0.79 ns) is related to non-radiative relaxations of the excited states. The time-resolved 268
measurements of the fluorescence emission from probes embedded within colloidal photonic 269
structures37,38 are perfectly in agreement with these results. We observed that the decay time 270
in the dry state is more than twice the value of the decay time in the wet state, or at a 271
frequency outside the PhBG. This is counterintuitive if we take into account the low refractive 272
index contrast of the materials forming the photonic structure. It is a result that may be 273
explained at a phenomenological level by considering the curvature of the biological photonic 274
structure: this can additionally alter the system’s photonic properties and, therefore, its 275
fluorescence emission63,64. 276
In the simulated photonic band structure (Figure 3b) and related DOS (Figure 3c), first and 277
second order PhBGs are predicted at 231 nm and 464 nm in the dry state. Despite the 278
presence of these two PhBGs, fluorescence emission can arise because the excitation peak 279
wavelength (Figure 2f) is located between these two PhBGs: the experimental excitation 280
peak wavelength was measured at approximately 365 nm. Additionally, the dry sample’s 281
reflectance peak wavelength, at 45° incidence (i.e. the same angle as was used for the 282
emission spectra measurements) was 436 nm. This reflectance peak presented a 79 nm 283
FWHM. Furthermore, the simulated reflectance spectra (at normal incidence) in dry and wet 284
conditions (Figure 3a) confirmed the experimentally-measured red-shift that is induced by 285
contact with water. Namely, the calculated reflectance peak wavelength is 461 nm in the dry 286
state and 501 nm in the wet state. The PhBGs also shift towards longer wavelengths when 287
air is replaced by water in the macropores of the photonic structure and this is the 288
mechanism by which the decay time of the emission at 466 nm is modified. The decreases in 289
reflectance peak intensities and FWHMs, as well as the PhBG widths (in the visible and the 290
UV ranges), are also predicted when water replaces air in the structure. These predicted 291
decreases, in addition to the changes in reflectance peak wavelength, agree with the 292
observed changes of the reflectance spectrum (Figure 2c) and previously reported 293
observations6. Both decreases are explained by the decrease of the effective refractive index 294
contrast nchitin nmixed between the layers59 from 1.24 (dry state) to 1.08 (wet state). 295
Differences between measured and simulated spectra can be observed (e.g. in terms of 296
peak wavelengths and widths). These, in part, may arise from systematic errors associated 297
with the experimental incidence and detection angles (for instance, a 20°-incidence leads to 298
a 16-nm blue-shift of the reflectance peak position with respect to a normal incidence). 299
Furthermore, although the incident beam width is smaller than the size of the scales, the 300
beam may have not been centred on one single scale: a few sections of different scales may 301
have been analysed concurrently. Finally, the system’s photonic structure is modelled as an 302
idealised perfectly periodic system even though it exhibits irregular layer interfaces, 303
inhomogeneities in refractive indices and dimensions, etc. 304 The computed
( )
( )
r N r N 0 , LDOS LDOS 0 ,ω τ τ= ratio turns out to be equal to zero inside the PhBG (e.g. at 305
466 nm) in the dry state regardless of the position of the emitter. This corresponds to an 306
infinite decay time τ, i.e. light emission is inhibited. However, in the wet state, this ratio 307
ranges from 0.66 (at the layer interfaces) and 0.86 (at the middle of the mixed air-cuticle 308
porous layers). Due to the water-induced shift of the PhBG, light can be emitted at this 309
wavelength. Outside the PhBG (i.e. at 546 nm),
τ τ0
ranges from 0.6 (at the middle of the 310
mixed air-cuticle porous layers) to 0.8 (at the layer interfaces) regardless of the state (dry or 311
wet) of the modelled photonic structure. These results confirm the measured decay time 312
variations induced by contact with water. We note that this ratio cannot be calculated from 313
experimental data because the decay time τ0 in free space of the particular fluorophores 314
embedded in the structure is unknown. In addition to the absence of defects assumed in the 315
modelled photonic structure, we mention that the measurements were not performed on a 316
single fluorescence source. Each fluorophore located in the analysis area influenced the 317
measurement. 318
Since the photonic structure controls the fluorescence emission43,47, the emission spectrum is 319
modified by the change in refractive index within the macropores of the photonic structure. In 320
order to demonstrate this effect, two models of fluorescent sources were investigated. In both 321
models, the fluorophores were assumed to be homogeneously distributed throughout the 322
cuticular material in the photonic structure. In the first set of models, fluorophores formed a 323
uniformly planar source (emitting a uniform spectrum and located at the position of one pure 324
cuticle layer). These simulations were performed for each of the 12 pure cuticle layer 325
positions using the extended 1D-TM method and the resulting emission spectra were 326
averaged (Figure 4a). In the second model (computed using a FDTD method), fluorophores 327
were modelled by 180 point sources randomly located (according to a continuous uniform 328
distribution) across the cuticle material of structure (i.e., taking into account the filling fraction 329
of material in the pure cuticle and mixed air-cuticle porous layers) (Figure 4b). In both 330
models, the intensity emitted by the sources embedded in the structure was normalised to 331
the intensity emitted by the sources in the absence of the structure. In this way, normalised 332
values greater than unity are associated with enhancement of the fluorescence by the 333
photonic structure at the corresponding wavelengths (Figure 4). Similarly, values less than 334
unity are associated with inhibition. In principle, re-absorption can affect fluorescence, 335
especially in the case of high quantum yield fluorophores. If re-absorption (or other non-336
radiative processes) takes place, the decay of fluorescence intensity is modified and does 337
not follow a single exponential law any more. This is not the case here outside the PhBG, 338
where the decay of fluorescence intensity was found to follow a single exponential law 339
(Figure S1). The absence of substantial overlap between fluorescence excitation and 340
emission spectra and the observation of clean, single peaked emission spectra (Figure 2f) 341
also suggest that re-absorption is negligible here. Therefore, re-absorption was not taken into 342
account in our simulations. In both emitted intensity spectra, a blue-shift of emission peak 343
wavelengths (corresponding to strong enhancement of emission) occurs; the peak at 480 nm 344
blue-shifts to 428 nm and the peak at 429 nm shifts to 416 nm in the cases of first and 345
second models, respectively. Although both models are subject to unavoidable assumptions, 346
it is important to observe that simulations (based on two different methods) are in qualitative 347
agreement. It is however important to admit that a perfect match cannot be expected since 348
the emitting sources are modelled in radically different ways. The common point is the 349
assumed uniformity of fluorophores distribution. The qualitative agreement between 350
simulations (Figure 4) and measurements (Figure 2f) suggests that the fluorophores are 351
distributed throughout the photonic structure. 352
4.CONCLUSIONS
353
We investigated the male H. coerulea beetle that presents a broad variety of optical 354
properties. Inside the scales that cover its elytra is a macroporous photonic architecture 355
responsible for structural colour and fluorophores responsible for fluorescence emission. Our 356
experiments revealed that the macroporous nature of this photonic system supports fluid-357
induced colour changes. H. coerulea’s intra-scale photonic structure can be approximated by 358
a periodic multilayer stack comprising pure cuticle layers and mixed air-cuticle porous layers. 359
Despite this structure’s PhBGs the optical system has evolved in such a way that 360
fluorescence emission is not inhibited, i.e. excitation wavelengths do not overlap with the 361
system’s PhBGs. The influence of the system’s exposure to water on its fluorescence 362
emission was also investigated for the first time. A 17 nm water-induced blue-shift, from 363
turquoise to dark blue, of the emission peak wavelength was measured. This contrasted to 364
the water-induced 67 nm red-shift of the reflectance peak wavelength. These changes arise 365
due to modification in effective refractive index following pore filling by water. An additional 366
consequence of contact with water is the decrease of the fluorescence decay time at a 367
wavelength inside the PhBG. In the dry state, this decay time is significantly longer inside, 368
compared to outside, the PhBG. This is the result of the PhBG’s influence on fluorescence 369
emission. Since, in the wet state, the decay time is the same inside and outside, the PhBG, 370
we can conclude that quenching processes take place and non-radiative relaxation pathways 371
dominate the emission mechanism. Simulations of light emission from the system indicated 372
that the presence of water in the macropores of the photonic structure leads to a blue-shift of 373
the emission spectrum. This agrees with experimental data for the system. The simulations 374
additionally confirmed the likelihood of a homogeneous distribution of fluorophores across 375
the structure and the role of the multilayer in this water-induced change in fluorescence 376
emission. Such a photonic system offers a new possibility to design novel functional optical 377
materials and coatings in technological areas such as imaging, lighting, biosensing and solar 378
cells. 379
DATA ACCESSIBILITY.
380
Data available from the Dryad Digital Repository: http://dx.doi.org/10.5061/dryad.sm72f. 381
COMPETING INTERESTS.
382
We declare we have no competing interests. 383
AUTHORS’ CONTRIBUTIONS.
384
S.R.M., M.L. and E.V.H. conceived the original project. S.R.M. performed the morphological 385
characterisation. S.R.M. and E.V.H. conducted the optical and fluorescence microscopy 386
analyses as well as the reflectance measurements. A.M.K. and S.R.M. performed the 387
fluorescence measurements. B.K. and S.R.M. performed the time-resolved fluorescence 388
data analysis. S.R.M. performed the LDOS simulations and M.L., the FDTD method 389
simulations. E.V.H. and S.R.M. performed the 1D-TM method simulations as well as the 390
calculation of the photonic band structures and related DOS. S.R.M., M.L., B.K., A.M.K., 391
R.V.D., P.V., O.D. and E.V.H. discussed the results. S.R.M., M.L. and E.V.H. wrote the 392
manuscript with input from B.K., P.V. and O.D. All authors commented on the manuscript 393
and gave approval to its final version. 394
ACKNOWLEDGEMENTS.
395
The authors thank Louis Dellieu (Department of Physics, UNamur) for technical support 396
during the collection of samples and Michaël Sarrazin (Department of Physics, UNamur) for 397
commenting an early version of this article as well as for fruitful discussions. This research 398
used resources of the “Plateforme Technologique de Calcul Intensif (PTCI)”, UNamur 399
(http://www.ptci.unamur.be), which is supported by F.R.S.-FNRS under the convention No. 400
2.4520.11 as well as of the Electron Microscopy Service (SME), UNamur 401
(http://www.unamur.be/en/sevmel). PTCI and SME are members of the “Consortium des 402
Équipements de Calcul Intensif (CÉCI)” (http://www.ceci-hpc.be) and of the “Plateforme 403
Technologique Morphologie – Imagerie” (UNamur), respectively. 404
FUNDING.
405
S. R. Mouchet was supported by the Belgian National Fund for Scientific Research (F.R.S.-406
FNRS) as a Research Fellow and by Wallonia-Brussels International (WBI) through a 407
Postdoctoral Fellowship for Excellence program WBI.WORLD. B. Kolaric acknowledges 408
financial support from the “Action de Recherche Concertée” (BIOSTRUCT project – 409
No.10/15-033) of UNamur, from Nanoscale Quantum Optics COST-MP1403 action and from 410
F.R.S.-FNRS; Interuniversity Attraction Pole: Photonics@be (P7-35, Belgian Science Policy 411
Offfice). A. M. Kaczmarek acknowledges Ghent University’s Special Research Fund (BOF) 412
for a Postdoctoral Mandate (project BOF15/PDO/091). R. Van Deun thanks the Hercules 413
Foundation (project AUGE/09/024 “Advanced Luminescence Setup”) for funding. E. Van 414
Hooijdonk was supported by F.R.S.-FNRS as a Postdoctoral Researcher. This research was 415
also supported by F.R.S.-FNRS through the Researchers’ Credit CC 1.5075.11F and the 416
Research Credit CDR J.0035.13. 417
REFERENCES
418
1. Berthier S. 2000 La couleur des papillons ou l'impérative beauté - Propriétés optiques des 419
ailes de papillons. Springer, Paris. 420
2. Berthier S. 2003 Iridescences, les couleurs physiques des insects. Springer, Paris. 421
3. Kinoshita S. 2008 Structural Colors in the Realm of Nature. World Scientific Publishing Co, 422
Singapore. 423
4. Vigneron JP, Pasteels JM, Windsor DM, Vértesy Z, Rassart M, Seldrum T, Dumont J, 424
Deparis O, Lousse V, Biró LP et al. 2007 Switchable reflector in the Panamanian tortoise 425
beetle Charidotella egregia (Chrysomelidae: Cassidinae). Phys. Rev. E 76, 031907. 426
(doi:10.1103/PhysRevE.76.031907) 427
5. Rassart M, Colomer JF, Tabarrant T, Vigneron JP. 2008 Diffractive hygrochromic effect in 428
the cuticle of the hercules beetle Dynastes hercules. New J. Phys. 10, 033014. 429
(doi:10.1088/1367-2630/10/3/033014) 430
6. Rassart M, Simonis P, Bay A, Deparis O, Vigneron JP. 2009 Scales coloration change 431
following water absorption in the beetle Hoplia coerulea (Coleoptera). Phys. Rev. E 80, 432
031910. (doi:10.1103/PhysRevE.80.031910) 433
7. Liu F, Dong BQ, Liu XH, Zheng YM, Zi J. 2009 Structural color change in longhorn beetles 434
Tmesisternus isabellae. Opt. Express 17, 16183-16191. (doi:10.1364/OE.17.016183) 435
8. Mouchet SR, Van Hooijdonk E, Welch VL, Louette P, Colomer JF, Su BL, Deparis O. 2016 436
Liquid-induced colour change in a beetle: the concept of a photonic cell. Sci. Rep. 6, 19322. 437
(doi:10.1038/srep19322) 438
9. Wang W, Zhang W, Fang X, Huang Y, Liu Q, Gu J, Zhang D. 2014 Demonstration of 439
higher colour response with ambient refractive index in Papilio blumei as compared to 440
Morpho rhetenor. Sci. Rep. 4, 5591. (doi:10.1038/srep05591) 441
10. Potyrailo RA, Ghiradella H, Vertiatchikh A, Dovidenko K, Cournoyer JR, Olson E. 2007 442
Morpho butterfly wing scales demonstrate highly selective vapour response. Nat. Photonics 443
1, 123-128. (doi:10.1038/nphoton.2007.2) 444
11. Biró LP, Kertész K, Vértesy Z, Bálint Zs. 2008 Photonic nanoarchitectures occurring in 445
butterfly scales as selective gas/vapor sensors. Proc. SPIE 7057, 705706. 446
(doi:10.1117/12.794910) 447
12. Mouchet S, Deparis O, Vigneron JP. 2012 Unexplained high sensitivity of the reflectance 448
of porous natural photonic structures to the presence of gases and vapours in the 449
atmosphere. Proc. SPIE 8424, 842425. (doi:10.1117/12.921784) 450
13. Potyrailo RA, Starkey TA, Vukusic P, Ghiradella H, Vasudev M, Bunning T, Naik RR, 451
Tang Z, Larsen M, Deng T et al. 2013 Discovery of the surface polarity gradient on iridescent 452
Morpho butterfly scales reveals a mechanism of their selective vapor response. P. Natl Acad. 453
Sci. USA 110, 15567-15572. (doi:10.1073/pnas.1311196110) 454
14. Mouchet S, Su BL, Tabarrant T, Lucas S, Deparis O. Hoplia coerulea, a porous natural 455
photonic structure as template of optical vapour sensor. 2014 Proc. SPIE 9127, 91270U. 456
(doi:10.1117/12.2050409) 457
15. Mouchet SR, Tabarrant T, Lucas S, Su BL, Vukusic P, Deparis O. Vapor sensing with a 458
natural photonic cell. Opt. Express 24, 12267-12280. (doi:10.1364/OE.24.012267) 459
16. Biró LP, Vigneron JP. 2011 Photonic nanoarchitectures in butterflies and beetles: 460
valuable sources for bioinspiration. Laser Photonics Rev. 5, 27-51. 461
(doi:10.1002/lpor.200900018) 462
17. Kim JH, Moon JH, Lee SY, Park J. 2010 Biologically inspired humidity sensor based on 463
three-dimensional photonic crystals. Appl. Phys. Let. 97, 103701. (doi:10.1063/1.3486115) 464
18. Ghazzal MN, Deparis O, De Coninck J, Gaigneaux EM. 2013 Tailored refractive index of 465
inorganic mesoporous mixed-oxide Bragg stacks with bio-inspired hygrochromic optical 466
properties. J. Mater. Chem. C 1, 6202-6209. (doi:10.1039/c3tc31178c) 467
19. Deparis O, Ghazzal MN, Simonis P, Mouchet SR, Kebaili H, De Coninck J, Gaigneaux 468
EM, Vigneron JP. 2014 Theoretical condition for transparency in mesoporous layered optical 469
media: Application to switching of hygrochromic coatings. Appl. Phys. Lett. 104, 023704. 470
(doi:10.1063/1.4862658) 471
20. Lawrence RF. 1954 Fluorescence in arthropoda. J. Ent. Soc. South Africa 17, 167-170. 472
21. Welch VL, Van Hooijdonk E, Intrater N, Vigneron JP. 2012 Fluorescence in insects. Proc. 473
SPIE 8480, 848004. (doi:10.1117/12.929547) 474
22. Cockayne EA. 1924 I. The Distribution of Fluorescent Pigments in Lepidoptera. T. Roy. 475
Ent. Soc. London 72, 1-19. (doi:10.1111/j.1365-2311.1924.tb03347.x) 476
23. Vukusic P, Hooper I. 2005 Directionally Controlled Fluorescence Emission in Butterflies. 477
Science 310, 1151. (doi:10.1126/science.1116612) 478
24. Trzeciak TM, Wilts BD, Stavenga DG, Vukusic P. 2012 Variable multilayer reflection 479
together with long-pass filtering pigment determines the wing coloration of papilionid 480
butterflies of the nireus group. Opt. Express 20, 8877-8890. (doi:10.1098/rsfs.2011.0082) 481
25. Wilts BD, Trzeciak TM, Vukusic P, Stavenga DG. 2012 Papiliochrome II pigment reduces 482
the angle dependency of structural wing colouration in nireus group papilionids. J. Exp. Biol. 483
215, 796-805. (doi:10.1242/jeb.060103) 484
26. Israelowitz M, Rizvi SHW, von Schroeder HP. 2007 Fluorescence of the “fire-chaser” 485
beetle, Melanophila acuminate. J. Lumin. 126, 149-154. (doi:10.1016/j.jlumin.2006.06.017) 486
27. Pavan M, Vachon M. 1954 Sur l'existence d'une substance fluorescente dans les 487
téguments des Scorpions (Arachnides). C. R. Acad. Sci. Paris 239, 1700-1702. 488
28. Catala-Stucki R. 1959 Fluorescence Effects from Corals irradiated with Ultra-Violet Rays. 489
Nature 183, 949. (doi:10.1038/183949a0) 490
29. Phillips CES. 1927 Fluorescence of Sea Anemones. Nature 119, 747. 491
(doi:10.1038/119747c0) 492
30. Arnold KE, Owens IPF, Marshall NJ. 2002 Fluorescent Signaling in Parrots. Science 295, 493
92. (doi:10.1126/science.295.5552.92) 494
31. McGraw KJ, Toomey MB, Nolan PM, Morehouse NI, Massaro M, Jouventin P. 2007 A 495
description of unique fluorescent yellow pigments in penguin feathers. Pigm. Cell Res. 20, 496
301-304. (doi:10.1111/j.1600-0749.2007.00386.x) 497
32. Goodwin RH. Fluorescent substances in plants. 1953 Annu. Rev. Plant. Physiol. 4, 283-498
304. (doi:10.1146/annurev.pp.04.060153.001435) 499
33. Tani K, Watari F, Uo M, Morita M. 2004 Fluorescent Properties of Porcelain-Restored 500
Teeth and Their Discrimination. Mater. Trans. 45, 1010-1014. 501
(doi:10.2320/matertrans.45.1010) 502
34. Purcell EM. Spontaneous emission probabilities at radio frequencies. 1946 Phys. Rev. 503
69, 681. (doi:10.1103/PhysRev.69.674.2) 504
35. Yablonovitch E. 1987 Inhibited Spontaneous Emission in Solid-State Physics and 505
Electronics. Phys. Rev. Lett. 58, 2059-2062. (doi:10.1103/PhysRevLett.58.2059) 506
36. John S. 1987 Strong Localization of Photons in Certain Disordered Dielectric 507
Superlattices. Phys. Rev. Lett. 58, 2486-2489. (doi:10.1103/PhysRevLett.58.2486) 508
37. González-Urbina L, Pérez-Moreno J, Clays K, Kolaric B. 2016 Phosphorescence 509
emission from BAlq by forced intersystem crossing in a colloidal photonic crystal, Mol. Phys. 510
114, 2248-2252. (doi:10.1080/00268976.2016.1194495) 511
38. González-Urbina L, Baert K, Kolaric B, Pérez-Moreno J, Clays K. 2012 Linear and 512
Nonlinear Optical Properties of Colloidal Photonic Crystals. Chem. Rev. 112, 2268-2285. 513
(doi:10.1021/cr200063f) 514
39. Kumazawa K, Tanaka S, Negita K, Tabata H. 1994 Fluorescence from Wing of Morpho 515
sulkowskyi Butterfly. Jpn. J. Appl. Phys. 33, 2119-2122. (doi:10.1143/JJAP.33.2119) 516
40. Lawrence C, Vukusic P, Sambles R. 2002 Grazing-incidence iridescence from a butterfly 517
wing. Appl. Optics 41, 437-441. (doi:10.1364/AO.41.000437) 518
41. Vigneron JP, Kertész K, Vértesy Z, Rassart M, Lousse V, Bálint Zs, Biró LP. 2008 519
Correlated diffraction and fluorescence in the backscattering iridescence of the male butterfly 520
Troides magellanus (Papilionidae). Phys. Rev. E 78, 021903. 521
(doi:10.1103/PhysRevE.78.021903) 522
42. Van Hooijdonk E, Barthou C, Vigneron JP, Berthier S. 2011 Detailed experimental 523
analysis of the structural fluorescence in the butterfly Morpho sulkowskyi (Nymphalidae). J. 524
Nanophotonics 5, 053525. (doi:10.1117/1.3659147) 525
43. Van Hooijdonk E, Berthier S, Vigneron JP. 2012 Bio-inspired approach of the 526
fluorescence emission properties in the scarabaeid beetle Hoplia coerulea (Coleoptera): 527
Modeling by transfer-matrix optical simulations. J. Appl. Phys. 112, 114701. 528
(doi:10.1063/1.4768896) 529
44. Van Hooijdonk E, Vandenbem C, Berthier S, Vigneron JP. 2012 Bi-functional photonic 530
structure in the Papilio nireus (Papilionidae): modeling by scattering-matrix optical 531
simulations. Opt. Express 20, 22001-22011. (doi:10.1364/OE.20.022001) 532
45. Van Hooijdonk E, Barthou C, Vigneron JP, Berthier S. 2012 Angular dependence of 533
structural fluorescent emission from the scales of the male butterfly Troïdes magellanus 534
(Papilionidae). J. Opt. Soc. Am. B 29, 1104-1111. (doi:10.1364/JOSAB.29.001104) 535
46. Van Hooijdonk E, Berthier S, Vigneron JP. 2012 Contribution of both the upperside and 536
the underside of the wing on the iridescence in the male butterfly Troïdes magellanus 537
(Papilionidae). J. Appl. Phys. 112, 074702. (doi:10.1063/1.4755796) 538
47. Van Hooijdonk E. 2012 Etude théorique et expérimentale de la fluorescence de 539
structures photoniques naturelles. Ph.D. thesis - Facultés Universitaires Notre-Dame de la 540
Paix (FUNDP) and Université Pierre et Marie Curie (Paris VI), Namur & Paris. 541
48. Van Hooijdonk E, Barthou C, Vigneron JP, Berthier S. 2013 Yellow structurally modified 542
fluorescence in the longhorn beetles Celosterna pollinosa sulfurea and Phosphorus 543
virescens (Cerambycidae). J. Lumin. 136, 313-321. (doi:10.1016/j.jlumin.2012.12.022) 544
49. Mason CW. 1927 Structural Colors in Insects. II. J. Phys. Chem. 31, 321-354. 545
(doi:10.1021/j150273a001) 546
50. Vigneron JP, Colomer JF, Vigneron N, Lousse V. 2005 Natural layer-by-layer photonic 547
structure in the squamae of Hoplia coerulea (Coleoptera). Phys. Rev. E 72, 061904. 548
(doi:10.1103/PhysRevE.72.061904) 549
51. Deparis O, Mouchet SR, Dellieu L, Colomer JF, Sarrazin M. 2014 Nanostructured 550
surfaces: Bioinspiration for transparency, coloration and wettability. Mater. Today Proc. 1S, 551
122-129. (doi:10.1016/j.matpr.2014.09.008) 552
52. Vukusic P, Sambles JR, Lawrence CR, Wootton RJ. 1999 Quantified interference and 553
diffraction in single Morpho butterfly scales. Proc. R. Soc. Lond. B 266, 1403-1411. 554
(doi:10.1098/rspb.1999.0794) 555
53. Sollas IBJ. 1907 On the Identification of Chitin by Its Physical Constants. Proc. R. Soc. 556
Lond. B 79, 474-484. (doi:10.1098/rspb.1907.0042) 557
54. Berthier S, Charron E, Da Silva A. 2003 Determination of the cuticle index of the scales 558
of the iridescent butterfly Morpho menelaus. Opt. Commun. 228, 349-356. 559
(doi:10.1016/j.optcom.2003.10.032) 560
55. Leertouwer HL, Wilts BD, Stavenga DG. 2011 Refractive index and dispersion of butterfly 561
chitin and bird keratin measured by polarizing interference microscopy. Opt. Express 19, 562
24061-24066. (doi:10.1364/OE.19.024061) 563
56. Yoshioka S, Kinoshita S. 2011 Direct determination of the refractive index of natural 564
multilayer systems. Phys. Rev. E 83, 051917. (doi: 10.1103/PhysRevE.83.051917) 565
57. Yeh P. 2005 Optical Waves in Layered Media. Wiley-Interscience, Hoboken. 566
58. Taflove A, Hagness SC. 2000 Computational Electrodynamics: The Finite-Difference 567
Time-Domain Method. Artech, Norwood. 568
59. Oskooi AF, Roundy D, Ibanescu M, Bermel P, Joannopoulos JD, Johnson SG. 2010 569
MEEP: A flexible free-software package for electromagnetic simulations by the FDTD 570
method. Comp. Phys. Commun. 181, 687-702. (doi:10.1016/j.cpc.2009.11.008) 571
60. Vandenbem C. 2006 Contribution à l’étude de la réflectance et du confinement des 572
modes dans les systèmes optiques stratifiés. Ph.D. thesis - Facultés Universitaires Notre-573
Dame de la Paix (FUNDP), Namur. 574
61. Nikolaev IS, Vos WL, Koenderink AF. 2009 Accurate calculation of the local density of 575
optical states in inverse-opal photonic crystal. J. Opt. Soc. Am. B 26, 987-997. 576
(doi:10.1364/JOSAB.26.000987) 577
62. Deparis O, Vandenbem C, Rassart M, Welch VL, Vigneron JP. 2006 Color-selecting 578
reflectors inspired from biological periodic multilayer structures. Opt. Express 14, 3547-3555. 579
(doi:10.1364/OE.14.003547) 580
63. Barnes WL. 1998 Fluorescence near interfaces: the role of photonic mode density. J. 581
Modern Opt. 45, 661-699. (doi:10.1080/09500349808230614) 582
64. Kolaric B, Desprez S, Brau F, Damman P. 2012 Design of curved photonic crystal using 583
swelling induced instabilities. J. Mater. Chem. 22, 16205-16208. (doi:10.1039/C2JM32997B) 584
586
Figure 1 The male H. coerulea beetle displays a vivid violet-blue iridescent colour (a) due to a porous multilayer structure 587
located in the scales covering its elytra and thorax. The photonic structure is a periodic stack of thin pure cuticle layers and 588
mixed air-cuticle porous layers (b,c). In the structural model used for simulations, the layers comprising a mixture of air (in the 589
pores) and cuticle material (associated with the rods) were approximated by homogeneous layers with an effective refractive 590
index (RI) (d). 591
Figure 2 Colour and fluorescence changes of the scales of the male H. coerulea beetle induced by contact with water. 592
Illuminated by visible white light (at normal incidence and detection), the beetle scales appear violet-blue in the dry state (a) and 593
green in the wet state (b). The reflectance peak wavelength shifts from 458 nm to 525 nm when the elytron is in contact with 594
water (c). Under UV light (with a 45° incidence and detection angle), the scales produce a turquoise coloured emission in the 595
dry state (d) and a dark blue colour in the wet state (e). Where scales overlap, the fluorescence intensity is higher. This effect is 596
due to the transparency of the scales at the emitted wavelengths. Although there is almost no water-induced change in the 597
excitation spectrum peak wavelength and its associated FWHM, the emission spectrum peak wavelength shifts from 463 nm to 598
446 nm when the elytron is in contact with water. The associated FWHM reduces from 121 nm to 105 nm (f). 599
Figure 3 Reflectance spectra calculated for the modelled photonic structure of a male H. coerulea beetle (Figure 1c) using 600
unpolarised light at normal incidence. The reflectance peak centre wavelength shifts from 461 nm to 501 nm when the structure 601
changes from dry (blue curves) to wet (green curve) state and the reflectance peak intensity decrease (a). The related photonic 602
band structure and density of optical states (DOS) are also modified accordingly (b and c). The reflectance peak widths and the 603
PhBG widths decrease in the wet state. 604
Figure 4 When the pores of the modelled photonic structure are filled with water, the peak emission wavelength shifts from 605
480 nm to 428 nm (a) and from 429 nm to 416 nm (b) in the cases of both investigated models. a) In the first model, emitting 606
planar sources are assumed to be located in the different pure cuticle layers of the photonic structure. The presented spectra 607
result from the averages over 12 simulated spectra that individually correspond to fluorophores located in each of the 12 pure 608
cuticle layers. b) In the second model, the fluorophores are assumed to be 180 point sources distributed across the photonic 609
structure. 610
612
Dry state Wet state
Emission wavelength
(nm) Decay time τ (ns)
Standard error (SE)
(ns) Decay time τ (ns)
Standard error (SE) (ns) 466 3.9 0.55 1.4 0.04 0.79 0.02 546 1.9 0.05 1.4 0.04
Table 1 Decay times and the related standard errors of the fluorophores embedded in H. coerulea beetle’s scales in both dry 613
and wet states inside (466 nm) and outside (546 nm) the PhBG of the structure. The incident light formed a 45° angle with the 614
direction normal to the sample surface, with a wavelength equal to 376 nm. The emitted light was detected at a 45° angle on the 615
other side of the normal direction. 616
The male H. coerulea beetle displays a vivid violet-blue iridescent colour (a) due to a porous multilayer structure located in the scales covering its elytra and thorax. The photonic structure is a periodic stack of
thin pure cuticle layers and mixed air-cuticle porous layers (b,c). In the structural model used for simulations, the layers comprising a mixture of air (in the pores) and cuticle material (associated with the
rods) were approximated by homogeneous layers with an effective refractive index (RI) (d). Figure 1
Colour and fluorescence changes of the scales of the male H. coerulea beetle induced by contact with water. Illuminated by visible white light (at normal incidence and detection), the beetle scales appear violet-blue in the dry state (a) and green in the wet state (b). The reflectance peak wavelength shifts from 458 nm to 525 nm when the elytron is in contact with water (c). Under UV light (with a 45° incidence and detection angle), the scales produce a turquoise coloured emission in the dry state (d) and a dark blue colour in the wet state (e). Where scales overlap, the fluorescence intensity is higher. This effect is due to the transparency of the
scales at the emitted wavelengths. Although there is almost no water-induced change in the excitation spectrum peak wavelength and its associated FWHM, the emission spectrum peak wavelength shifts from 463 nm to 446 nm when the elytron is in contact with water. The associated FWHM reduces from 121 nm to
105 nm (f). Figure 2
Reflectance spectra calculated for the modelled photonic structure of a male H. coerulea beetle (Figure 1c) using unpolarised light at normal incidence. The reflectance peak centre wavelength shifts from 461 nm to 501 nm when the structure changes from dry (blue curves) to wet (green curve) state and the reflectance peak intensity decrease (a). The related photonic band structure and density of optical states (DOS) are also
modified accordingly (b and c). The reflectance peak widths and the PhBG widths decrease in the wet state. Figure 3
When the pores of the modelled photonic structure are filled with water, the peak emission wavelength shifts from 480 nm to 428 nm (a) and from 429 nm to 416 nm (b) in the cases of both investigated models.
a) In the first model, emitting planar sources are assumed to be located in the different pure cuticle layers of the photonic structure. The presented spectra result from the averages over 12 simulated spectra that individually correspond to fluorophores located in each of the 12 pure cuticle layers. b) In the second model,
the fluorophores are assumed to be 180 point sources distributed across the photonic structure. Figure 4