HAL Id: tel-01985756
https://tel.archives-ouvertes.fr/tel-01985756
Submitted on 18 Jan 2019
HAL is a multi-disciplinary open access archive for the deposit and dissemination of sci-entific research documents, whether they are pub-lished or not. The documents may come from teaching and research institutions in France or abroad, or from public or private research centers.
L’archive ouverte pluridisciplinaire HAL, est destinée au dépôt et à la diffusion de documents scientifiques de niveau recherche, publiés ou non, émanant des établissements d’enseignement et de recherche français ou étrangers, des laboratoires publics ou privés.
Propriétés optiques de nanorubans et boites quantiques
de graphène
Shen Zhao
To cite this version:
Shen Zhao. Propriétés optiques de nanorubans et boites quantiques de graphène. Matière Con-densée [cond-mat]. Université Paris Saclay (COmUE), 2018. Français. �NNT : 2018SACLN032�. �tel-01985756�
Acknowledgments
At the time of finishing this manuscript, I would like to in several lines thank all the people who helped me and supported me during my thesis.
First of all, I would like to thank Jean-S´ebastian Lauret, my thesis supervisor. Actu-ally I have done a 6-month bachelor internship in this group, which is my first experience of research. This experience let me know how charming the research is. Since then I made up my mind to continue to do research and finally I spent an exciting 3-year PhD thesis. Many inspiring scientific discussions with him and his encourage and patience made me enjoy working in the group and his support was determining in the success of my thesis. I would say I will never regret for making this decision.
The other person who played a major role during my thesis is Loic Rondin. He gave me the most valuable advice in my daily work. His huge passion for science and enthusiasm for the experiments really impressed me and encouraged me. It certainly was a pleasure to work with him.
Besides, I wish to express my deep gratitude to all my colleagues at Laboratoire Aim´e Cotton: G´eraud, Lucile, Ferdinand, Paul, Timoth´ee, Loic, Baptiste, Magarita, Thomas, Luis, Feriel... And of course, I would like to thank all staff of the lab.
I was very happy to be able to collaborate with the team of St´ephane Campidelli, at CEA Saclay and the team of Christophe Voisin, at LPA. I would like here to name a few people who were particularly helpful: Julien, Christophe and Th´eo.
I will also thank Vincent Jacques and Stephanie Reich to have accepted to be the referee of my manuscript, as well as Andrew Mayne and Costanza Toninelli for their presence in the jury as examiners.
Since life is not only about the work, I would like to thank my friends: Yang, Yue, Xujun, Yifan, Hui Especially the gaming, basketball and cooking time with them make me feel energetic.
Finally, I really want to thank my parents for their love and the outstanding educa-tion they offered to me.
Many thanks also to everybody I might have unintentionally forgotten to mention here.
Contents
Preface
8
I
Introduction: GQDs and GNRs
11
1 Opening a bandgap from graphene 12
1.1 Tight-binding model of graphene . . . 12
1.2 Zone folding approximation for GNRs and GQDs . . . 15
2 Tuning the electronic properties 17
2.1 Tuning through size control . . . 17 2.2 Tuning through edge control . . . 18
3 Synthesis methods 19
3.1 Top-down fabrications . . . 19 3.2 Bottom-up syntheses . . . 20 4 Characterization results on bottom-up synthesized GNRs and GQDs 24 4.1 Characterization of chemical structure . . . 24 4.2 Characterization of electronic properties . . . 27 4.3 Characterization of optical properties . . . 29
5 Conclusion and objective of thesis 36
II
Experimental techniques
37
1 Technique employed for ensemble measurements 38
1.1 Optical absorption spectroscopy . . . 38 1.2 Photoluminescence spectroscopy . . . 39 1.3 Time-resolved photoluminescence . . . 41
2 Technique employed for single-object measurements 44
2.1 Microphotoluminescence - scanning confocal microscopy . . . 44 2.2 Second-order photon correlation measurements . . . 50
2.3 Time tagged time-resolved (TTTR) measurements . . . 57
2.4 Atomic force microscope . . . 58
3 Sample preparation 61 3.1 Suspension preparation . . . 61
3.2 Spin coating . . . 63
III
Optical study of bottom-up synthesized GNRs
65
1 Optical study of solution-mediated synthesized GNRs 66 1.1 General sample information . . . 661.2 Optical spectroscopy on 4-CNR and p-ANR suspensions . . . 68
1.3 Discussion on the origin of emission . . . 73
1.4 Single-particle measurements on p-ANRs . . . 76
1.5 Summary on the results of solution-mediated synthesized GNRs . . . 79
2 Bandgap engineering of GNRs by controlled structure distortion 79 2.1 Structural distortion induced by side chain installment . . . 79
2.2 Optical spectroscopy on distorted and non-distorted 6CNRs . . . 82
3 Optical study of on-surface synthesized GNRs 84 3.1 General sample information . . . 84
3.2 Structural quality analysis by Raman spectroscopy . . . 85
3.3 microphotoluminescence investigation . . . 88
3.4 Raman features in AGNRs . . . 93
IV
Optical study of bottom-up synthesized GQDs
103
1 General sample information 104 2 Optical spectroscopy on C96C12 dispersions 105 2.1 Absorption, PL and time-resolved PL measurements . . . 1052.2 Photoluminescence excitation measurements . . . 108
3 Optical study of single C96C12 GQDs 112
3.1 Microphotoluminescence spectroscopy of single C96C12 GQDs . . . 112
3.2 Photophysical properties of single C96C12 GQDs . . . 122
3.3 Analysis of photo-dynamics on a single C96C12 GQD . . . 129
3.4 Analysis photon statistics by waiting time distribution . . . 139
4 Optical study on C96Cl GQD 141 4.1 Optical spectroscopy on C96Cl dispersions . . . 141
4.2 Microphotoluminescence spectroscopy of C96Cl . . . 143
Conclusion and perspectives
147
8
Preface
Scientific context
Graphene, i.e. single layer of carbon atoms arranged in a honeycomb lattice, plays a very important part in the domain of nanoscience and nanotechnology. The first experimen-tal realization of graphene was done by Geim and Novoselov through the mechanical exfoliation of graphite in 2004 [1]. Since then, important studies have been done on graphene, revealing many intriguing properties. For example, it has been demonstrated that graphene shows quantum Hall effect even at room temperature [2,3]. Electron mobility of ⇠2.5 ⇥ 106 cm2/V·s has been measured on suspended graphene [4], 1000
times larger than standard silicon. Further, graphene transistors with an intrinsic cut-off frequency as high as 300 GHz has already been achieved [5]. These observations make graphene to be considered as a potentially revolutionary material for future electronic applications [6]. Besides, graphene has revealed other exceptional physical properties such as high thermal conductivity of 3000 − 5000 W/mK [7,8] ultrahigh Young’s modu-lus of ⇠1 TPa and intrinsic tensile strength of ⇠130 GPa [9], as well as high transparency of 97.7% to incident light for wide wavelength range [10,11]. Only 6 year after the first isolation of graphene, Geim and Novselov were awarded the Nobel Prize in Physics 2010 “for groundbreaking experiments regarding the two-dimensional material graphene”.
Despite all these fascinating results, graphene has a significant drawback that is the lack of a bandgap. Due to this, it is difficult to obtain a large enough on-off current ratio (Ion/Ioff) in a graphene field-effect transistor (FET) and thus limits its implementation in
conventional integrated logic circuits [6]. Moreover, since graphene has no bandgap, when it is excited by light, the induced carriers rapidly relax to the bottom of the band with no energy left. It thus limits its use as light harvesting devices such as photodetectors and solar cells.
Various strategies have been investigated to open a gap in graphene. For exam-ple, it has been demonstrated that by applying a perpendicular electric field on bilayer graphene, the bandgap can be tuned up to 0.25 eV [12]. However, this value only corre-spond to an Ion/Ioff ratio of ⇠103, much less than the required 106 for operating digital
logic devices [13]. Moreover, the preparation of bilayer graphene with the required A-B stacking style is relatively complicated, limiting the practicability of such method. Chem-ical modifications of graphene (n-type doping by potassium [14], hydrogenation [15] and fluorination [16]) have also been able to open a gap, but at the same time, the electron mobility is severely degraded. Besides, application of uni-axial strain on graphene has been proposed for opening a bandgap [17]. However, to obtain a rational bandgap a global uni-axial strain of 20% is required, which makes it impractical.
Compared to the approaches described above, reduction in the dimensionality of graphene in the form of 1D graphene nanoribbons (GNRs) and 0D graphene quantum dots (GQDs) as shown in Fig. 0.1 is extremely promising. Over the last decades, many theoretical studies have been performed on these two types of low dimensional graphene materials. It is predicted that GNRs and GQDs cannot only have a large bandgap but also display an exceptional degree of tunability of their optoelectronic properties. In principle, a widely tunable bandgap (from semi-metallic to several eV) and the presence or absence of correlated low-dimensional magnetism are determined by the size,
sym-10
and GNRs can be tuned by their structure. The two different synthesis approaches (top-down and bottom-up) are briefly described. Then the characterization results such as STM, XPS and Raman are shown, to suggest the defined structure obtained by the bottom-up approach. The results of optical study results on bottom-up synthesized GNRs and GQDs are also discussed. Finally, the potential applications of GNRs and GQDs are proposed.
Chapter II describes the different experimental techniques employed in this work: op-tical absorption spectroscopy, photoluminescence spectroscopy and time-resolved photo-luminescence for ensemble measurements. Atomic force microscope (AFM), micropho-toluminescence and second order photon correlation measurements for single-particle measurements. Finally this chapter describes the suspension preparation protocols as well as the sample preparation procedures for optical microscopy experiments.
Chapter III shows our optical characterization results on the bottom-up synthesized GNRs. In the first section of this chapter, I show the spectroscopy results on two different GNR structures synthesized via the solution-mediated method. I then discuss the nature of the observed emission. Some possible approaches to individualize GNRs are proposed. In the second section, I present our studies on the effect of strain on the optical properties of GNRs. Combing experimental and theoretical results, modulation of the bandgap of GNRs by controlling over the structural distortion is demonstrated. In the third section, I present our optical characterizations of GNRs synthesized by the on-surface approach. Since the grown metal surface is not suitable for the PL measurements, I first describe the transfer procedure to an insulated substrate. Then I present the microPL and AFM results on the transferred sample. We discuss the nature of the unexpected broad emission in the high-energy region. Finally, some distinct Raman features observed on GNRs is also discussed.
In Chapter IV, we study the optical properties of bottom-up synthesized GQDs. In the first part, we show the results of steady-state and time-resolved photoluminescence spectroscopy at ensemble level. These results imply that the individual GQDs are indeed present in the dispersion. In the second part, we go down to the single-particle level by performing microphotoluminescence spectroscopy. The nature of the observed emission from GQDs is discussed, implying that the emission originates from their intrinsic quan-tum states. Then a detailed study of photophysical properties including second order photon correlation g(2) measurements of GQDs is presented.
11
Part I
Introduction: GQDs and GNRs
Summary
1 Opening a bandgap from graphene 12
1.1 Tight-binding model of graphene . . . 12 1.2 Zone folding approximation for GNRs and GQDs . . . 15
2 Tuning the electronic properties 17
2.1 Tuning through size control . . . 17 2.2 Tuning through edge control . . . 18
3 Synthesis methods 19
3.1 Top-down fabrications . . . 19 3.2 Bottom-up syntheses . . . 20
4 Characterization results on bottom-up synthesized GNRs and
GQDs 24
4.1 Characterization of chemical structure . . . 24 4.2 Characterization of electronic properties . . . 27 4.3 Characterization of optical properties . . . 29
12 Opening a bandgap from graphene
Introduction
This chapter gives an overview of the state of the art knowledge on the properties of graphene nanoribbons (GNRs) and graphene quantum dots (GQDs), and also their synthesis methods. I will first describe the theoretical works performed on GNRs and GQDs. I will present in theory how the electronic properties of GNRs and GQDs are derived from those of graphene, and how their properties can be tuned via the control of the structure. Secondly, I will present the so-called bottom-up synthesis method, which allows producing GNRs and GQDs with defined structures. Finally, I will discuss the recent results on the structural and electronic characterizations, as well as optical measurements on bottom-up synthesized GNRs and GQDs.
1
Opening a bandgap from graphene
Graphene nanoribbons (GNRs) and Graphene quantum dots (GQDs) can be considered as one-dimensional and zero-dimensional graphene sheets, respectively. In analogy to single wall carbon nanotubes (SWCNTs) [20], the general electronic structure of GNRs and GQDs can be derived from the one-electron model of graphene by applying proper boundary conditions on the wave functions. This simple method is called zone-folding or confinement approximation.
1.1
Tight-binding model of graphene
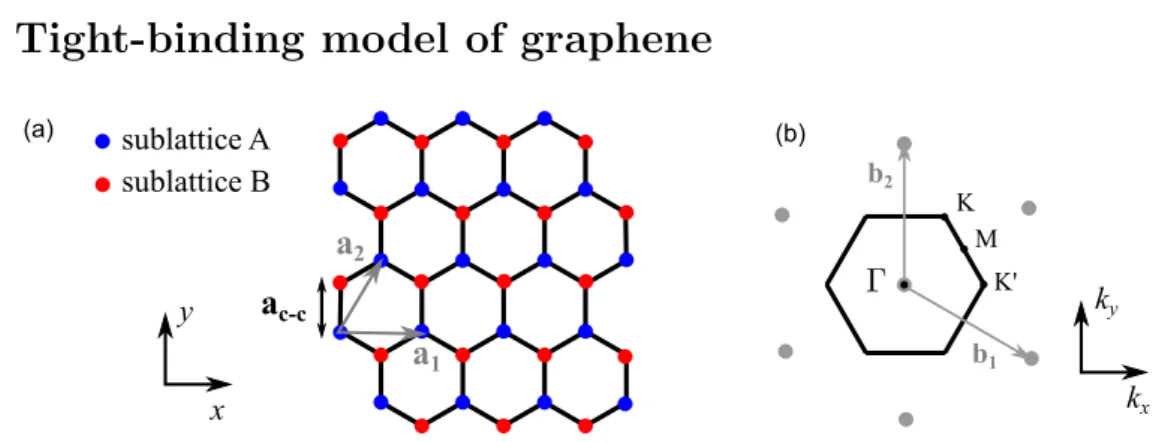
a1 a2 x y sublattice A sublattice B K' K M b2 (a) (b) b1 kx ky ac-c
Figure 1.1: (a) - Real-space graphene honeycomb lattice with the two sublattices A and B. a1 and a2 are its two primitive vectors with the norm a =
p
3aC-C = 0.246 nm. (b)
-Reciprocal lattice of graphene (grey dots) with b1 and b2 the two reciprocal primitive
vectors (grey arrows). Its first Brillouin zone (FBZ) is hexagonal (indicated by the black lines). High symmetry points are shown with black dots and labeled as Γ, M , K and K0, in which K and K0 are the two inequivalent corners.
In a graphene sheet, the carbon atoms arrange in a honeycomb network with a bond distance aC-C= 1.42 nm to their nearest neighbors (see Fig. 1.1). The honeycomb lattice
itself is not a Bravais lattice, but it can be considered as a triangular lattice with a basis of two two atoms A and B or two triangular (or hexagonal) sublattices made of atoms A and B, respectively (shown in blue and red). From a crystallographic point of view, A and B are different: atoms A have their nearest neighbors (atoms B) at 0◦, 120◦ and
1.1 - Tight-binding model of graphene 13
triangular lattice is generated by the primitive basis vectors a1 and a2 with
a1 = a 0 ! and a2 = 1 2a p 3 2 a ! (1.1) where the norm of the vectors a = p3aC-C = 0.246 nm.
For a triangular lattice in the real space, the reciprocal lattice is still triangular, which is rotated by 90◦ with respect to the real space one. The primitive basis vectors of the reciprocal lattice in momentum space are expressed as
b1 = 2π a 2π p 3a ! and b2 = 0 4π p 3a ! (1.2) As shown in Fig. 1.1 right, the first Brillouin zone (FBZ) of graphene is the Wigner-Seitz cell of the reciprocal lattice and has a hexagonal shape. It is characterized by four high symmetry points labeled as Γ, M , K and K0. We note that the two corner points K and
K0 are inequivalent, as they are not connected by a reciprocal lattice vector. We also
note that the four other corners of the Brillouin zone can be connected to one of these two points by a vector of the reciprocal lattice. Thus, we have three identical K points and three K0 at the corner. Following [21], the positions of K and K0 are given by the
vectors: K = 2π a 1 3 1 p 3 ! and K0 = 2π a 2 3 0 ! (1.3) As we will see later, these two points play an important role for the electronic properties of graphene.
Carbon atom possesses four valence electrons placed into four atomic orbitals: 2s, 2px, 2py and 2pz. In a graphene sheet, the s-orbitals and in-plane px,y-orbitals of the
carbon atoms hybridize to form a strongly bound σ bond (sp2 hybridization) with an
bond angle of 120◦. The non hybridized orbital 2p
z is perpendicular to this plane. The
combination of the pz orbitals of adjacent carbon atoms give rise to the π bond of
graphene. Since the bonding and anti-bonding σ bands are energetically well separated (⇠10 eV at the Γ point), it is sufficient to consider only the electrons in π bond to describe the electronic properties of graphene [22].
The band structure of graphene is commonly modeled using a one-electron tight-binding approach [23,24]. In such approach, the electron-electron interactions is ne-glected, as well as the curvature effect. Under these hypotheses, the global wavefunction of π electrons Ψ(r) can be expressed as [21]
Ψ(r) =X RA ΨA(RA)Φz(r − RA) + X RB ΨB(RB)Φz(r − RB) (1.4)
where Φz(r) is the wavefunction of the pz-orbital of a carbon atom located at the origin,
RAand RB are a lattice vector for the sublattice A and B, respectively. ΨAand ΨB are
the corresponding coefficients of Φz.
We further restrict the coupling to the nearest neighbor carbon atoms only. We denote the corresponding hopping energy γ0 and the three vectors τl, l = 1, 2, 3 that
14 Opening a bandgap from graphene
connect the nearest neighbor carbon atoms: τ1 = a 0 1 p 3 ! , τ2 = a −1 2 −2p1 3 ! and τ3 = a 1 2 −2p1 3 ! (1.5) Neglecting the atomic orbital wavefunction overlap between neighbor atoms A and B, we obtain the linear system for the eigenstates:
εΨA(RA) = −γ0 3 X l=1 ΨB(RA− τl) εΨB(RB) = −γ0 3 X l=1 ΨA(RB+ τl) (1.6)
Applying Bloch’s theorem, we decompose the coefficients ΨA,B in a product of a slowly
varying envelope and a planewave component of wavevector k:
ΨA,B(RA,B) = fA,B(k) exp(ik · RA,B) (1.7)
By combining Eq. 1.7 and 1.6 and performing straightforward simplifications, we obtain the following matrix equation:
✓ 0 hAB(k) hAB(k)⇤ 0 ◆ ✓ fA(k) fB(k) ◆ = ε ✓ fA(k) fB(k) ◆ (1.8) with hAB(k) = −γ0 3 X l=1 exp(−ik · τl) (1.9)
Solving the eigenvalue equation, we finally obtain the energy dispersion of the π electron in graphene: ε±(k) = ±γ0 s 1 + 4 cosakx 2 cos p 3aky 2 + 4 cos 2 akx 2 (1.10)
with the nearest neighbor hopping energy γ0 ⇡ 2.7 eV. The band structure of graphene
is thus obtained from this formula (Fig. 1.2). It is easily to see that, within the nearest-neighbor approximation, the band structure is symmetric with respect to the zero-energy plane. In addition, the lower band and the upper band touch at each K and K0 point at
the six corners of the Brillouin zone (i.e., K and K points), showing a six-fold rotation symmetry. In neutral graphene, the lower band is totally filled (valence band), while the upper band is completely empty. As a result, the Fermi Energy EF is located at the
touching points K and K0 of the two bands, which means E(K) = E(K0) = E
F = 0.
Graphene therefore has a zero bandgap, which is called a semi-metal.
Around the K and K0 points. The wavevector k can be rewritten as: k = K(0)
+ δk, if |δk|a << 1. In this condition, the first order Taylor development of the dispersion relation Eq. 1.10 is
E(K + δk) = E(K0+ δk) ' ±γ0
p 3a
2 |δk| (1.11)
So we can see that the dispersion relation is linear with δk around the Fermi level. In contrast, for classical solid, the dispersion is parabolic. This linear dispersion makes the
1.2 - Zone folding approximation for GNRs and GQDs 15
electrons behave as massless relativistic particles, leading to many remarkable electronic properties, e.g. high electron mobility [4,25] and quantum fermion properties [3,26]. One should note that since the dispersion relation is identical near the two inequivalent K and K0 points, for the electrons with energy close to the Fermi level there is a
double degenerated state. Therefore, in addition to the spin, electrons in graphene has an additional degree of freedom called valley degree of freedom (K and K0 valley).
Figure 1.2: Band structure of graphene displayed in a 2-dimensional representation (left) and 1-dimensional cut along the main direction (right). Adapted from [21].
1.2
Zone folding approximation for GNRs and GQDs
For infinite size 2D graphene sheet, the wavevector k can vary continuously in the first Brillouin zone. For GNRs and GQDs, due to the presence of boundary conditions (π-electron wave functions on the edges vanish), the wavevectors were further quantized to fulfill the boundary conditions. As a first approximation, the dispersion relations of GNRs and GQDs can be obtained by using the graphene band structure and restricting it to the values of k that respect the boundary conditions. This simple method is called zone-folding approximation, and has been used to interpret the electronic structure of carbon nanotubes [20]. A rm ch a ir Zigzag
Figure 1.3: Two basic edge structures of nanoscale graphene.
Generally, the edge structure of GNRs and GQDs can be classified into armchair and zigzag types (see Fig. 1.3). According to the edge structure, the way to quantitize wavevector k is different and thus the electronic structure is different. We will first look at the electronic structure for armchair edge GNRs and GQDs. For armchair GNRs and GQDs, all the π electrons are paired, thus the total spin is equal to zero and they have a quasi-particle bandgap.
2.1 - Tuning through size control 17
(a) (b)
Figure 1.5: (a) - Schematic illustration of triangular shap armchair GQD. (b) - Schematic illustration of the one half of the hexagonal Brillouin zone of 2D graphene sheet. The Dirac cone of the conduction and valence bands of graphene are shown in blue and light blue, respectively. The dots are the allowed k values of triangular GQDs with armchair edges, which are also projected onto the Dirac cone. Adapted from [29,30].
2
Tuning the electronic properties
It is easy to see that depending on the structure of GNRs or GQDs, the boundary conditions will be different and thus the electronic properties will be different. In this section, I will show several ways to tune the electronic properties of GNRs and GQDs, which are proposed by theoretical calculations.
2.1
Tuning through size control
The electronic structure of GNRs and GQDs displays a remarkable dependence on their size. For armchair GNRs, we have seen that the band structure of N -AGNRs can be pictured as a series of cutting lines across the band structure of graphene at N equidis-tant k? values and these cutting lines are given by Eq. 1.12. As the bandgap of graphene vanishes at the K points, the closer those cutting lines get to the K point, the lower the bandgap of the AGNR will be. From Fig. 1.4 - (b) we can see that by doing the 1D-projection, the K and K0 are located at k
? = 13 2π a and k? = 2 3 2π a , respectively. The
factor 3 in the denominator classify the AGNRs into three families: AGNR with N equal to 3p, 3p + 1 or 3p + 2 with p an integer, where N is the number of carbon atoms across the width (Fig. 1.4 - (a)). From Eq. 1.12, we can see that for the 3p + 2 family there is always a cutting line going through the K point. Thus, as a first approximation, this family has a zero bandgap. In contrast, for the other two families, there are no cutting lines across the K point. Moreover, the wider the AGNR, the higher value of N , thus the smaller the spacing between the cutting lines and the closer it gets to the K point. As a result, the bandgap is inversely proportional to the width of the ribbon, within each family1 (see Fig. 2.1 - (a)). One should note that by increasing the ribbon width
by just one atom, the electronic properties of GNRs are deeply modified, which implies the importance of the fabrication of GNRs with a atomic precision.
1We should note that this tight-binding approach assumes the carbon atoms are equivalent
through-out the GNR. As a results, the 3p and 3p+1 families follow a very similar trend and are semiconducting, while the 3p + 2 family are all metallic. However, this assumption is inaccurate for the carbon atoms closer to the edge. Taking into account for the bond length distortions and the associated changes in the hopping energy γ0, the resulting bandgap values would be changed a lot: opening of a bandgap for
the 3p + 2 family, as well as an obvious splitting of the bandgap trends between 3p and 3p + 1 families. A more refined ab initio calculations thus revealed a relation of Eg(3p + 1) > Eg(3p) > Eg(3p + 2) of
18 Tuning the electronic properties
(a) (b)
Figure 2.1: (a) - Values of bandgap as a function of the width of armchair GNRs (AG-NRs), which are obtained from zone-folding approximation. According to the number of carbon atoms across the width, the AGNRs can be classified into three families: 3p, 3p + 1 and 3p + 2, showing different trend of bandgap. Adapted from [31]. (b) - Values of bandgap of armchair GQDs as a function of their size (number of C atoms), showing an inverse-square-root relation. Adapted from [32].
For armchair GQDs, according to Eq. 1.13 and 1.14, the states at K point are not allowed. Thus the armchair GQDs always have a non-zero bandgap. In [32], the authors performed an analytic calculations on the hexagonal armchair edge GQDs by a combination of tight-binding approach with a self-consistent Hartree-Fock method (TB-HF). They found that the bandgap values of hexagonal GQDs deduced from their calculations are very similar to the ones obtained by the zone-folding approximation for the triangular GQDs with a similar number of sp2 carbon atoms. For example, for
C222 hexagonal GQD, their calculation leads to Eg = 0.42γ0, where γ0 is the hopping
energy, while using Eq. 1.15 the obtained bandgap value of C216 triangular GQD is Eg ⇡ 0.46γ0. This shows that the zone-folding approximation is a relatively efficient
approach to predict the bandgap of armchair GQDs. Moreover, the authors indicated that the bandgap of armchair GQDs follows a 1/pn scaling, with n the total number of sp2 carbon atoms (see Fig. 2.1 - (b)).
2.2
Tuning through edge control
As seen from fig. 1.3, GNRs and GQDs can have the so-called zigzag typed edge. Such zigzag GNRs and GQDs have unpaired π electrons present at their edges, which results in the appearance of localized edge states within the bandgap [33,34]. Moreover, due to the presence of unpaired electrons, the total spin of zigzag GNRs and GQDs are non-zero, giving rise to many peculiar spin properties. For example, zigzag GNRs are predicted to show ferromagnetic ordering at each zigzag edge and anti-parallel spin orientation in between [35](see Fig. 2.2 - (a)). By combining alternated zigzag and armchair segments along the ribbon edges, i.e. the chiral edge GNRs (see Fig. 2.2 - (b)), it is possible to further modulate the spin properties of GNRs. Similarly, by designing the shape of zigzag GQDs, their spin properties can also be modulated [36]. These make zigzag GNRs and GQDs very promising for potential applications in spintronics.
3.1 - Top-down fabrications 19
In addition to the size and edge structure of GNRs and GQDs, some external pa-rameters such as doping [37,38], strain [39] and heterostructure formation [40] are also predicted to be able to tune their electronic properties. However, to realize such fine tunability, it is essential to fabricate GNRs and GQDs in a controlled manner and with an atomic precision.
(a) (b) Chiral GNR
Figure 2.2: (a) - Zigzag GNR predicted to show ferromagnetic ordering at each zigzag edge and anti-parallel spin orientation in between. Adapted from [41]. (b) - Schematic illustration of chiral GNRs, which displays an alternative zigzag and armchair segments along the edges. The spin properties of chiral GNRs are thus different from both armchair and zigzag GNRs. Adapted from [39].
3
Synthesis methods
3.1
Top-down fabrications
Fabrication of GQDs and GNRs has been previously performed through top-down meth-ods. This kind of fabrication method can be likened to sculpting from a block of stone. A piece of the base material is gradually eroded until the desired shape is achieved.
As seen from Fig. 3.1 - (a), GQDs can be carved from graphene sheets by means of electron beam lithography. In such approach, by designing the PMMA masks, GQDs with desired geometries can be produced with diameter down to 10 nm. Pono-marenko et al. [42] have revealed a confinement bandgap up to 0.5 eV from the GQDs fabricated by this technique. However, nanolithography requires a relative complex pro-cesses that hinder applying this technique to a large scale fabrication of GQDs. Due to the irregularities in PMMA, GQDs with diameter smaller than 10 nm cannot be reliably fabricated, and moreover the edge structure can neither be controlled. Another top-down method is the solution-based chemical approaches, which can produce GQDs in a large scale. For instance, GQDs can be derived from carbon fibers [43], graphenes [44], double-walled carbon nanotubes [45] and fullerenes (C60) [46,47], by cutting these materials via acid or oxidation treatments (Fig. 3.1 - (b)). The GQDs fabricated by these chem-ical approaches could have a diameter down to several nm with a very good solubility in water and strong photoluminescence, showing the potentials in bioimaging [43] and light-emitting diodes (LEDs) [48]. However, these GQDs obviously do not have a defined structure and severely present defects, which makes it impossible to get access to the intrinsic properties predicted by theoretical calculations.
20 Synthesis methods
Similarly, GNRs can be fabricated by cutting of graphene sheets and unzipping of carbon nanotubes (CNTs) (Fig. 3.1 - (c)). Li et al. [49] have shown that by sonicating expanded graphite in PmPV conjugated polymer solution, GNRs with various widths between (±2-60 nm) were obtained. The narrowest 2 nm-wide GNR exhibited a bandgap of about ⇠0.4 eV and an on-off ratio of 106 in a FET configuration. One should note
that the width of GNRs resulting from this sonochemical method is not uniform. It is also possible to fabricate uniform GNRs by patterning graphene sheets with nanolithog-raphy techniques, e.g. scanning tunneling microscope lithognanolithog-raphy [50], electron-beam lithography, helium-ion-beam lithography and plasma etching [51]. Similar to the case of GQDs, nanolithography can produce GNRs with width only down to 10 nm. In ad-dition to cutting of graphene, unzipping of CNTs can produce GNRs by solution-based oxidation treatment [52] as well as through plasma etching with PMMA films [53]. Using such approaches, the produced GNRs can have apparently smooth edges and with width between 10-30 nm, showing charge-carrier mobility up to 1500 cm2/V.s. [52].
Neverthe-less, smooth edges produced by top-down methods are not precise at the atomic level, i.e. there could be undefined structural disorders and defects of 1 nm or more.
As we have seen in the previous section, GNRs and GQDs are predicted to have an exceptional degree of tunability of their electronic, optical and even magnetic properties via the controlling of the structure, especially when their size and/or width are as narrow as 1-3 nm. To study the link between their intrinsic properties and structure, and eventually engineer the properties in a accurate and reproducible way for optoelectronic and spintronic applications, it is essential to produce nanometer-width/size GNRs and GQDs with an atomic precision. However, realizing such structural precision by means of top-down methods is still highly challenging.
(a)
(b) (c)
Figure 3.1: Top-down fabrication methods of GNRs and GQDs, including cutting from graphene sheets by lithography (a), solution based oxidation of carbon fibers (b) and unzipping of carbon nanotubes (c). Adapted respectively from [54], [43] and [55].
3.2
Bottom-up syntheses
To this end, bottom-up organic synthesis method appears very promising. This method can be likened to building a brick house. Here small molecular precursors (as the bricks)
3.2 - Bottom-up syntheses 21
react in a selective way to obtain final assembled GQDs or GNRs (the house). In princi-ple, by appropriately designing the molecular precursors, it is possible to obtain GQDs and GNRs with desired structure (see Fig. 3.2).
Figure 3.2: Schematic illustration of the principle of bottom-up synthesis method. Adapted from [56].
In-solution approach
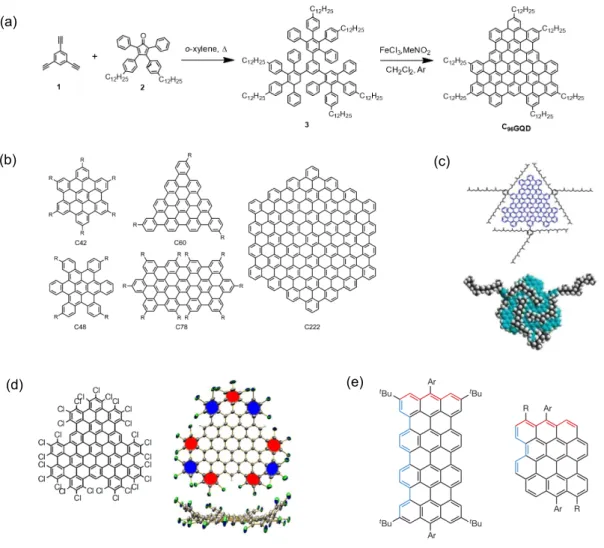
As shown in Fig. 3.3 - (a), the bottom-up synthesis of GQDs typically consits in a two-step solution-based chemical reaction route: 1. polymerization of the molecular pre-cursors into intermediate oligophenylenes or polyphenylenes. 2. oxidative intramolecular cyclodehydrogenation (graphitization) of the tailor-made polyphenylenes. A variety of GQDs with defined molecular structures have thus been obtained, ranging from small nanographene molecules such as hexaperi-hexabenzocoronene (HBC, C42) to a larger hexagonal GQD with 222 sp2 carbons and a diameter of ⇠3 nm (C222) [57] (see Fig. 3.3
- (b)
for some examples).2 Since GQDs tends to stack together due to the strong π-π
interactions, alkyl chains are usually installed at the peripheral positions of GQDs to increase the steric hindrance and enhance the solubility. Further edge functionalizations with complex structures have also been reported. Yan et al. have shown the attaching of trisubstituted phenyl groups on the edge of two large GQDs (132 and 168 conjugated carbon atoms) [59]. In this way, the GQDs are expected to be shielded from one an-other in three dimensions, reducing the aggregation effect (Fig. 3.3 - (c)). More recently, atomic precise edge chlorination of GQDs has also been realized [60]. Since the chlo-rine atoms induce severe steric hindrance, the edge-chlorinated GQDs are non-planar (Fig. 3.3 - (d)) and thus show enhanced solubility. The vast majority of synthesized GQDs have armchair edges as they are chemically stable, but an increasing number of zigzag-edged structures exhibiting distinct properties have recently been reported. For instance, quateranthene (Fig. 3.3 - (e) left), which can be regarded as a short segment of 8-ZGNR, has been synthesized in 2013 [61]. Analyses of this structure revealed indeed the presence of unpaired electrons localized at the zigzag edges as well as ferromagnetic correlation at room temperature. However, such nanographene molecules with zigzag 2Unfortunately, the concept of planarizing large oligophenylene precursors to obtain GQDs reaches
its limit in solution. Partial cyclodehydrogenation will occur when the size of target GQD is bigger C222, because of poor solubility of precursors, as well as a mismatching of topology for large oligophenylene precursors [58].
22 Synthesis methods
edges are often prone to oxidation due to the unpaired electrons, which limits their fur-ther investigation and applications. Stable nanographene molecules with zigzag edges but no biradical ground states have also been synthesized. For example, dibenzo[hi,st] ovalene (DBO) (Fig. 3.3 - (e) right) is highly stable under ambient conditions and ex-hibits strong red emission [62].
(a)
(b)
(d)
(c)
(e)
Figure 3.3: (a) - Typical reaction route for producing bottom-up synthesized GQDs.
Adapted from [63]. (b) - Examples of bottom-up synthesized armchair-edge GQDs
(nanographene molecules). Adapted from [64]. (c) - Edge functionalized GQD with
trisubstituted phenyl groups, which fully shield the aromatic core. Adapted from [59]. (d) - Edge-chlorinated GQD, showing non planar structure. (e) - Nanographene molecules with zigzag-typed edges (shown in red). Left: with a biradical ground state. Right: with-out biradical ground state. Adapted from [61] and [62], respectively.
This bottom-up synthesis can be further applied to produce longitudinally extended GNRs. Similarly to the synthesis of GQDs, the synthesis of GNRs is also based on such in-solution two-step reaction (polymerization and graphitization). There are several different polymerization methods to obtain the intermediate polyphenylenes, for example Diels-Alder [65], Yamamoto [66] and Suzuki [67] polymerizations. These polymerization methods can efficiently prepare appropriate polymer precursors and led to a variety of GNR structures. Among these methods, the DielsAlder polymerization of an AB-type monomer (a cyclopentadienone moiety as the diene and an ethynyl group as the dienophile) could produce polyphenylenes with extremely high molecular weight (up
3.2 - Bottom-up syntheses 23
to 60 kg/mol), which lead to the final GNRs with a width of around 1 nm and an average length >100 nm (Fig. 3.4 - (a)) [65]. Such solution-based synthesis approach is highly scalable, and it has been shown to be possible to prepare over 1 g of GNRs in the laboratory, suggesting the potential for industry-scale production [68]. Moreover, based on the structural defined GNRs, people have also attempted to perform edge functionalization and now it is possible to precisely graft a variety of groups at the edges of GNRs, such as chlorine atoms [60], poly(ethylene oxide) (PEO) chains [69], naphthalene/perylene monoimide [70], porphyrin [71] and more recently a type of spin-bearing radical groups [72], which open the ways to realize the coherent coupling between molecule structures and GNR aromatic cores. One should note that the solution-phase synthesis method finally affords GNRs in powder form. Since the aromatic size of GNRs is much larger than GQDs, they are more difficult to be processed. GNR powders can be dispersed in aqueous surfactants or organic solvents by means of mild sonication. However large portions of the powders often remain undispersed.
(a)
(b)
(c)
(d)
(e)
Figure 3.4: (a) - In-solution AB-type Diels-Alder polymerization leads to long graphene nanoribbons. Adapted from [65]. (b) - On-surface reaction scheme for the synthesis of straight GNRs from dihalogen substituted molecular precursors. Adapted from [18]. (c) - In situ high-resolution STM image of on-surface synthesized GNRs, showing the defined and uniform GNR sturcture. Adapted from [18]. (d) - Boron-doped GNR and its corresponding non-contact atomic force microscopy (nc-AFM) image. Adapted from [38]. (e) - Synthetic scheme for the fully zigzag edge GNR. Adapted from [73].
24 Characterization results on bottom-up synthesized GNRs and GQDs
On-surface approach
In this regard, the direct synthesis of GNRs on metal (mostly gold) surfaces under ultra-high vacuum (UHV) conditions serves as an alternative approach. Similar to the solution-based approach, the surface-assisted approach also consists in two steps: 1. ho-mocoupling (Ullmann coupling) polymerization of dihalogen substituted precursors. 2. thermally induced and surface-catalyzed cyclodehydrogenation (Fig. 3.4 - (b)). Typ-ically, atomically precise GNRs with a quantity of less than one monolayer coverage (sub-monolayer) can be obtained, flatly lying on the gold surface (Fig. 3.4 - (c)). Their chemical structure can be in situ imaged using high-resolution STM (Fig. 3.4 - (c)) and non-contact atomic force microscopy (nc-AFM)(Fig. 3.4 - (d)). The first on-surface synthesis of GNR was realized by Cai et al. in 2010 [18]. Since then, a series of armchair-edge GNR with different width (5-, 7-, 9- and 13-AGNR) have been synthesized on gold surfaces by varying the molecular precursors. Besides pristine GNRs, GNRs doped with boron [38,74], nitrogen [75] or sulfur [76] have also been synthesized with pre-designed molecular precursors (Fig. 3.4 - (d)), providing an additional parameter for tuning the electronic properties of GNRs. Graphene nanoribbon heterojunctions and heterostruc-tures have also been realized in single GNR strands by combining two different molecular precursors [77,78], which emerges as a promising way to modulate the electronic prop-erties as people have done with inorganic semiconductors [79]. Notably, long-awaited atomically precise zigzag-edge GNR with defined and uniform structures were recently achieved by Ruffieux et al. in 2016 [73]. As shown in Fig. 3.4 - (e), they carefully designed an “umbrella”-shape molecule precursor and thus the precursors connects together in an up-and-down configuration forming the full zigzag edge structure. Although a variety of GNRs with different width and edge structures have been synthesized with atomic precision via surface-assisted method, such GNRs need to be transferred from the metal surfaces onto dielectric substrates for further studies on their electronic and optical prop-erties as well as integration into electronic devices. It is thus very necessary to develop an efficient, non-destructive, and clean transfer method.
4
Characterization results on bottom-up
synthe-sized GNRs and GQDs
4.1
Characterization of chemical structure
In principle, bottom-up chemistry method allows us to produce GQDs or GNRs with de-fined and uniform structure. To support this, there are some characterization techniques that have been employed according to the synthesis approach.
For in-solution synthesized GQDs, since they have defined chemical formula, their structure perfection can be demonstrated directly by matrix-assisted laser desorp-tion/ionization time-of-flight (MALDI-TOF) mass spectrometry (MS). In these mea-surements, one single intense signal with an ensemble of very narrow peaks is found around the position corresponding to the molecular mass of GQD (Fig. 4.1 - (a)), which means the produced GQDs have the exact structure and there is no detectable amount of side products (unreacted or partially graphitized oligophenylenes) present in the
fi-4.1 - Characterization of chemical structure 25
nal powder product. Besides, liquid-state (for soluble compounds, high resolution) and solid-state (for less soluble compounds, low resolution)1H NMR measurements can give
information on the chemical environment of the groups in intermediate oligophenylenes and final GQDs, and demonstrate the structural perfection of GQDs at an ensemble level (Fig. 4.1 - (b)). Moreover, as we can see in Fig. 4.1 - (c), single GQDs can be visualized using STM by depositing the hot GQD solution [66,80] or “sublimating” GQD powders [81] on the Au(111) substrate or highly oriented pyrolitic graphite sub-strate (HOPG). However, to date such measurements have been performed on few GQD structures and most of them have a small core size.
(a) (b) (c)
(d) (e) (f)
RBLM
Figure 4.1: (a) - (c): Structural characterizations of bottom-up synthesized GQDs via in-solution method. (a) - Matrix-assisted laser desorption/ionization time-of-flight (MALDI-TOF) mass spectrum (MS) of the GQDs. The obtained spectrum is com-pared with the simulation, demonstrating the exact structure of the produced GQDs. Adapted from [66]. (b) - Liquide-state 1H NMR of the GQDs. Adapted from [66]. (c)
- STM image of the GQDs deposited on the Au(111) substrate. (d) - (e): Structural characterizations of bottom-up synthesized GNRs via in-solution method. (d) - MALDI-TOF mass spectrum of the intermediate polyphenylene precursors, showing a series of equally separated peaks. Adapted from [82]. (e) - Raman spectrum on the GQD powders. Adapted from [65]. (f) - STM image of the GNRs on HOPG, showing a well-organized self-assembled monolayer of straight and uniform nanoribbons. Adapted from [65].
For in-solution synthesized GNRs, since the polymerization step does not control the length of the produced polyphenylenes, the final GNR structure has a certain length distribution. As a result, the MALDI-TOF mass spectrum of GNRs displays a series of peaks with an equal interval corresponding to the mass of one repeating unit (see Fig. 4.1 - (d)).3 The total absence of the peaks inside the intervals suggests the GNRs are fully
3The long GNRs that have high molecular mass cannot be detected by MALDI-TOF MS. To
26 Characterization results on bottom-up synthesized GNRs and GQDs
graphitized. However, one should note that the MALDI-TOF mass spectra of these in-solution synthesized GNR samples also indicate the presence of a very small amount of short GNR dimer and trimer (can be considered as GQDs), which could have different behaviors, especially a larger bandgap than the sufficient long GNRs. Similar to the case of GQDs, the solid-state 1H NMR spectra of GNRs display some distinct features
suggesting their defined structures. Besides, GNRs display distinct vibrational proper-ties, which are directly linked to their structure. Raman spectroscopy measurements on the GNR powders show prominent D and G modes and corresponding second order modes, which are the characteristic features of sp2 carbon structures. Remarkably, a
dis-tinct peak from a width-specific low-frequency mode called radial-breathing-like mode (RBLM) is resolved in the spectrum (see inset of Fig. 4.1 - (e) and for this specific GNR structure, it is at 235 cm−1), indicating high homogeneity of the width of produced
GNRs. One should note that this Raman mode has never been observed on the top-down fabricated GNRs [49]. In addition, Fourier transform infrared (FTIR) spectroscopy is also a powerful method to characterize the vibrational properties of sp2 carbon
struc-tures. The FTIR spectra on the final GNR structures always show very different modes compared with the spectra on the intermediate polyphenylenes supporting the successful conversion of polyphenylene precursors into GNRs. STM measurements have also been performed to visualize the in-solution synthesized GNRs. Due to the sever aggregation (π-π stacking) issues of GNRs in suspension, the visualization of GNRs synthesized by in-solution approach becomes extremely hard. To perform STM measurements on such GNRs, the authors in [65] applied a very tricky method, in which they extracted only a tiny amount of short and soluble GNRs from the produced powders using hot TCB solvent and deposited them on the HOPG surface. The STM images of the ob-tained samples show self-assembled and highly ordered domains of uniform and mostly straight GNRs (see Fig. 4.1 - (f)), which implies the full graphitization of polypheny-lene precursors. In addition, several attempts have been performed to visualize single isolated GNRs synthesized by this in-solution approach [83,84]. However, an efficient and reliable method is still elusive.
For on-surface synthesized GNRs, as they are isolated and extended on gold surface, their chemical structure is usually in-situ visualized with STM and nc-AFM under UHV. For molecular visualization with STM, since it is sensitive to the density of states near the Fermi level, which are typically delocalized over the entire molecule, the correlation between bonding structure and STM image contrast is not very straightforward. To solve this problem, simulations of STM images using DFT are usually performed. As we can see in Fig. 4.2 - (a), the very good agreement between the simulated STM image (shown in white) and the experimental results, confirms that the produced GNRs are atomically precise with fully hydrogen-terminated edges. For nc-AFM visualization, the probe is functionalized with a single carbon monoxide (CO) molecule. Since the probe senses the short range forces, the signal is very sensitive to the charge distribution on the sample. Moreover, to reduce the vibration of the measured molecule and to obtain an higher resolution, the measurements are commonly operated at low temperature (⇠5 K). As we can see in Fig. 3.4 - (d), the bonding structure of pristine and doped GNRs can be clearly resolved by nc-AFM, which confirms again their structural perfection. X-ray photoemission spectroscopy (XPS) is a powerful technique to study the chemical com-position of a material. For on-surface synthesized GNRs, it has been used to monitor the evolution of the chemical compounds and analyze the kinetic during the two-step reaction. Moreover, this technique has been used to study the stability of on-surface
4.2 - Characterization of electronic properties 27
synthesized GNRs (with hydrogenated edges) under ambient conditions. Fig. 4.2 shows the XPS spectrum of the GNR sample after exposure to air, the only peak for carbon atom is at 284.5 eV that corresponds to the sp2 bonded carbon. There are no signs of
carbon in other chemical environments, especially, no CO, C=O or COOH components (indicated by the blue lines), supporting that the GNRs are inert under ambient con-ditions. Similar to the in-solution synthesized GNRs, the Raman spectra of on-surface synthesized GNRs also display the width specific RBLM mode. Notably, the width of the peak is much narrower than the in-solution GNRs, since the edges are terminated by single hydrogen atoms instead of long alkyl chains [85].
(a)
(b)
Figure 4.2: (a) - In-situ high resolution STM image of the on-surfaced synthesized GNRs. The white part at the bottom left is a DFT-based STM simulation. The very good agreement confirms their exact structure with hydrogen-terminated edges (the molecular model is shown at the bottom left). Adapted from [18]. (b) - XPS spectrum of the on-surface synthesized GNRs after exposure to air. The absence of the peaks corresponding to CO, C=O or COOH components (indicated by the blue lines in the inset) suggests the GNRs are inert under ambient conditions. Adapted from [18].
4.2
Characterization of electronic properties
Due to sever aggregation effects of in-solution synthesized GNRs and large size GQDs, the characterizations of electronic properties have been mainly performed on the on-surface synthesized GNRs. Their electronic structure and in particular the bandgap size (Eg) and the values of bands’ effective mass (mVBand mCB), have been investigated
lo-cally with scanning tunneling spectroscopy (STS) and with averaging experimental tech-niques such as angle-resolved photoemission spectroscopy (ARPES) and high-resolution electron energy loss spectroscopy (HREELS).
The most widespread method used so far is STS. As illustrated by Fig. 4.3 - (a), a scanning tunneling spectrum is obtained by placing a tip above a particular place on the sample. With the height of the tip fixed, the electron tunneling current is then measured as a function of electron energy by varying the voltage between the tip and the sample (the tip to sample voltage sets the electron energy). The obtained curve is thus referred to as an I − V curve. From the I − V curve, the dI/dV − V curve is finally obtained, which corresponds to the electron density of states at the local position of the tip, the LDOS. Two peaks at the sides of V = 0 can be resolved, corresponding to the valence
28 Characterization results on bottom-up synthesized GNRs and GQDs
band and conduction band, respectively. From the onset of valence and conduction bands, an electronic band gap (Eg) is thus inferred. Bandgap values of Eg = 2.37 eV,
Eg = 1.38 eV and Eg = 1.40 eV have been measured for the armchair edge 7-AGNR [86],
9-AGNR [28] and 13-AGNR [87] grown on Au(111), respectively. As shown in Fig. 4.3 -(b), these values (indicated by hollow triangles) have been compared with the predicted bandgap using many-body perturbation theory (GW) calculations with image charge (IC) corrections (indicated by solid signs), which are used to account for the polarization effect of the gold substrate [39,86,88]. The good agreement between the measured values and theoretical calculations thus demonstrates the tunability of the electronic properties of GNRs via the control of structure by the bottom-up chemistry.
(a)
(b) (c)
Figure 4.3: (a) - Schematic illustration of scanning tunneling spectroscopy (STS) for the measurements of local electron density of states (LDOS). Adapted from [56]. (b) - Ex-perimental STS results and theoretical calculation prediction of the electronic bandgap (Eg) of armchair GNRs with different width. Colored hollow signs: GW calculation
re-sults predicting the bandgap of isolated GNRs. Solid signs: GW + image charge (IC) corrections results predicting the bandgap of GNRs supported on Au surface. Black hollow triangles: the experimental STS results of the GNRs on Au surface. Adapted from [88] together with the data in [28]. (c) - ARPES spectrum of 7-AGNRs grown on Au(788) substrate along the GNR axis. Adapted from [86].
Another common way to investigate the electronic properties of on-surface synthe-sized GNRs is angle resolved photoemission spectroscopy (ARPES), which gives access to the whole energy versus parallel momentum dispersion of occupied states (as shown in Fig. 4.3 - (c)) [86]. Being an ensemble averaging technique, domains of GNRs with the same orientation are required to obtain kk-resolved ARPES spectrum. This has been realized by growing GNRs on vicinal Au surfaces that display a periodic array of steps. This type of surface can act as templates and drive the uniaxially oriented growth of the GNRs along the terraces direction (Fig. 4.8 - (a)). We will see in the next section that
4.3 - Characterization of optical properties 29
such samples with aligned GNRs are also very useful to perform optical characterization.
4.3
Characterization of optical properties
Some theoretical calculations have been perform on the GQDs and GNRs to investigate their optical properties, such as the optical absorption spectra of different GQD [89–91] and GNR [92–94] structures, and scaling effect of exciton binding energy in GNRs [95]. In contrast, the intrinsic optical properties of GQDs and GNRs are almost unexplored experimentally. In this section, I will present the only few reports on the experimental study of their optical properties.
In-solution synthesized GQDs
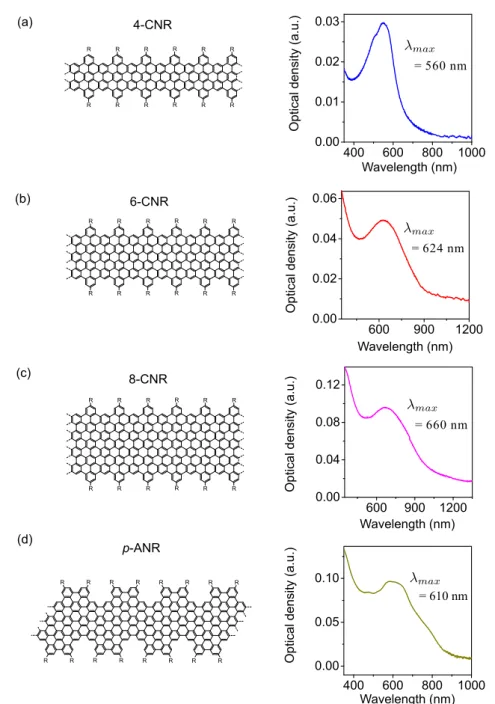
Optical absorption spectroscopy is one of the most common way to characterize the optical properties of a material. To do this, the produced GQD powders are usually dispersed in organic solvents. However, when the size of GQD becomes larger, it is more insoluble and the aggregation effect is more sever. In consequence, with the increase of the size of GQD, the absorption spectra broaden and become structureless (Fig. 4.4 -(a)) [96]. Despite of this broadening, one can still distinguish that the larger GQDs have an absorption maximum at a lower energy. As shown in Fig. 4.4 - (a)) [97], from benzene to the GQD with 222 π conjugated electrons (thus 222/6 = 37 aromatic sextets), Emax
roughly has an inverse relation with the number of aromatic sextets4, in agreement with
lower quantum confinement for the larger GQDs.
C222 C114 C78 C42 (a) (b) Em a x
Figure 4.4: (a) - Optical absorption spectra of GQDs in different size. Adapted from [96]. (b) - The energy of maximum (Emax) in the optical absorption spectrum as a function
of the GQD size (number of aromatic sextet). Adapted from [97].
Photoluminescence is another important optical properties for a semiconducting ma-terial. However, due to the aggregation effect, no pertinent photoluminescence results have been reported on the simple alkyl substituted GQDs with size larger than 60 π-electrons.
In 2010, the group of Dr. Liang-Li Shi at Indiana University developed a method to install 1,3,5-trialkyl phenyl groups at the edges of large C132 and C168 GQDs (Fig. 4.5 - (a)) [59]. These large substituted groups could wrap around the aromatic core of GQD forming a shell-like structure. In this way, the π − π interactions between the
30 Characterization results on bottom-up synthesized GNRs and GQDs
GQD aromatic cores are reduced. Thus, such GQDs show enhanced solubility and lower aggregation compared to the GQDs with simple alkyl chains. They then performed a series of optical characterizations on dispersions of C132 GQD (Mueller et al., 2010 [98]). In contrast to the simple alkyl chain substituted GQDs, the absorption spectrum of this “core-shell” GQD is more structured and the authors attributed the absorption lines to the transitions to the different singlet excited states (S1, S2, S3, and S4). The
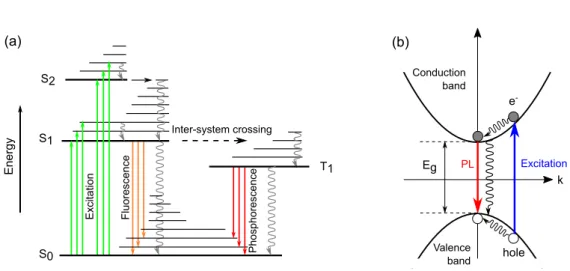
PL spectrum mainly consists of two lines, one at 670 nm the other at 740 nm. They also found that the time-resolved PL when detected at 670 nm is bi-exponential with two relative fast decay times of 1.7 ns and 5.4 ns, while the decay curve for the line at 740 nm is mono-exponential with a extreme long characteristic time of ⇠4 µs. To explain these observations, the authors proposed that the spin-orbit coupling is very strong and singlet-triplet energy separation is very small in this large GQD. Thus the inter-system crossing (ISC) is very efficient and the emission at 670 nm corresponds to the fluorescence (relaxation from the singlet state S1), while the emission at 740 nm
corresponds to the phosphorescence (relaxation from the triplet state T1) (as shown in
Fig. 4.5 - (c)). Moreover, the authors performed photoluminescence excitation (PLE) measurements on these two PL lines (Fig. 4.5 - (d)). The PLE curve detected at 740 nm (red line) is in very good agreement with the absorption spectrum. However, the PLE detected at 670 nm (blue line) is broad and in resonance at higher energy (lower than 500 nm). The authors left an open question on this strange behavior. After that, the group of Dr. John A. McGuire at Michigan State University continued to investigate the optical properties of these large “core-shell” GQDs in collaboration with the group of Dr. Liang-Li Shi. By means of transient absorption spectroscopy, they observed efficient biexciton formation and fast biexciton Auger recombination rates, which implied strong carrier interactions in these large GQDs [99,100].
In 2014, Riesen et al. [101] re-investigate the same C132 GQD by combining optical measurements and theoretical calculations. Using DFT based quantum chemical calcula-tions, the measured absorption spectrum was well reproduced (Fig 4.6 -(a)). Moreover, as shown in Fig 4.6 -(b), the authors indicated that the two high energy transitions have strong oscillator strength, while the two low energy lines are nearly dark (very low oscillator strength). However, these two “dark ” transitions could be brightened by the significant electron-vibrational intensity borrowing. Notably, in contradiction with the initial assignments by Mueller et al. [98], the authors in this paper proposed that the observed emission at 740 nm, which has long mono-exponential decay and the PLE similar to the absorption, arises from the lowest “dark” singlet transition instead of phosphorescence from the triplet state, while the emission at 670 nm, which has short multi-exponential decay and the PLE different to the absorption, arises from the impuri-ties in the dispersion instead of the fluorescence of the C132 GQDs. This proposition was further supported by the experiment of adding external heavy atoms. It is known that by adding the heavy atoms in the solution, the inter-system crossing rate of molecules could be strongly enhanced [102]. Thus if the emission at 740 nm originated from the triplet state, an increase of the emission intensity would be expected when adding heavy atoms. However, after adding dibromoethane in the GQD dispersion, the intensity of emission at 740 nm was decreased a lot with even a much greater extent than the emis-sion at 670 nm (Fig. 4.6 - (c)). This observation is in contradiction with the assignment of the emission at 740 nm as phosphorescence.
4.3 - Characterization of optical properties 31
synthesized GQDs are not clear (only one structure have been studied, and there are two totally different explanations on the observed results.). To this end, more systematic experimental studies and theoretical calculations on the GQDs with different structures are very needed.
Mueller et al., 2010 (a) (b) (c) (d) @670 nm @740 nm @Absorption
Figure 4.5: (a) - Chemical structure of C132 GQD. The three large chains could wrap around the aromatic core of GQD forming a “protective shell”. (b - d) Optical charac-terizations of C132 GQD performed by Muelller et al. [98]. (b) - Optical absorption and PL spectra of C132 GQD dispersion. (c) - Schematic illustration of the proposed energy levels of C132 GQD. (d) - PLE curves of C132 GQD dispersion. Adapted from [98].
Riesen et al., 2014
(a) (b) (c)
Figure 4.6: Optical investigations of C132 GQD performed by Riesen et al. [101]. (a) -Simulated absorption spectrum computed using the nuclear-ensemble approach, partly taking into account electron vibrational coupling. (b) - Schematic illustration of the four lowest optical singlet-singlet transitions. The two low energy transitions are “dark” (grey arrows), while the two high energy transitions are bright (red arrows). (c) - PL spectra of the C132 GQD dispersion before (bb) and after (ab) adding of dibromoethane. The grey curve is the difference spectrum. Adapted from [101].
32 Characterization results on bottom-up synthesized GNRs and GQDs
In-solution synthesized GNRs
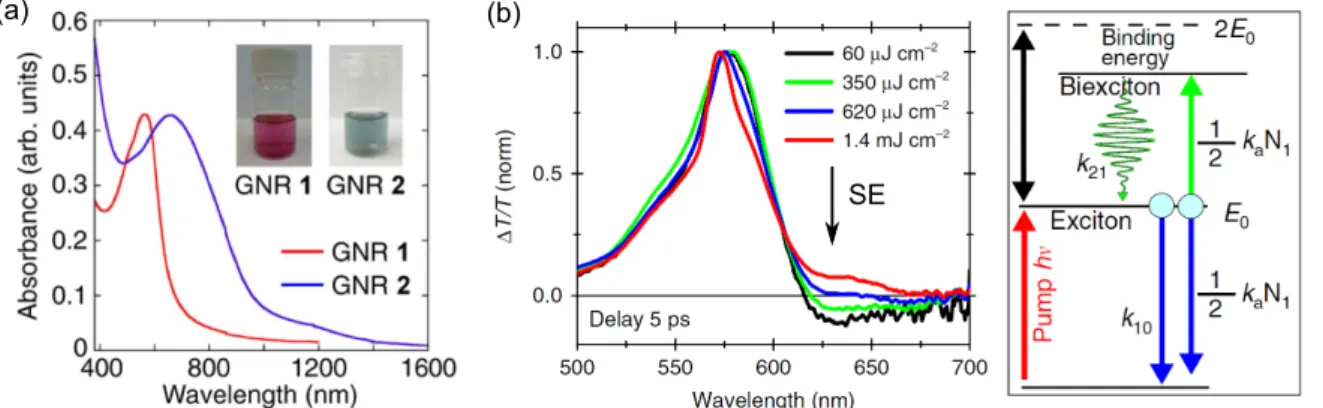
Similar to the case of GQDs, there are very few optical characterization results of in-solution synthesized GNRs that have been reported. The absorption spectra of cove-type edge GNRs with different width have been reported in [103,104]. We can see in Fig. 4.7 -(a) that the absorption band of the wide cove-edge GNRs is red-shifted compared to the narrow ones, which is in agreement with the fact that the π electrons are more delocalized. However, these two papers just showed the absorption spectra without go-ing into details. Apart from that, no results on the photoluminescence properties of such GNRs have been reported, which is presumably due to their very low insolubility. To date, there is only one paper that is dedicated to the optical characterizations of in-solution synthesized GNRs. In 2016, Soavi et al. [105] performed transient absorp-tion spectroscopy on the suspension of four-atom-wide cove-edge GNRs (4-CGNRs). As shown in Fig. 4.7 - (b) left, they found positive differential transmission (∆T /T ) signal around 650 nm when the GNR suspension was excited with a high fluence (indicated by the black arrow). Since it does not correspond to any resonant feature in the linear absorption spectrum and it is red-shifted compared to the lowest optical transition, the authors attributed this positive ∆T /T signal to the stimulated emission (SE). They proposed that at high excitation fluence, the excitons in GNRs undergo exciton-exciton annihilation effect and biexcitons could be efficiently formed (an Auger-like process, indicated by the green arrow in Fig. 4.7 - (b) right). Thus the observed SE signal is attributed to the radiative relaxation from the biexciton state to the one-exciton state of GNRs (the green waved line). From this point, the authors concluded that the GNRs is very promising in view of light-emission applications such as lasers and light-emitting diodes (LEDs). However, one should note that in this paper the authors did not show any steady-state photoluminescence spectra. Moreover, they also admitted that there might be GNR aggregates present in the suspension. Since the inter-molecular couplings could alter a lot the behavior of exciton, one can question on the influence of aggregation on these experimental results.
SE
(a) (b)
Figure 4.7: (a) - Optical absorption spectra of cove-edge GNRs with different width. Adapted from [103]. (b) - Left panel: Normalized ∆T /T spectra of four-atom-wide cove-edge GNR (4-CGNR) suspension for different excitation fluences at a fixed pump-probe delay of 5 ps. Right panel: Proposed exciton-biexciton model. Adapted from [105].
4.3 - Characterization of optical properties 33 On-solution synthesized GNRs (a) (c) (d) (b)
Figure 4.8: (a) - Schematic illustration of reflectance difference spectroscopy (RDS). PEM stands for photoelastic modulator that modulates polarization of light. One should note that in reality the laser beam size is far larger than a single nanoribbon. Thus RDS is an ensemble averaging technique. (b) - STM image of the aligned 7-AGNRs grown on Au(788). Scale bar: 20 nm. (c) - Dielectric response function ∆ε2 of 7-AGNRs on
Au(788) obtained from the measured RD spectra. (d) - Left: GW + BSE calculated optical absorption spectrum of 7-AGNR (light is polarized along the ribbon axis). Right: Calculated electronic band structure of 7-AGNR within the GW approach. Adapted from [106].
As we have seen, the on-surface synthesis approach can grow isolated GNRs. How-ever, due the metal (Au) substrate, it is impossible to directly perform optical ab-sorption and photoluminescence spectroscopy5. The only reported method to character-ize the optical property of GNRs on Au surface is reflectance difference spectroscopy (RDS) [106,107]. RDS measures the sample’s reflectance difference ∆r for light polar-ized along two orthogonal directions x and y, which gives the anisotropic absorption information of the sample (Fig. 4.8 - (a)). Since it is an ensemble averaging technique, the measurement should be performed on the sample with GNRs grown in the same orientation (like the ARPES measurement that we previously discussed)(see Fig. 4.8 -(b)). In 2014, Denk et al. firstly performed RDS on seven-carbon-wide armchair GNRS (7AGNRs) [106]. As shown in Fig. 4.8 - (c), the obtained differential dielectric response ∆ε2 from the RDS measurement is dominated by three positive peaks at 2.1, 2.3 and
4.2 eV, respectively. The positive sign of ∆ε2 indicates that these transitions arise from
the absorption of light polarized along the ribbon axis. Since there are no features relevant to the absorption of light polarized perpendicularly to the ribbon axis, such armchair edge GNRs show strong polarization anisotropy as observed in a similar quasi-1D system CNTs [108]. Moreover, the authors in this paper also performed GW + BSE
34 Characterization results on bottom-up synthesized GNRs and GQDs
calculations to simulate the optical absorption spectrum of 7-AGNR, where the GW approximation was used to calculate the gas-phase bandgap, while the BSE equations was used to further including excitonic effects. As shown in Fig. 4.8 - (d) left, the sim-ulated optical absorption spectrum shows three strong excitonic transitions located at 1.9, 2.3, 4.1 eV and they are both polarized along the ribbon axis, which are in excellent agreement with the experimental results. The computed data also indicate that the low-est two transitions around 2 eV arise from optical transitions between the last valence and first conduction bands (E11), and the second valence and second conduction bands
(E22) (Fig. 4.8 - (d) right). Moreover, by comparing with the gas phase band gap value
Eg,GW (= 3.7 eV), the exciton binding energy for E11 and E22 is thus equal to 1.8 and
1.4 eV, respectively, which correspond to Wannier-like quasi-1D excitons fully delocal-ized along the nanoribbon width. This paper is the first demonstration that the intrinsic optical properties of GNRs predicted by the theory can be observed in the bottom-up synthesized GNRs.
In 2017, Senkovskiy et al. performed the transfer procedures of such Au-surface-grown 7-AGNRs in order to investigate their photoluminescence properties [109]. As shown in Fig. 4.9 - (a), by performing the electrochemical delamination process, the whole as-grown 7-AGNR film together with the spin-coated PMMA support layer were transferred onto a SiO2/Si substrate. The PMMA was finally removed by acetic acid
and methanol. However, as seen in Fig. 4.9 - (b), the PL spectrum of the transferred 7-AGNRs is dominated by the Raman peaks of GNRs and there is only a very weak and broad PL background instead of the expected strong emission from the lowest E11
excitonic transition as revealed by the RDS. The theoretical calculations predicted that there could be a dark state with energy very closed to the lowest E11 transition [92,93].
The author thus proposed that the observed weak and broad PL is the signature of the existence of such dark states. However, we should note that the photoluminescence is usually very sensitive. Many factors could quench it. For example, the transfer procedure in this paper involved base solution NaOH and acetic acid. As people have observed in CNTs [110], such base and acid solutions could be a possible reason to quench the PL. Thus in view of a more detailed PL investigation, a transfer method in a clean and mild condition should be developed in the future. However, to date, the photoluminescence properties of the on-surface synthesized GNRs are still not clear.
(a) (b)
Figure 4.9: (a) - Schematic illustration of the electrochemical delamination transfer of
7-AGNR sample from a Au(788) substrate to a SiO2/Si substrate. PMMA is used as
the support layer for the transfer. (b) - PL spectra of the transferred 7-AGNRs on the SiO2/Si substrate. Adapted from [109].
4.3 - Characterization of optical properties 35
In addition to this PL measurement, we note that recently Chong et al. re-ported bright electroluminescence from the individual 7-AGNRs with specific edge structure [111]. In this paper, the authors first synthesized relatively short 7-AGNRs (⇠10 nm) with zigzag shape terminus on Au surface. They then performed the dehy-drogenation of the central carbon atom of the ribbon zigzag terminus (indicated by the red arrow in Fig. 4.10 - (a)). By lifting such an individual GNR with the gold-capped STM tip (see Fig. 4.10 - (b)) and applying voltage, they observed a bight and narrow band emission with energy lower than the optical bandgap of infinite 7-AGNRs (see Fig. 4.10 - (c)). Their GW -BSE calculations indicated that the emission is related to the electronic states localized at such specific GNR termini. This observation provides a novel way to investigate optical properties of on-surface synthesized GNRs.
(b)
(a) (c)
Figure 4.10: (a) - STM image of a 7-AGNR with the central carbon atom of the zigzag terminus dehydrogenated (indicated by the red arrow). The sample is on Au surface. (b) - Schematic illustration of the electroluminescence from a lifted 7-AGNR by a gold-capped STM tip. (c) - Corresponding emission spectrum. Adapted from [111].


![Figure 4.6: Optical investigations of C132 GQD performed by Riesen et al. [101]. (a) - -Simulated absorption spectrum computed using the nuclear-ensemble approach, partly taking into account electron vibrational coupling](https://thumb-eu.123doks.com/thumbv2/123doknet/14528600.723231/32.892.137.794.777.990/optical-investigations-performed-simulated-absorption-spectrum-computed-vibrational.webp)