HAL Id: tel-02926970
https://tel.archives-ouvertes.fr/tel-02926970
Submitted on 1 Sep 2020
HAL is a multi-disciplinary open access archive for the deposit and dissemination of sci-entific research documents, whether they are pub-lished or not. The documents may come from teaching and research institutions in France or abroad, or from public or private research centers.
L’archive ouverte pluridisciplinaire HAL, est destinée au dépôt et à la diffusion de documents scientifiques de niveau recherche, publiés ou non, émanant des établissements d’enseignement et de recherche français ou étrangers, des laboratoires publics ou privés.
Marcus Guadagnin Moravia
To cite this version:
Marcus Guadagnin Moravia. Geogrid-reinforced layer approach using DEM modeling. Materials Science [cond-mat.mtrl-sci]. Université Grenoble Alpes [2020-..]; Instituto tecnólogico de aeronáutica (São José dos Campos, Brésil), 2020. English. �NNT : 2020GRALI024�. �tel-02926970�
THÈSE
Pour obtenir le grade de
DOCTEUR DE L’UNIVERSITE GRENOBLE ALPES
Préparée dans le cadre d’une cotutelle entre la Communauté Université Grenoble Alpes et l’Instituto Tecnológico de Aeronáutica Spécialité : 2MGE – Matériaux, Mécanique, Génie civil,
Electrochimie / Infrastructure Aéroportuaire
Arrêté ministériel : 6 janvier 2005 – 25 mai 2016 / Résolution : CNE/CES nbre
1/2001
Présentée par :
Marcus GUADAGNIN MORAVIA
Thèse dirigée par Pascal VILLARD et Delma DE MATTOS VIDAL
Préparée au sein du Laboratoire 3SR (Sols, Solides, Structures et Risques) et de l’unité de recherche Infrastructures Aéronautique de l’ITA
Dans l’École Doctorale I-MEP2 (Ingénierie – Matériaux, Mécanique, Environnement, Energétique, Procédés, Production) et l’Instituto Tecnológico de Aeronáutica
Approche MED du renforcement des sols
granulaires par géogrilles
Geogrid-reinforced layer approach using
DEM modeling
Thèse soutenue publiquement le 19 juin 2020, devant le jury composé de :
Monsieur Daniel DIAS
Professeur, Antea Group, Président
Monsieur Pascal VILLARD
Professeur, Université Grenoble Alpes, Directeur de thèse
Madame Delma DE MATTOS VIDAL
Professeur, Instituto Tecnológico de Aeronáutica, Directrice de thèse
Monsieur Hussein MROUEH
Professeur, Université de Lille Sciences et Technologies, Rapporteur
Monsieur Márcio DE SOUZA SOARES DE ALMEIDA
Professeur, Universidade Federal do Rio de Janeiro, Rapporteur
Madame Claire SILVANI
Maître de conférences, INSA Lyon, Examinatrice
Monsieur Paulo Ivo BRAGA DE QUEIROZ
Professeur, Instituto Tecnológico de Aeronáutica, Examinateur
Monsieur José Antonio SCHIAVON
Acknowledgments
The Convention de Cotutelle de Th`ese (joint PhD agreement) between Universit´e Grenoble Alpes (ComUE - UGA - 3SR) – France and Instituto Tecnol´ogico de Aeron´autica (ITA) – Brazil gave rise to the work presented in this thesis. The integrated experience and access to the two research environments for the benefit of this thesis was a great privilege.
This study was financed in part by the Coordena¸c˜ao de Aperfei¸coamento de Pessoal de N´ıvel Superior – Brasil (CAPES) – Finance Code 001. Laboratoire 3SR (CNRS -Grenoble INP - UGA) also supported scientific training courses and events. I am very grateful for the financial support received that made this work possible.
Many people have helped me and made the path possible for my studies and research. Their contributions are sincerely appreciated and gratefully acknowledged. In particular, I would like to express my appreciation to:
Wilson Cabral for the support provided by the Engenharia de Infraestrutura Aeron´ au-tica Graduate Program - ITA.
Jean-Pierre Gourc for introducing me to Laboratoire 3SR and making the Convention de Cotutelle de Th`ese possible.
Delma Vidal for paving the way for the French research environment through her pro-fessionally developed partnerships, her kindness to me, and the hours she spent discussing my work.
Pascal Villard for the PhD opportunity in France, knowledge imparted, careful review of my thesis, attentive advice, motivation in difficult times, and assistance with heavy administrative demands. It has been an honor and a pleasure to work with him.
Daniel Dias, Hussein Mroueh, M´arcio Almeida, Claire Silvani, Paulo Ivo, and Jos´e Schiavon for agreeing to be part of the examining committee, as well as for the fruitful discussion and their helpful comments.
Bruno Chareyre for clarifying critical issues in my work involving the YADE frame-work.
Fran¸cois Kneib for kindly welcoming me into the world of YADE.
Deepak Kunhappan for the friendship, pleasant exchange of ideas, and guidance on programming.
All members of Laboratoire 3SR and my colleagues in the G´eoM´ecanique team for making this experience unforgettable.
My colleagues at ITA for being friendly and so supportive.
My parents and brothers for their unconditional encouragement throughout this long process.
My beloved wife, who also encouraged me with endless patience and energy. My life is to go hand in hand with her.
Abstract
The thesis topic is the geogrid-reinforced layer based on the Discrete Element Method (DEM). The main objective of the research is to improve the understanding of the in-teraction between generic geogrids and granular materials, especially those related to mi-cromechanisms. The perspective is that this work can contribute to new studies related to the use of geogrids to optimize the design of such reinforcement. Geogrids as granular layer reinforcement elements have a successful application history throughout the world. In many cases, these structures provide a significantly economical, safe, and environmen-tally friendly solution. However, the development and optimization of this solution must deal with the complex behavior between the reinforcement and granular material. Thus, the use of numerical methods capable of reproducing the geogrid mechanical behavior (i.e., stretching, bending, shearing, and twisting) and the grain scale soil behavior at the vicinity of the geogrid (i.e., rolling, friction, and abutment effect) can contribute greatly to a better understanding of the soil-geogrid interaction. DEM-based models have this feature with a relatively small number of parameters. Despite this, representative geogrid modeling is still a demand. This thesis comprises a new proposal for discrete geogrid modeling using deformable elements. The numerical construction involved the extensible open-source framework for discrete numerical models YADE and focused on obtaining a realistic flat shape for members of a generic geogrid. Geogrid pullout simulations made it possible to verify the mechanical behavior of the samples and to evaluate the mobilization of forces in the reinforcement. The simulations comprised samples with different amounts of spherical and non-spherical particles. The results obtained were consistent and showed that the particle angularity and the relative size between geogrid openings and particles have a significant influence on the reinforcement strength mobilization. It was also possi-ble to verify that the stresses mobilized in the transverse members of the geogrid during its pullout are significantly lower than those of the longitudinal members, but they are not negligible. Despite the determination of contact parameters is still a difficulty for real cases, the discrete numerical model presented contributes to future studies aiming at the interaction between geogrid and granular materials.
Keywords: Geogrids, Discrete Element Method, Reinforcement Layers, Geogrid Pullout Test
R´
esum´
e
Le travail de th`ese porte sur la mod´elisation num´erique par la m´ethode des ´el´ements dis-crets (MED) du renforcement des sols granulaires par des g´eogrilles. L’objectif principal de ces travaux est d’am´eliorer la compr´ehension des m´ecanismes d’interaction entre la g´eogrille et les mat´eriaux granulaires, en particulier ceux li´es aux micro-m´ecanismes. En perspective, ces travaux peuvent contribuer au d´eveloppement et `a l’optimisation de nou-veaux produits pour des applications sp´ecifiques. Les g´eogrilles, en tant qu’´el´ements de renforcement des couches granulaires ont, par le pass´e, d´emontr´e leur efficacit´e `a travers le monde. Dans de nombreux cas, ces structures apportent une solution le plus souvent ´economique, sˆure et respectueuse de l’environnement. Cependant, le d´eveloppement et l’optimisation de cette solution doivent tenir compte du comportement d’interaction com-plexe entre le renforcement et le mat´eriau granulaire. Ainsi, l’utilisation de m´ethodes num´eriques capables de reproduire le comportement m´ecanique de la g´eogrille (´etirement, flexion, cisaillement et torsion) et le comportement du sol `a l’´echelle du grain au voi-sinage de la g´eogrille (effet de roulement, de frottement et de but´ee) peut contribuer grandement `a une meilleure compr´ehension de l’interaction sol-g´eogrille. Les mod`eles nu-m´eriques bas´es sur la MED offre cette possibilit´e tout en ne n´ecessitant qu’un nombre relativement restreint de param`etres. Toutefois, la mise au point d’un mod`ele num´erique de g´eogrilles repr´esentatif des produits actuels reste une demande non satisfaite. Cette th`ese comprend une nouvelle proposition de mod´elisation des g´eogrilles par la m´ethode des ´el´ements discrets, bas´ee sur l’utilisation d’´el´ements d´eformables. Les d´eveloppements num´eriques ont ´et´e r´ealis´es `a partir du code open source YADE. Ils avaient pour objectif la d´efinition d’une g´eom´etrie de g´eogrille g´en´erique constitu´ee de brins de forme aplatie, comme c’est g´en´eralement le cas dans la pratique. Des simulations num´eriques d’essais d’extraction de g´eogrilles ont permis d’analyser le comportement d’interaction entre la grille et le sol granulaire et d’´etudier la mobilisation progressive des forces de tension dans le renforcement. Des ´echantillons num´eriques comportant des particules sph´eriques ou non sph´eriques (clumps constitu´es de plusieurs sph`eres imbriqu´ees) de diff´erentes tailles ont ´et´e utilis´es. Les r´esultats obtenus montrent que la forme des particules et leur taille relative (comparativement `a la taille des ouvertures de la g´eogrille) ont une influence significative sur la mobilisation et l’intensit´e des forces d’extraction. Il a ´egalement ´et´e possible de
vii v´erifier que les efforts mobilis´es dans les brins transversaux de la g´eogrille au cours des tests d’extraction sont nettement inf´erieurs `a ceux des brins longitudinaux, mais qu’ils ne sont pas n´egligeables. Bien que la d´etermination des param`etres de contact reste une difficult´e pour des applications `a des cas r´eels, le mod`ele num´erique discret semble ˆetre un outil pertinent et tr`es prometteur pour l’´etude de l’interaction entre tout type de g´eogrille et mat´eriaux granulaires.
Mots cl´es : G´eogrille, M´ethode des El´ements Discrets, Renforcement des Sols, Essai d’Extraction
List of Figures
FIGURE 1.1 – Ultimate limit states for basal reinforced embankments. Adapted from BSI (2010). . . 17 FIGURE 1.2 – Serviceability limit states for basal reinforced embankments. Adapted
from BSI (2010). . . 18
FIGURE 2.1 – The sequence of a typical DEM modeling. . . 30 FIGURE 2.2 – Two disks laterally compressed by rigid walls. Adapted from
Cun-dall and Strack (1979). . . 31 FIGURE 2.3 – Geogrid modeling from sphere aggregates (KONIETZKY et al., 2004). 35 FIGURE 2.4 – Discrete modeling of damping module for rockfall protection (
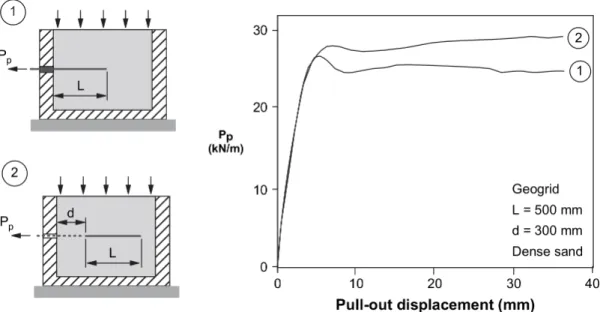
EF-FEINDZOUROU et al., 2017). . . 36 FIGURE 2.5 – Effect of top boundary condition on pullout test results (PALMERIA;
MILLIGAN, 1989). . . 38 FIGURE 2.6 – Influence of the initial geogrid position within the sample on the
pullout test result (PALMEIRA, 1987;PALMEIRA, 2009). . . 38 FIGURE 2.7 – Pullout test results for different grids. Adapted from Palmeira (2004). 39 FIGURE 2.8 – The effect of confining pressure on the pullout response of a geogrid
(FARRAG et al., 1993). . . 39 FIGURE 3.1 – YADE’s simulation cycle. . . 42 FIGURE 3.2 – SAP algorithm example involving two-dimensional collision
detec-tion scenarios. Adapted from ˇSmilauer et al. (2015a). . . 46 FIGURE 3.3 – Simplified representation of the contact between two spheres. Adapted
from Coetzee and Els (2009). . . 47 FIGURE 3.4 – Representation of normal stiffness in the interaction between two
LIST OF FIGURES ix
FIGURE 3.5 – Degrees of freedom for interaction between two spherical elements. . 49
FIGURE 3.6 – Contact created between two spheres, highlighting the overlapping between them. Adapted from ˇSmilauer et al. (2015a). . . 50
FIGURE 3.7 – Shear component update due to displacement between elements. Adapted from ˇSmilauer et al. (2015a). . . 52
FIGURE 3.8 – Collision between a free-falling sphere and a fixed sphere in the space. 63 FIGURE 3.9 – Gravity deposition of spheres in a box. . . 64
FIGURE 3.10 –Oedometer test with compression and decompression stages. . . 66
FIGURE 3.11 –Regular hexagonal packing of spheres under simple shear. . . 67
FIGURE 3.12 –Triaxial test of a sample composed of clump particles. . . 68
FIGURE 3.13 –Pullout test of a grid confined by spherical element layers. . . 69
FIGURE 3.14 –Particle geometry of the numerical sample. . . 70
FIGURE 3.15 –Sample simulation of rigid agglomerates with specified porosity. . . . 71
FIGURE 3.16 –Possible interactions involving spheres, cylinders, and particle facets. 72 FIGURE 4.1 – Important effects to be considered in geogrid modeling. . . 75
FIGURE 4.2 – Cylinder and particle facet elements. . . 75
FIGURE 4.3 – Numerical modeling of a generic geogrid in the DEM framework. . . 76
FIGURE 4.4 – Contact scheme of two spheres. . . 76
FIGURE 4.5 – Virtual sphere used in sphere–cylinder and cylinder–cylinder inter-actions. . . 79
FIGURE 4.6 – Depiction of the virtual sphere in a sphere–PFacet interaction. . . . 80
FIGURE 4.7 – Types of induced reactions in members of the geogrid structure. . . 81
FIGURE 4.8 – Geogrid segment configuration with four PFacets and two PFacets. . 85
FIGURE 4.9 – Skeleton of the geogrid model. . . 86
FIGURE 4.10 –Length variation of the geogrid in the tensile direction and orthog-onal to the tensile direction. . . 88
FIGURE 4.11 –Rotation of transverse members in shear tensile simulation. . . 89
FIGURE 4.12 –Longitudinal and transverse strains of the chosen node of the geogrid. 90 FIGURE 4.13 –Horizontal and vertical components of tensile force in the selected geogrid node. . . 90
FIGURE 4.14 –Moment-rotation curve of the selected geogrid node. . . 90
FIGURE 4.15 –Normal and shear tensile simulations for the geogrid. . . 91
FIGURE 4.16 –Comparison of results for normal tensile simulation. . . 91
FIGURE 4.17 –Comparison of results for shear tensile simulation. . . 91
FIGURE 4.18 –Initial and final state of the geogrid bending simulation. . . 93
FIGURE 4.19 –Comparison of relative deflection and strain for bending simulation. 94 FIGURE 4.20 –Comparison of maximum tensile force for bending simulation. . . 94
FIGURE 4.21 –Section S–S and yarns where the tensile forces were obtained. . . 95
FIGURE 4.22 –Comparison of relative deflection and strain for bending simulation. 96 FIGURE 4.23 –Views of the final state of the simulation involving interaction be-tween geogrid and particle. . . 96
FIGURE 4.24 –Typical four-sphere clump. . . 98
FIGURE 4.25 –Angularity coefficient for two-sphere clump. . . 99
FIGURE 4.26 –Geogrid-reinforced granular volumes during sample preparation. . . 101
FIGURE 4.27 –Samples prepared for geogrid pullout simulation. . . 101
FIGURE 5.1 – Samples at the end of the triaxial test. . . 106
FIGURE 5.2 – Deviator stress and volumetric strain versus axial strain for the 3000-sphere sample. . . 107
FIGURE 5.3 – Deviator stress and volumetric strain versus axial strain for the 6000-sphere sample. . . 107
FIGURE 5.4 – Deviator stress and volumetric strain versus axial strain for the 9000-sphere sample. . . 107
FIGURE 5.5 – Deviator stress and volumetric strain versus axial strain for the 3000-clump sample. . . 108
FIGURE 5.6 – Deviator stress and volumetric strain versus axial strain for the 6000-clump sample. . . 108
FIGURE 5.7 – Deviator stress and volumetric strain versus axial strain for the 9000-clump sample. . . 108
FIGURE 5.8 – Openings and their elements evaluated in the geogrid pullout test. . 109
FIGURE 5.9 – Geogrid pullout embedded in 3000 spheres (i.e., particle and mesh size ratio equal to 5.37E−01 m/m). . . 110
LIST OF FIGURES xi FIGURE 5.10 –Geogrid pullout embedded in 6000 spheres (i.e., particle and mesh
size ratio equal to 4.28E−01 m/m). . . 110 FIGURE 5.11 –Geogrid pullout embedded in 9000 spheres (i.e., particle and mesh
size ratio equal to 3.76E−01 m/m). . . 110 FIGURE 5.12 –Force chain network for the final state of the geogrid pullout test for
the 3000-sphere sample. . . 111 FIGURE 5.13 –Force chain network for the final state of the geogrid pullout test for
the 6000-sphere sample. . . 111 FIGURE 5.14 –Force chain network for the final state of the geogrid pullout test for
the 9000-sphere sample. . . 112 FIGURE 5.15 –Force-displacement curve for geogrid pullout test on samples
com-posed of spherical particles. . . 113 FIGURE 5.16 –Element A stress-displacement curve for geogrid pullout test on
sam-ples composed of spherical particles. . . 114 FIGURE 5.17 –Element B stress-displacement curve for geogrid pullout test on
sam-ples composed of spherical particles. . . 115 FIGURE 5.18 –Element C Stress-displacement curve for geogrid pullout test on
sam-ples composed of spherical particles. . . 117 FIGURE 5.19 –Element D stress-displacement curve for geogrid pullout test on
sam-ples composed of spherical particles. . . 117 FIGURE 5.20 –Front view of the pullout test on 3000-sphere sample (i.e., particle
and mesh size ratio equal to 5.37E−01 m/m). . . 118 FIGURE 5.21 –Front view of the pullout test on 6000-sphere sample (i.e., particle
and mesh size ratio equal to 4.28E−01 m/m). . . 118 FIGURE 5.22 –Front view of the pullout test on 9000-sphere sample (i.e., particle
and mesh size ratio equal to 3.76E−01 m/m). . . 118 FIGURE 5.23 –Geogrid pullout embedded in 3000 clumps (i.e., particle and mesh
size ratio equal to 6.95E−01 m/m). . . 119 FIGURE 5.24 –Geogrid pullout embedded in 6000 clumps (i.e., particle and mesh
size ratio equal to 5.53E−01 m/m). . . 119 FIGURE 5.25 –Geogrid pullout embedded in 9000 clumps (i.e., particle and mesh
size ratio equal to 4.85E−01 m/m). . . 120 FIGURE 5.26 –Force-displacement curve for geogrid pullout testin on samples
FIGURE 5.27 –Force chain network for the final state of the geogrid pullout test for the 3000-clump sample. . . 122 FIGURE 5.28 –Force chain network for the final state of the geogrid pullout test for
the 6000-clump sample. . . 122 FIGURE 5.29 –Force chain network for the final state of the geogrid pullout test for
the 9000-clump sample. . . 123 FIGURE 5.30 –Element A stress-displacement curve for geogrid pullout test on
sam-ples composed of clump particles. . . 124 FIGURE 5.31 –Element B stress-displacement curve for geogrid pullout test on
sam-ples composed of clump particles. . . 125 FIGURE 5.32 –Element C Stress-displacement curve for geogrid pullout test on
sam-ples composed of clump particles. . . 126 FIGURE 5.33 –Element D stress-displacement curve for geogrid pullout test on
sam-ples composed of clump particles. . . 127 FIGURE 5.34 –Front view of the pullout test on 3000-clump sample (i.e., particle
and mesh size ratio equal to 5.37E−01 m/m). . . 127 FIGURE 5.35 –Front view of the pullout test on 6000-clump sample (i.e., particle
and mesh size ratio equal to 4.28E−01 m/m). . . 128 FIGURE 5.36 –Front view of the pullout test on 9000-clump sample (i.e., particle
and mesh size ratio equal to 3.76E−01 m/m). . . 128 FIGURE 5.37 –Comparison of the force-displacement curve between geogrid-reinforced
samples composed of spheres and clumps. . . 130 FIGURE 5.38 –Comparison of the element A stress-displacement curve between
geogrid-reinforced samples composed of spheres and clumps. . . 132 FIGURE 5.39 –Comparison of the element B stress-displacement curve between
List of Tables
TABLE 4.1 – Simulation parameters. . . 87
TABLE 4.2 – Angularity coefficient for the typical 4-sphere clump. . . 99
TABLE 5.1 – Porosity and particle size of samples. . . 103
TABLE 5.2 – Geogrid pullout test model parameters. . . 105
TABLE 5.3 – Macroscopic parameters of granular material samples. . . 109
TABLE 5.4 – Mean values of the stress-displacement curve in elements A and B for samples composed of spherical particles. . . 116
TABLE 5.5 – Mean values of the stress-displacement curve in elements A and B for samples composed of clump particles. . . 126
TABLE 5.6 – Ratio of cell 1 to cell 2 for mean values of stress-displacement curves in elements A and B. . . 131
TABLE 5.7 – Ratio of clump-particle sample to sphere-particle sample for mean values of stress-displacement curves in corresponding elements. . . . 134
TABLE 5.8 – The ratio between the division of pullout force by the surface area of the geogrid and the vertical stress at the geogrid interface for the pullout test samples. . . 135
Contents
1
Introduction
. . . 171.1 Topic and background . . . 17
1.2 Aim and objectives . . . 20
1.3 Thesis outline . . . 21
2
Approach to the Problem
. . . 232.1 Geosynthetic reinforcement considerations . . . 23
2.2 Possible approaches to the problem . . . 26
2.3 Discrete Element Method – DEM . . . 29
2.4 Discrete modeling of geosynthetic reinforcements . . . 34
2.5 Pullout testing of geogrid reinforcements . . . 37
3
Auxiliary Tool for DEM
. . . 413.1 Yet Another Dynamic Engine – YADE . . . 41
3.2 DEM simulations in YADE . . . 44
3.2.1 Interaction procedure in simulations . . . 44
3.2.2 Collision detection between elements . . . 45
3.2.3 Interaction establishment . . . 47
3.2.4 Displacement and strain evaluation . . . 49
3.2.5 Force calculation . . . 53
3.2.6 Motion calculation . . . 55
3.2.7 Numerical damping . . . 58
3.2.8 Critical time step . . . 60
CONTENTS xv
3.3.1 Development . . . 62
3.3.2 Contact between spheres . . . 63
3.3.3 Spheres gravity deposition . . . 64
3.3.4 Oedometer test . . . 65
3.3.5 Simple shear . . . 67
3.3.6 Triaxial test . . . 68
3.3.7 Grid pullout test . . . 69
3.3.8 Sample porosity control . . . 70
3.3.9 Handling interactions . . . 71
4
Numerical Model
. . . 734.1 Introduction . . . 73
4.2 Geogrid modeling in the DEM framework . . . 74
4.2.1 DEM discretization . . . 74
4.2.2 Contact model . . . 76
4.2.3 Internal force model . . . 80
4.3 Numerical geogrid parameters . . . 84
4.3.1 Contact parameters . . . 84
4.3.2 Internal strength parameters . . . 84
4.4 Geogrid simulations . . . 85
4.4.1 Modeling remarks . . . 85
4.4.2 Traction and shearing tests . . . 86
4.4.3 Bending test . . . 92
4.5 Granular assembly . . . 97
4.6 Sample preparation . . . 100
5
Numerical Analyses and Results
. . . 1025.1 Geogrid pullout test . . . 102
5.2 Sample with spheres . . . 109
5.3 Sample with clumps . . . 119
6
Conclusion
. . . 1366.1 Summary and reflection . . . 136
6.2 Proposals for future work . . . 139
1 Introduction
1.1
Topic and background
Deformations induced by loads can be considered one of the most important aspects of geotechnics. The good performance of geothecnical structures is directly related to their ability to withstand deformations produced by loads. In this context, reinforcements are commonly used, for example, in embankment foundations to increase their strength in order to avoid ruptures due to excessive deformation or shear mechanisms. The Figures 1.1 and 1.2 exemplify ultimate and serviceability limit states, respectively, which are normally considered in design of basal reinforced embankments.
FIGURE 1.1 – Ultimate limit states for basal reinforced embankments. Adapted from BSI (2010).
FIGURE 1.2 – Serviceability limit states for basal reinforced embankments. Adapted from BSI (2010).
Among the synthetic reinforcements, geogrids have a successful application history throughout the world and are considered as a very interesting solution from the economic and environmental point of view. The mechanical improvement of a geogrid-reinforced granular layer is related not only to the stress-strain behavior of the reinforcement, but also to its grid-like geometry. Geogrid openings promote mechanisms of interaction with the soil or other granular material that help to restrict the deformation of the reinforced layers. However, there is still no complete knowledge of these mechanisms, especially micromechanisms, which are crucial for an optimized design of reinforced structures.
Structures reinforced with geogrid have complex behavior, and it is often difficult to experimentally study the interaction mechanisms between the soil particles and reinforce-ment members such as friction, grain rolling, or soil abutreinforce-ment at the vicinity of the geogrid due to stress concentration during pullout test, for example. On the other hand, the nu-merical approach represents a powerful alternative for the evaluation and development of this type of problem. In this case, numerical modeling must deal with the complexity of the material-reinforcement interaction problem, which requires specific numerical mod-els whose formulations admit localized behaviors in the contacts as well as the granular nature of the material (e.g., soil, gravel, ballast). Thus, this thesis mainly concerns the numerical approach that can take into account the interactions of granular particles with geosynthetic reinforcement to model geogrid reinforced layers.
The granular nature of the material has a decisive impact on the mechanisms of in-teraction with the reinforcement and, consequently, on the mechanical behavior of layers reinforced with geogrid. A powerful and flexible way of modeling this nature is by using the Discrete Element Method – DEM (CUNDALL; STRACK, 1979), which makes it possible to characterize materials as constituent particles with behaviors ruled by physical laws. This method is basically defined as a set of numerical processes for the calculation of motion and its respective effect on a given group of particles or elements. The use of this method by computer codes is a technique with great potential for problems involving
par-CHAPTER 1. INTRODUCTION 19 ticle interaction. The continuous advancement of the processing technology has improved the use of this technique, allowing numerical models increasingly complex.
In many cases, reinforcement modeling is still challenging. The behavior of geosyn-thetics such as geotextiles or geogrids, which is related to their three-dimensional con-figuration, is not simple to be reproduced numerically, and simplifications may imply a less realistic mechanical response of the reinforced structure. Two modeling manner of this type of structure are predominantly found in the literature. One is the multi-domain coupling of different numerical methods, most commonly the DEM is coupled to the Fi-nite Element Method – FEM (VILLARD et al., 2009; TRAN et al., 2013; TRAN et al., 2015). Thereby, the geotextile or geogrid are modeled as continuous solids discretized by finite el-ements, whereas the granular material is modeled by discrete elements. The other manner is a purely discrete modeling with the reinforcement defined by agglomerates composed of connected spherical elements (ZHANG et al., 2007; CHEN et al., 2012; LACKNER et al., 2014).
Although the multi-domain coupling between DEM and FEM has advantages, the difficulty in precisely defining a contact behavior between the two methods is an inconve-nience to the problem of geogrid interaction with granular materials. Another drawback is the additional parameters imposed on the model through interface elements, necessary to transmit the efforts between discrete and finite elements (DANG; MEGUID, 2013). It is also important to note that, depending on the model, the number of degrees of freedom for the geosynthetic or geogrid elements may be very large, resulting in high computational cost.
In the case of exclusively discrete models with geosynthetics or geogrids formed from agglomerates of spheres, the computational cost is also a difficulty, since the reinforcement modeling by this method introduces a considerable increase in the amount of elements of the problem. Chareyre and Villard (2005) also indicate two important limitations of this alternative. First, the artificial numerical roughness created on the surface of geosynthetic sheet or geogrid members by the spheres that compose it. The second is related to the deformation behavior of the reinforcement, if the axial strain in the members is large, significant voids will be created between the members spheres contacts.
Effeindzourou et al. (2016) described a method for the discrete modeling of deformable objects with arbitrary geometries. The main idea is to apply the Minkowski sum (SKIENA, 1997), also known as morphological dilation, in polytopes and round bodies to describe the topology of objects. The method is an extension of the technique introduced by Chareyre and Villard (2005) and later used by Bourrier et al. (2013) in three-dimensional modeling of plant roots. With this idea it is possible to capture the continuous nature of the elements that compose the reinforcement but without the problems described above. Considering this, the present thesis presents a new proposal of geogrid modeling in discrete
models, using two types of elements introduced in the works of Bourrier et al. (2013) and Effeindzourou et al. (2016). This new proposal is used to compose the scope of the thesis, which is the study of aspects of the interaction between granular materials and reinforcement by three-dimensional DEM modeling of the geogrid-reinforced layer. The auxiliary tool for DEM used in this scope was the open-source framework Yet Another Dynamic Engine – YADE (ˇSMILAUER et al., 2015c).
1.2
Aim and objectives
The main motivation of this study is precisely the interface between reinforcement and granular materials. The lack of a better understanding of the stress distribution in the reinforced layer makes it difficult to accurately determine the material-reinforcement interface parameters in macroscopic models. Therefore, this negatively affects the analysis as well as the optimized design of geosynthetic reinforced structures. Thus, there is much interest in making progress in understanding this problem.
The interaction between reinforcement and granular material depends on many factors such as granular particle heterogeneity, reinforcement characteristics, confining pressure and porosity of the reinforced layer, reinforcement spacing in multilayer reinforcement solutions, among others. The numerical approach with a well articulated model allows agile studies on the specific importance of each of the factors involved and the identification of those with the greatest capacity to govern the behavior of the reinforced structure.
The aim of this work is to improve the understanding of the interaction between granular materials and geosynthetic reinforcement in geogrid-reinforced layers, through an approach by the Discrete Element Method. The perspective is that this thesis can contribute with new studies related to the use of geogrids or even help to skip steps in new works that choose to develop the approach presented here.
A new proposal for discrete geogrid modeling using deformable elements is presented as well as details for the preparation of numerical samples of geogrid-reinforced layer. In addition, geogrid pullout simulations are developed to study mechanisms of interaction between granular material and reinforcement. In the scope of this work, the following objectives can also be highlighted:
• To study possible numerical approaches to the geogrid-reinforced layer and to ex-amine their respective strengths and weaknesses;
• To provide a numerical representation that captures the attributes of actual geogrids that are important to adequately describe their mechanical behavior (i.e., stretching, bending, shearing, and twisting) and their interaction with granular media particles;
CHAPTER 1. INTRODUCTION 21 • To develop a well-articulated numerical model that can take into account interaction
between particles and geogrid elements;
• To analyze the behavior of the modeled geogrid for classical load cases and to com-pare with analytical solutions to validate the numerical model response;
• To discuss the possibilities that the proposed model offers to study the problem; • To compare geogrid pullout simulations involving samples with different amounts of
both spherical and agglomerated particles;
• To evaluate forces in longitudinal and transverse geogrid yarns as well as in different segments or members of the reinforcement structure by geogrid pullout simulation; • To synthesize the individual importance of the parameters that govern the behavior
of the geogrid-reinforced layer;
• To recommend improvements to the numerical model from its verified potential; • To provide a study that can help improve numerical modeling of geogrid, which in
turn contributes to solutions involving this type of reinforcement material.
1.3
Thesis outline
This thesis is divided into five main parts. The parts are separated into chapters as summarized below:
• Chapter 2
This section describes applications of geosynthetic reinforcements and some as-pects considered important for the thesis topic. Notions of different approaches to modeling geogrid reinforced layers found in the literature are also described in this part. The chapter closes with a brief explanation of the Discrete Element Method.
• Chapter 3
The auxiliary tool for the Discrete Element Method used in this thesis was the open-source framework Yet Another Dynamic Engine – YADE. This chapter introduces this auxiliary tool, highlighting aspects of DEM in YADE that define the simulation loop. The first simulations performed in YADE in order to know important points for the development of the thesis numerical model are also included here.
• Chapter 4
This chapter is entirely concerned with the numerical model of the thesis. The modeling of both the granular assembly and geogrid used in sample preparation is detailed in this section. All processes and settings for the geogrid pullout simulation are also presented.
• Chapter 5
Simulations used to demonstrate and validate the numerical geogrid’s response to classical load cases are presented. An overview of the capabilities of the de-veloped numerical model is given prior to the presentation of geogrid-reinforced layer analyzes. Geogrid pullout simulations were performed to support these analyzes. The section concludes with the presentation and discussion of the results of three-dimensional geogrid pullout simulations for samples varying quantities and geometry of granular particles.
• Chapter 6
This last part of the thesis deals with the overall conclusion of the presented studies and final comments. A discussion about possible improvements of the developed approach and proposals for future works ends the present work.
2 Approach to the Problem
2.1
Geosynthetic reinforcement considerations
In the case of embankments on soft compressible or low strength soils, stability is mainly related to the shear strength of the foundation material, and the construction of these structures is generally conditioned to a load capacity problem, as noted in BSI (2010). Thus, solutions involving geosynthetic reinforcements (e.g., geotextiles and ge-ogrids) for the purpose of improving load distribution in the compressible layer or uni-forming the embankment foundation settlement are important alternatives to be rigorously developed.
Geosynthetic reinforcements with increasingly stiffness have been required to meet high embankments load levels, as analyzed by Blanco (2013). Geosynthetic reinforce-ments with high stiffness have restricted or even specific production and can result in economically uninteresting solutions. Therefore, the importance of reinforcement opti-mization in geosynthetic reinforced layer designs should be emphasized, which in turn depends mainly on understanding the interaction between materials.
It is worth mentioning that the geosynthetic reinforced layer technique does not only cover the use of coarse granular materials. For example, Riccio et al. (2014) confronts the measurement and prediction (i.e., by analytical and numerical methods) of reinforcement tension in an instrumented section of block-faced geogrid wall built using fine-grained tropical soils as backfill. There are several studies in the literature on the effect of geogrids as reinforcement in fine soils. Almeida et al. (2007) presented data from field monitoring of a pile-supported embankment reinforced with a bi-directional geogrid. In this case, the geogrid is between a pre-existing embankment and a backfill that comprises well-graded sandy-clayey compacted soil. The investigations presented by Palmeira et al. (2013) showed the beneficial effect of the geogrid on the stability of two bridge abutments, including the reduction of lateral displacements. The filling material used to build the abutments was a random Brazilian soil with grain sizes varying from fine sand to blocks of rock.
embed-ded in fine sandy soils. Palmeira and Bernal (2015) examined the use of geogrid in buried pipes to increase maximum uplift resistance due to pipe bucking or buoyancy. Tupa and Palmeira (2007) investigated the soil-reinforcement technique to protect and minimize the consequences of eventual collapses in pressurized tubes.
In geosynthetic reinforced soil – GRS walls with well-graded sand backfill material, composed of crushed quartz powder with a significant amount of fines (i.e., 19 % passing the No. 200 sieve), Mirmoradi and Ehrlich (2018) conducted experimental studies on the effect and importance of compaction conditions close to the wall facing. Another example is the comparison presented by Santos et al. (2014) between the performance of two GRS built with recycled construction waste backfill (i.e., approximately 12 % passing the No. 200 sieve).
Even in silty and clayey soils, the use of geogrids as reinforcement of the layer shows relevant improvements in mechanical behavior. For example, data from the instrumented pullout test of two types of geogrids shown by Sieira et al. (2009) indicate this behavior for silty sand and clayey silt soils. Palmeira et al. (2002) presented theoretical and ex-perimental studies of the interaction between soils and geosynthetic layers in large scale ramp tests. This study included a comparison between different types of soil and geosyn-thetic reinforcements. One of the soils used was a residual clayey soil with 70 % by weight passing through the No. 200 sieve. Among the reinforcements, there were two polyethylene terephthalate – PET geogrids with a square aperture width of 20 mm and 30 mm, respectively. Fran¸ca and Bueno (2011) performed creep tests using, among other geosynthetics, a geogrid with a square aperture width of 28 mm. These tests included the geogrid embedded in clayey sand soil. The results indicated that soil confinement (i.e., in-soil tests) considerably reduced the creep strain of the geosynthetic reinforcement.
In addition to the uses mentioned above, geosynthetic reinforcements also have appli-cations in road and rail works. Garcez (1999) describes the methods proposed by Giroud and Noiray (1981), Milligan et al. (1989a) e Milligan et al. (1989b), Sellmeijer (1990), Houlsby and Jewell (1990), and Burd (1995) for the design of geosynthetic-reinforced bases. Ferreira (2008) discusses the benefits of this type of design solution and introduces newer design methods.
The geosynthetic reinforcement solution is also applicable in situations of shallow foun-dations supported by low bearing capacity, highly deformable, and low shear strength soils. Fabrin (1999) analyzed the applicability of geosynthetics to reinforce pipeline foundations in regions with low strength soils. The author indicated that the inclusion of the reinforce-ment reduces both the initial and consolidation strain as well as increasing the bearing capacity of the foundation layer.
embank-CHAPTER 2. APPROACH TO THE PROBLEM 25 ments or foundation layers does not normally change the consolidation of the compressible layer. Nevertheless, the deformation behavior of the geotechnical structure is modified, particularly when the technique employed results in greater stiffness in the embankment base layer or foundation layer. For example, building a reinforced granular mattress prior to the embankment. Studies by Vidal (1985), Williams and Sanders (1985), and Dash et al. (2003) have indicated that the stiffness properties provided by this layer at the base of the embankment influence the deformation of the low strength foundation soil, ensuring a more uniform load distribution and stress field for the foundation.
A more homogeneous stress field on the foundation layer is a desirable condition, es-pecially when low strength soils are present, such as embankments on soft compressible soils. Therefore, the behavior for the reinforced granular mattress mentioned above sug-gests that including multiple geosynthetic reinforcement basal layers interspersed with granular material may be an advantageous solution. Multiple reinforcing basal layers, along with granular material, may result in a mattress layer with improved stiffness in ad-dition to including tensile strength elements. In this sense, the use of more than one basal reinforcement layer with properties (i.e., stiffness and tensile strength) lower than those calculated considering a single layer may result in a more optimized and economically interesting solution.
Theoretically, it is possible to distribute the tensile force of a geosynthetic reinforce-ment between two or more layers of reinforcereinforce-ments overlapping each other. It should be noted, however, that in cases involving large strains and multiple reinforcements with different tensile strengths, field testing indicates that the higher strength reinforcement, generally the one placed at the base, mobilizes higher forces (ROWE; LI, 2001). Moreover, in multiple layers of overlapping reinforcements with identical properties, the installed lower layer tends to receive the highest tensile forces (KOERNER, 1998). However, the precise distribution of forces in this type of structure is not fully understood. It depends on the interaction between geosynthetic layers and granular material. Many factors af-fect this behavior, for example, the attributes of the reinforcements, the distance between them, and the characteristics of the filler material employed.
One of the most recent publications on recommendations and guidance for multi-layer reinforcement problems is the standard BS 8006-1 (BSI, 2010). This standard prescribes, in multi-layer solutions, reinforcement layers of equal strength and stiffness and assigns individual reduction coefficients in the design strength calculation. Despite these consid-erations, BSI (2010) recommends, wherever possible, to use only one sufficiently strong reinforcement layer, justifying that the precise distribution of forces in such structures is not fully understood.
Indeed, the study of the behavior of structures involving a single reinforcement layer by FEM already presents difficulties in the correct determination of the interface parameters
between the reinforcement and the granular material. To understand this subject matter, it is necessary first to explain the mechanisms that govern the material-reinforcement interaction. Therefore, the study of the behavior of geogrid-reinforced layers, showing the material-reinforcement interaction, is a relevant topic to be developed. Any contribu-tion that enhances understanding of this interaccontribu-tion in both single-layer and multi-layer solutions is considered very useful not only in cases involving embankments on poorly supported soils, but also in cases of foundation reinforcement, reinforced soil wall, and road and rail infrastructure work. Knowledge gained from understanding the mechanisms involved in this problem contributes to the ability to evaluate stress concentration in both soil and reinforcement, improve numerical modeling, and develop better design solutions from a technical, economic, and environmental point of view.
2.2
Possible approaches to the problem
Although continuous numerical methods, for example, the Mohr-Coulomb linear elastic and perfectly plastic model of the classical soil mechanics, are widely used in engineer-ing, there are problems where they are not suitable, such as those where discontinuities influence overall behavior. Discontinuous nature problems with significant levels of de-formation require specific numerical models whose formulations admit localized behaviors in the contacts. Soil-reinforcement interaction has a complex behavior, especially under loading and unloading conditions, whose study requires the use of specific numerical mod-els that can take into account the granular nature of the soil and its interaction with the reinforcement.
In reality, there is no numerical model capable of perfectly reproducing the behavior of soils with all their complex arrangements and heterogeneous compositions. However, the use of models that can take into account the main characteristics of soils or granular materials required by a given problem can lead to very realistic behaviors, providing proper results and assisting the development of geotechnical engineering.
The granular nature of the material and the mechanisms of interaction between the granular material and the reinforcement have a decisive impact on the mechanical behavior of the geogrid-reinforced layer. From this perspective, aiming at a numerical study that involves important aspects to reproduce a realistic behavior of the modeled structure, three approaches can be highlighted:
• Critical state-based advanced models; • Cosserat continuum mechanics; • Discrete Element Method.
CHAPTER 2. APPROACH TO THE PROBLEM 27 Critical state-based advanced models calculate deformations of a given element from its stress state. These models may be valid for two-dimensional and three-dimensional stress states and are considered generalized (BRITTO; GUNN, 1987). The Massachusetts Institute of Technology – MIT models MIT-E3 and MIT-S1 are relatively recent examples. MIT-E3 was developed to describe the behavior of overconsolidated clays as well as clays under cyclic loading. This model aims to group important characteristics of the non-linear, inelastic, and anisotropic behavior of the previously mentioned soil types ( WHIT-TLE; KAVVADAS, 1994). Aubeny (1992) obtained realistic estimates of shear stresses with the MIT-E3 model for an ideal cylindrical cavity expansion condition.
MIT-S1 is a generalized model capable of simulating elastoplastic properties of ma-terials and was developed to analyze the anisotropic behavior of a wide variety of soils. The main idea that distinguishes it from other models (i.e., constitutive laws) is the ex-plicit inclusion of effective stress and void ratio as independent variables controlling the mechanical response of the model, including anisotropy directions based on the orienta-tion of the bounding surface and its evoluorienta-tion with rotaorienta-tional hardening. In this type of approach, new expressions can be introduced to describe nonlinearities in small defor-mations, which allows more realistic evaluations in both clay and sand, as described in Pestana and Whittle (1999).
In the context of generalized continuous media, the Cosserat theory or micropolar elasticity is appropriate for modeling rupture mechanisms in materials with strong mi-crostructure influence on their overall behavior. Cosserat continuum adds rotational de-grees of freedom to the conventional continuum, which makes it possible to take into account moments at any point in a given material, in addition to the usual stress field (COSSERAT; COSSERAT, 1909). Each particle is comparable to a small-size continuum around a point that characterizes it. Because of this, in the kinematics of the material point, additional rotational degrees of freedom occurs, and the gradient of these rotations is associated with a stress moment tensor by the principle of virtual works (FIGUEIREDO et al., 2004). Another aspect is the constitutive description of the material that considers
intrinsic lengths. The introduction of these lengths in the constitutive relations allows indirect consideration of the particle size and geometry in the macroscopic behavior of the medium (VARDOULAKIS; SULEM, 1995; VARDOULAKIS, 2019).
Ebrahimian et al. (2012) simulated shearing at the interface between a layer of granular material and a rough structure using an improved model with Cosserat theory. Although the lack of both numerical and experimental studies that investigate deformations in the soil-structure interface regions makes it difficult to validate this model, the advances obtained by the author indicated the relevance of this approach. An interesting study was the comparison between parameters that control the thickness of the formed shear band. Between the initial void ratio, average grain size, and vertical pressure, the first
two indicated greater influence on the shear band. It is worth mentioning that the au-thors assumed simplifications that affect the model’s behavior. For example, balancing factors, which reflect aspects of the microstructure in the constitutive model, such as slip-ping and shearing between particles, were defined as equal to one by simplification. The work also assumed full bonding in the interface region, so there are no relative horizontal displacements between the bottom surface of the granular layer and the rough surface. Regarding the kinematic boundary conditions in the interface, the study considered two antagonistic cases. The first one considers the model with zero couple stresses, that is, the free Cosserat rotation is assumed, which is a condition equivalent to that of classical continuum mechanics. The second case assumes fully constrained Cosserat rotation (i.e., zero rotations). The two cases are antagonistic, so a study that includes an intermedi-ate boundary condition to the described cases could represent a behavior closer to that expected in geotechnical soil-structure interaction problems. Simplifications are usually necessary to introduce very complex problems, and considering the lack of research on the subject, the authors’ numerical results contribute to further advances in this topic.
The Discrete Element Method, also called the Distinct Element Method, models the material as constituent particles in which contacts can change during deformation. This method is essentially a set of numerical processes for calculating motion and its effect on a particular group of particles or elements whose behavior is governed by physical laws. Cundall (1971), as cited in Cundall and Strack (1979), originally proposed this method to study problems related to Rock Mechanics. However, its application has extended to the study of micromechanisms in granular media, as in Cundall and Strack (1979), Hori (1996), and Mirghasemi et al. (1997), and in the behavior of clays, as in Anandarajah (2003). The simulation of a medium by a discrete body system (i.e., elements) is a highly dynamic process with periodic changes of the forces acting on the contacts. Thus, the computational implementation of DEM is fundamental and also makes possible the use of this numerical method in different types of problems. Consequently, the computational cost of a given problem becomes a crucial point for the discrete numerical approach.
A moderate increase in the number of elements for a more realistic numerical model can produce a significant increase in computational tasks. There is a high computational cost inserted in the task of updating the contact status between elements since the model performs this task whenever there are body displacements that, in turn, change the con-tact status. Many DEM codes take advantage of parallel processing capabilities (i.e., a particular coupled form of distributed computing) to extend the number of elements in a simulation. With the enhancement of computer processing capabilities and the use of more agile numerical algorithms, the simulation of increasingly complex problems by DEM has become feasible and accessible.
ap-CHAPTER 2. APPROACH TO THE PROBLEM 29 proaches, DEM allows modeling the complex behavior of granular materials and their interaction with structural elements by using a relatively small number of parameters. For this reason and due to the discrete feature of the method, which provides effective modeling of the granular nature present in geogrid-reinforced layers and also the inter-action mechanisms between material and reinforcement, this thesis focuses on the use of DEM approach. The tool chosen to support the discrete modeling was YADE. It is an extensible open-source framework for discrete numerical models focusing on DEM. The use of this tool is mainly due to the robustness of the codes and the possibility of implementing algorithms and functions with full source code control.
2.3
Discrete Element Method – DEM
A dry granular medium, for example, is composed of a large number of particles that can move separately and interact with each other at the contact points. This discrete as-pect produces complex media behavior under loading and unloading conditions. Discrete modeling makes it feasible to study this behavior in an articulated manner. As mentioned in the previous section, the method is composed of numerical processes that calculate motion and its effect on a group of particles or elements.
In a way, DEM can be considered similar to Molecular Dynamics, which studies the physical motion of atoms and molecules from the interaction potential between parti-cles and the equations governing their movement (HAILE, 1992), but including rotational degrees of freedom, contact state, and more complex geometries (e.g., polyhedra). The first studies involved applying the method to the simulation of progressive movements in rock masses (CUNDALL, 1971 apud CUNDALL; STRACK, 1979). Many studies today use DEM to model a wide variety of materials and applications have increasingly shown that the method is a helpful, powerful, and necessary tool for geotechnical problems involving discontinuous media.
Despite the application of the method to problems involving mechanical interaction be-tween particles, DEM can also incorporate physical-chemical interaction laws for analysis in clays, for example. Anandarajah (1994) developed an approach using DEM to simulate cohesive soil behavior. This study ignored the attractive force but modeled the repul-sive force based on a study on the double-layer repulrepul-sive force between inclined particles. Other examples are the three-dimensional DEM model developed by Yao and Anandara-jah (2003), which comprises cuboid particles for numerical analysis of assemblies of clay particles, and the DEM framework developed by Lu et al. (2007) to quantitatively model the formation of kaolinite aggregates during a sedimentation process. The possibilities offered by DEM make it capable and with the potential to also deal with problems in
tropical soils with fines.
According to Cundall and Strack (1979), the basic principle for the formulation of the method is the idea of a dynamic process based on the laws of motion of the English physicist Sir Isaac Newton, in which, from the propagation of perturbations applied to the limits or the elements themselves, individual movements in the particles are generated, which in turn result in contact forces and subsequent displacements until an equilibrium condition. In the numerical description of this dynamic process, accelerations and veloc-ities are considered constant at the specified time intervals. The assumed time interval is so short that the above consideration is acceptable. The method also assumes that over a time interval, applied or generated perturbations can only propagate to immediate neighboring elements. Therefore, at each time step, the resultant force on any element are calculated exclusively by the sum of the contact forces and the field forces imposed on it, such as gravitational, magnetic, and electrostatic forces (BHARADWAJ, 2012). The flowchart of Figure 2.1 presents the basic scheme of a DEM simulation, which is charac-terized by the balance of forces on the elements at each time increment to reproduce the complex behavior of the material.
FIGURE 2.1 – The sequence of a typical DEM modeling.
The DEM calculation steps alternate between applying a force-displacement law and Newton’s second law of motion. The first law provides the contact forces resulting from displacements caused and the second law the movement of each element from the forces acting on it. To illustrate the calculation cycle and to show how the method calculates forces and displacements, Figure 2.2 replicates the example presented by Cundall and Strack (1979). The simplicity of this case makes the explanation of the method didactic.
CHAPTER 2. APPROACH TO THE PROBLEM 31
FIGURE 2.2 – Two disks laterally compressed by rigid walls. Adapted from Cundall and Strack (1979).
Figure 2.2 shows two negligible weight disks, represented by x and y, which are laterally compressed by a pair of rigid walls. The walls move toward each other at a constant velocity v. Initially, at time t0, the disks touch the walls with all contact forces equal to zero. After the time interval ∆t, the walls move at a distance equal to v · ∆t relative to the original position. Under the assumption that disturbance propagation can only occur through immediate neighboring elements, both disks remain in their positions until the time interval t1 (i.e., Figure 2.2).
It is important to note that since the strain of a single particle is considerably lower than the whole sample strain, it is not necessary to accurately determine the deformations of each element to obtain adequate mechanical behavior of the numerical sample. Thus, in the formulation presented by Cundall and Strack (1979), the overlapping elements indicate particle strain during contact. Because of that, at time t1, the elements overlap at the contact points A and C, as shown in Figure 2.2.
In Figure 2.2, after the time increments, the contact point A is defined as half the distance between the projected points on the disk and the wall and defined by AD and
AW, respectively. Thus, the normal relative displacement at contact and time t1 is the
displacement of point AW relative to that of point AD and can be calculated by:
∆nA t1 = v · ∆t (2.1)
where
∆nA t1 = relative displacement at contact point A occurring at time t1;
v = wall velocity; ∆t = time increment.
re-spective contact forces. Then, a force-displacement law applies, which can be as follows:
∆Fn= kn· ∆nt1= kn· v · ∆t (2.2)
where
∆Fn = increment in normal force;
kn = normal stiffness coefficient;
∆nt1 = normal relative displacement at contact point at time t1 (i.e., v · ∆t).
Taking positive forces in the directions of the axes shown in Figure 2.2 and knowing that the contact forces are zero at time t0, the resultant forces for disks x and y at time t1 are calculated by:
Fx t1 = kn· ∆nt1 (2.3)
Fy t1 = −kn· ∆nt1 (2.4)
where
Fx t1 = resultant force on disk x at time t1;
Fy t1 = resultant force on disk y at time t1.
From the contact forces on each element, it is possible to calculate the acceleration generated on the disks at time t1 by applying Newton’s second law (i.e., Eqs. 2.5 and 2.6). ¨ x1 = Fx t1/mx (2.5) ¨ y1 = Fy t1/my (2.6) where ¨
x1 = acceleration of disk x in the 1-axis direction;
¨
y1 = acceleration of disk y in the 1-axis direction;
mx = disk x mass;
my = disk y mass.
The calculated accelerations in Eqs. 2.5 and 2.6 are constant over time between t1 and t2 for very short time intervals and can be integrated to obtain velocities (i.e., Eqs. 2.7 and 2.8).
CHAPTER 2. APPROACH TO THE PROBLEM 33
˙
yt2 = (Fy t1/my) · ∆t (2.8)
where
˙xt2 = disk x velocity in the time interval between t1 and t2;
˙
yt2 = disk y velocity in the time interval between t1 and t2.
Thus, the relative displacement increments at the contacts (i.e., contacts points A, B, and C) at time t2 are calculated Eqs. 2.9 to 2.11, considering positive displacements for compression:
∆nA t2 = [v − (Fx t1/mx) · ∆t] · ∆t (2.9)
∆nB t2 = [(Fx t1/mx) · ∆t − (Fy t1/my) · ∆t] · ∆t (2.10)
∆nC t2= [(Fy t1/my) · ∆t − (−v)] · ∆t (2.11)
where
∆nA t2 = relative displacement increment at contact A at time t1;
∆nB t2 = relative displacement increment at contact B at time t1;
∆nC t2 = relative displacement increment at contact C at time t1.
In summary, the basic DEM calculation cycle involves firstly calculating the contact forces caused by some disturbance in the elements, secondly the accelerations associated with these forces, thirdly the velocities as a function of accelerations and finally the resulting displacements. The integration scheme divides the time step into two parts so that it is possible to obtain forces and accelerations for the first half and the velocities and displacements for the end of the time step. This cycle composed of a force-displacement law and Newton’s second law repeats until an imposed condition or time limit, usually representative of a state of equilibrium.
In the general case, involving many elements and three-dimensional configuration, the force-displacement law applies to each of the contacts, and both normal and shear components can result. It is possible to incorporate a Coulomb-type friction law into the formulation so that the model provides shear strength in the contacts. In this case, the vector sum of contact forces of an element calculates the resultant force acting on it. It is also possible to introduce contact damping forces into the formulations. This damping enters as a value in the sum of the contact forces. The method is articulated and also allows to include other types of force components in the model, for example, global damping in motion calculations, acting directly on the absolute velocities of the elements.
2.4
Discrete modeling of geosynthetic reinforcements
The soil-structure interaction in problems involving large deformations is one of the appealing and challenging topics of geotechnical engineering. This topic is broad and can include tunneling, foundations, retaining structures, soil reinforcement, etc. In cases involving geogrid-reinforced granular materials, FEM-only numerical study cannot ade-quately capture the interlocking of granular materials in the openings of the geosynthetic reinforcement and therefore does not consider proper interface features of such structures. In contrast, DEM has proven its efficiency in modeling micromechanical problems. In this context, some authors present alternatives involving discrete models for the study of this interaction of granular materials with the reinforcement layer.
One approach used is the FEM and DEM coupling (O ˜NATE; ROJEK, 2004) to take ad-vantage of both methods, modeling in one single model the continuous behavior of struc-tural elements by FEM and the discrete nature of granular materials by DEM. Although this multi-domain approach is already established, including open-source availability for it (STR ´ANSK ´Y; JIR ´ASEK, 2012; STR ´ANSK ´Y, 2013), there are still few studies focusing on modeling geosynthetic reinforcements (e.g., geotextiles and geogrids). Works such as those presented by Villard et al. (2009), Tran et al. (2013), and Tran et al. (2015) still seek to improve understanding of interactions between granular materials and reinforcement ele-ments.
Villard et al. (2009) presented a dedicated numerical model to study soil interaction with a continuous and homogeneous geosynthetic reinforcement layer. The authors pro-posed a specific contact law for the soil-geosynthetic interface considering the case of a reinforced embankment over an area subject to potential cavities (i.e., subsidence). Tran et al. (2013) investigated the pullout behavior of a biaxial geogrid in a granular medium. Tran et al. (2015) proposed multi-domain coupling to numerically investigate two cases, one related to the efficiency of geosynthetic reinforcement in increasing soil loading capac-ity for shallow foundations and the other concerning the use of geogrid in a hypothetical subsidence case.
Tran (2013) presents the mathematical and numerical development of a FEM and DEM coupling algorithm for the study of soil-structure interactions. The framework used by Tran (2013) and Tran et al. (2015) to couple the two numerical methods is an extension of the work originally presented by Dang and Meguid (2013). These works used the dynamic relaxation method presented by Dang and Meguid (2010) in the part that applies FEM.
It is important to highlight that although multi-domain coupling is an interesting al-ternative to multi-scale problems, as presented by Cheng et al. (2017), in this approach it is difficult to precisely define the contact behavior between discrete elements and finite
ele-CHAPTER 2. APPROACH TO THE PROBLEM 35 ments, especially in cases involving complex three-dimensional geometries. It is necessary to use interface elements to make this contact between numerical methods, which in turn impose new parameters on the model. Moreover, when the FEM domain is composed of volumetric elements, the number of degrees of freedom of this domain can be very large, resulting in high computational cost simulations.
Another approach to the problem found in the literature is purely discrete models. Authors have modeled geogrids from rigid aggregates or agglomerates formed by less complex geometry elements linked together, such as spheres. Figure 2.3 illustrates a numerical representation of a geogrid by this approach. The introduction of internal degrees of freedom in the rigid aggregate of spheres allows the modeled structures to be deformable.
(a) Reference geogrid (b) Numerical geogrid (c) Numerical geogrid node showing linked spheres
FIGURE 2.3 – Geogrid modeling from sphere aggregates (KONIETZKY et al., 2004).
Purely discrete modeling applications involve diverse studies. Konietzky et al. (2004) studied the effect of geogrid interlocking for static and cyclic loading cases. McDowell et al. (2006) applied discrete modeling for a geogrid-reinforced ballast layer. Zhang et al. (2007) studied the influence of soil compaction, considering different porosity values, in geogrid pullout simulations. Lobo-Guerrero and Vallejo (2010) analyzed the mechan-ical improvement of granular materials with the inclusion of synthetic fibers. Bhandari and Han (2010) investigated soil-geotextile interaction in cases of cyclic vertical loading. Chen et al. (2012) compared geogrid-reinforced ballast layer behavior under confined and unconfined conditions. Ferellec and McDowel (2012) examined the influence of ballast particle geometry on ballast-geogrid interaction. Han et al. (2012) studied the behavior of the geogrid in solutions involving piled embankment with basal reinforcement. Chen et al. (2013) simulated the pullout test of geogrid reinforcement in layers of railway bal-last. Lackner et al. (2014) studied mechanisms of interaction between soil particles and geosynthetic reinforcements.
three-dimen-sional models of geogrids with square and triangular openings aiming at a realistic rein-forcement shape. Another example is the work in which Chen et al. (2019) performed two-dimensional numerical pullout tests with discretely modeled geogrids and evaluated the effect of geogrid tensile stiffness on the micro-mechanical behavior of the reinforced layer. Both cases model the geogrids connecting spherical elements. They use the parallel bond contact model to create different sphere arrangements. This contact model is like two parallel surfaces positioned in the contact plane that provides mechanical properties of an elastic bond between the two contacting spheres. Thus, it is possible to take into account the transmission of forces and moments between the particles that make up the geogrid.
It is important to highlight two downsides of this type of numerical approach. The first is that modeling the geogrid or geosynthetic reinforcement from sphere aggregates, for example, results in a significant increase in the total number of elements considered, which reduces the computational efficiency of the numerical model. The other one is an artificial numerical roughness on the reinforcement surface caused by the agglomerated elements, which may result in unrealistic behavior of the numerical model.
The method used by Chareyre and Villard (2005), Bourrier et al. (2013), and Effeind-zourou et al. (2016) allows the modeling of deformable elements. EffeindEffeind-zourou et al. (2016) demonstrated the versatility and capabilities of this approach and some potential applications to study soil-inclusion systems. This thesis highlights the cylinder presented by Bourrier et al. (2013) and the particle facets described by Effeindzourou et al. (2016). Effeindzourou et al. (2017) used these elements to model a damping system for rockfall protection. Damping systems can work as cushion layers for rockfall galleries. Effeind-zourou et al. (2017) modeled a damping module composed of cylindrical wire mesh, two steel rings, a geotextile lining and granular filling material (i.e., Figure 2.4). The au-thors used cylinders to model the wire mesh and steel rings, particle facets to model the geotextile, and spheres to model the filling material.
(a) Cylindrical wire mesh and steel rings
(b) Geotextile lining (c) Module filled with gran-ular material
FIGURE 2.4 – Discrete modeling of damping module for rockfall protection ( EFFEIND-ZOUROU et al., 2017).