HAL Id: hal-01554743
https://hal.archives-ouvertes.fr/hal-01554743
Submitted on 9 May 2018
HAL is a multi-disciplinary open access
archive for the deposit and dissemination of
sci-entific research documents, whether they are
pub-lished or not. The documents may come from
teaching and research institutions in France or
abroad, or from public or private research centers.
L’archive ouverte pluridisciplinaire HAL, est
destinée au dépôt et à la diffusion de documents
scientifiques de niveau recherche, publiés ou non,
émanant des établissements d’enseignement et de
recherche français ou étrangers, des laboratoires
publics ou privés.
galaxies at z 5 behind the massive cluster RCS 0224
Renske Smit, A.M. Swinbank, Richard Massey, Johan Richard, Ian Smail, J.P.
Kneib
To cite this version:
Renske Smit, A.M. Swinbank, Richard Massey, Johan Richard, Ian Smail, et al.. A
gravitation-ally boosted MUSE survey for emission-line galaxies at z 5 behind the massive cluster RCS 0224.
Mon.Not.Roy.Astron.Soc., 2017, 467 (3), pp.3306-3323. �10.1093/mnras/stx245�. �hal-01554743�
A gravitationally-boosted MUSE survey for emission-line
galaxies at z & 5 behind the massive cluster RCS 0224
?
Renske Smit,
1A.M. Swinbank,
1,2Richard Massey,
1,2Johan Richard,
3Ian Smail,
1,2and J.-P. Kneib
4,51Centre for Extragalactic Astronomy, Durham University, South Road, Durham DH1 3LE UK 2Institute for Computational Cosmology, Durham University, South Road, Durham DH1 3LE UK
3Univ Lyon, Univ Lyon1, Ens de Lyon, CNRS, Centre de Recherche Astrophysique de Lyon UMR5574, F-69230, Saint-Genis-Laval, France
4Institute of Physics, Laboratory of Astrophysics, Ecole Polytechnique F´ed´erale de Lausanne (EPFL), Observatoire de Sauverny, 1290 Versoix, Switzerland 5Aix Marseille Universit´e, CNRS, LAM (Laboratoire d’Astrophysique de Marseille) UMR 7326, 13388, Marseille, France
Accepted 2017 January 26. Received 2017 January 16; in original form 2016 September 4
ABSTRACT
We present a VLT/MUSE survey of lensed high-redshift galaxies behind the z = 0.77 cluster RCS 0224−0002. We study the detailed internal properties of a highly magnified (µ ∼ 29) z = 4.88 galaxy seen through the cluster. We detect wide-spread nebular C ivλλ1548,1551 ˚A emission from this galaxy as well as a bright Lyα halo with a spatially-uniform wind and absorption profile across 12 kpc in the image plane. Blueshifted high- and low-ionisation interstellar absorption indicate the presence of a high-velocity outflow (∆v ∼ 300 km s−1) from the galaxy. Unlike similar observations of galaxies at z ∼ 2 − 3, the Lyα emission from the halo emerges close to the systemic velocity - an order of magnitude lower in velocity offset than predicted in “shell”-like outflow models. To explain these observations we favour a model of an outflow with a strong velocity gradient, which changes the effective column density seen by the Lyα photons. We also search for high-redshift Lyα emitters and identify 14 candidates between z = 4.8 − 6.6, including an over-density at z = 4.88, of which only one has a detected counterpart in HST /ACS+WFC3 imaging.
Key words: galaxies: high-redshift – galaxies: formation – galaxies: evolution
1 INTRODUCTION
Over the last decade, deep observations of blank fields, in particular with the Hubble Space Telescope (HST) have iden-tified a substantial poplation of galaxies beyond z > 3, using broadband photometry (e.g.Madau et al. 1996;Steidel et al.
1996,1999;Sawicki et al. 1997;Lehnert & Bremer 2003;
Gi-avalisco et al. 2004;Ouchi et al. 2004;McLure et al. 2009;
van der Burg et al. 2010; Bowler et al. 2015; Bouwens et
al. 2015a; Finkelstein et al. 2015). Despite the progress in
identifying large numbers of galaxies, it remains challenging to obtain spectroscopic redshifts and determine the physi-cal properties of these systems. This is largely due to their inherent faintness and the fact that bright rest-frame
opti-? Partially based on observations made with the NASA/ESA
Hubble Space Telescope, obtained at the Space Telescope Science Institute, which is operated by the Association of Universities for Research in Astronomy, Inc., under NASA contract NAS 5-26555. These observations are associated with program #14497.
cal emission-line tracers such as Hα and [O iii], which are traditionally used to measure the properties of the ISM, are shifted to observed mid-infrared wavelengths for sources at z & 3 − 4. The small physical sizes of galaxies at z > 3 com-pared to typical ground-based seeing also makes spatially resolved observations difficult to obtain, inhibiting measure-ments of dynamical masses, star-formation distributions and wind energetics.
Recently, the commissioning of the Multi Unit Spectro-scopic Explorer (MUSE) on the Very Large Telescope (VLT) has led to an advance in the identification and characteri-sation of z ∼ 3 − 6 galaxies though wide-field and deep spectroscopy of the rest-frame ultraviolet (UV) spectra of these sources. For example, MUSE is starting to probe the physical properties of H ii regions within galaxies by ex-ploiting gravitationally lensing through their faint UV neb-ular emission lines such as C ivλλ1548,1551 ˚A, He iiλ1640 ˚A, O iii]λλ1661,1666 ˚A and C iii]λλ1907,1909 ˚A (Karman et al.
2015;Caminha et al. 2016;Patr´ıcio et al. 2016;Vanzella et
al. 2016), lines which are rarely seen in local star-forming
galaxies (e.g.Hainline et al. 2011;Rigby et al. 2015). These lines are produced either by young, metal-poor stellar pop-ulations with high-ionization parameters (e.g. Christensen
et al. 2012b; Stark et al. 2014; Rigby et al. 2015), or gas
photo-ionisation by faint active galactic nuclei (AGN; e.g.
Stark et al. 2015;Feltre et al. 2016). Furthermore, MUSE
has enabled the detailed modelling of extended Lyα emis-sion, gaining insights into the inflowing neutral gas and/or wind energetics in the circum-galactic medium (CGM) of galaxies (Swinbank et al. 2015;Bina et al. 2016;Gullberg et
al. 2016;Wisotzki et al. 2016;Vanzella et al. 2017).
Moreover, MUSE is a promising new instrument for undertaking unbiased spectroscopic surveys. Bacon et al.
(2015) used a 27 hour MUSE pointing of the Hubble Deep Fields South (HDF-S) to detect 89 Lyman-α emitters in the redshift range z ∼ 3 − 6. Remarkably, 66% of the Lyα emit-ters above z & 5 have no counterpart in the HST broadband imaging (to a limiting magnitude of mi∼ 29.5),
In this paper, we extend current work on characteris-ing the UV spectra of intrinsically faint high-redshift galax-ies out to z ∼ 5 through the analysis of VLT/MUSE ob-servations of one of the most strongly magnified galaxies known above a redshift of z > 3; the highly magnified (µ = 13 − 145×) z = 4.88 lensed arc seen through the core of the compact z = 0.77 cluster RCS 0224−0002 (Gladders
et al. 2002;Swinbank et al. 2007, hereafter S07).
S07 observed nebular [O ii] emission and an extended Lyα halo in this z = 4.88 source and they hypothesized that a galactic-scale bipolar outflow has recently bursted out of this system and into the intergalactic medium (IGM). Our new observations obtain significantly higher signal-to-noise ratio (S/N) in the UV emission and continuum, allowing us to resolve the shape of the Lyα profile and detect the UV-interstellar medium (ISM) lines. Furthermore, our MUSE pointing covers the complete z ∼ 6 critical curves, which al-lows for an efficient survey for faint high-redshift Lyα emit-ters. These sources are important targets to study in order to understand the properties of the ultra-faint galaxy popu-lation that could have contributed significantly to reionisa-tion.
This paper is organised as follows: we describe our MUSE dataset and we summarize the complementary data presented by S07 in §2. We analyse the spectral properties of the main z = 4.88 arc in §3. We present the results of a blind search for Lyα emitters in §4and finally we summarise our findings in §5.
For ease of comparison with previous studies we take H0 = 70 km s−1Mpc−1, Ωm = 0.3, and ΩΛ = 0.7, resulting
in an angular scale of 6.4 kpc per arcsecond at z = 4.88. Magnitudes are quoted in the AB system (Oke & Gunn
1983).
2 DATA
2.1 HST imaging
We obtained HST imaging from the Space Telescope Sci-ence Institute MAST data archive (GO:14497, PI: Smit and GO: 9135, PI:Gladdders). RCS 0224−0002 (α = 02:24:34.26, δ = −00:02:32.4) was observed with the Wide Field Plan-etary Camera 2 (WFPC2) using the F666W (V666) filter
(10.5 ks), the Advanced Camera for Surveys (ACS) using the F814W (I814) filter (2.2 ks) and the Wide Field Camera
3 (WFC3) using the F125W (J125) and F160W (H160)
fil-ters (2.6 ks each). The ACS and WFC3 images were reduced with Drizzlepac v2.1.3 to 0.05 and 0.128 arcsec pixel−1 res-olution respectively. The depth of the I814, J125 and H160
band images is 26.3, 26.8 and 26.7 mag respectively (5σ in a 0.500-diameter aperture). The WFPC2 data was reduced with theSTSDASpackage fromIRAFto ∼ 0.1 arcsec pixel−1 resolution as described by S07. A false-color image using the I814, J125 and H160 bands are shown in Figure1. The color
image shows two bright arcs at z = 2.40 (lensed images B1– B6) and z = 4.88 (lensed images 1–4).
2.2 MUSE spectroscopy
We observed the cluster RCS 0224−0002 with a single point-ing (∼ 1 × 1 arcmin) of the VLT/MUSE IFU spectro-graph (Bacon et al. 2010) between November 13, 2014, and September 16, 2015, programme 094.A-0141. Each individ-ual exposure was 1500 seconds, with spatial dithers of ∼15 arcsec to account for cosmic rays and defects. One observ-ing block was partly taken in twilight and therefore omitted from the final data-cube, resulting in a co-added exposure time of 13.5 ks. All the observations we use were taken in dark time with <0.8” V -band seeing and clear atmospheric conditions.
We reduced the data with the public MUSEESOREX
pipeline version 1.2.1, including bias, dark, flat-fielding, sky subtraction, wavelength and flux calibrations. For each in-dividual exposure we used the lamp flat-field taken adjacent in time to the observation for illumination correction. The reduced data-cubes were registered and stacked using the
EXP COMBINEroutine. The seeing measured on the com-bined exposure is ∼0.68” full width half max (FWHM), with a spectral resolution of 94 km s−1(2.2 ˚A) FWHM at 7000 ˚A. A false-color image constructed from the final MUSE cube is shown in Figure1. We use median images centered on 5375 ˚A, 6125 ˚A and 8275 ˚A as broadband inputs and we add a 8 ˚A wide mean image centered on 7146 ˚A to the red channel to emphasize the Lyα emission in the z = 4.88 arc. All bright HST sources are detected in the MUSE continuum, while the z = 4.88 arc is clearly detected with spatially extended Lyα emission. A number of other Lyα sources are identified at the same redshift (see §4).
2.3 SINFONI spectroscopy
To complement the MUSE dataset we exploit the SINFONI IFU spectroscopy presented by S07. Briefly, the SINFONI data was taken in the HK grating (λ/∆λ = 1700) covering the [O ii]λλ3726.1,3728.8 ˚A doublet redshifted to ∼ 2.2 µm. The ∼ 8 × 8 arcsec field-of-view (with a spatial resolution 0.25 arcsec pixel−1) covers the lensed images 2 and 3 of the z = 4.88 arc .
Figure 1. HST I814, J125 and H160 (left panel) and MUSE B, V, I+7143 ˚A (right panel) colour images of the cluster core of
RCS 0224−0002 at z = 0.77. The four images of the lensed galaxy at z = 4.88 are numbered 1–4 in the left panel and are recon-structed in the source plane in the inset panels. We also indicate the coverage of the SINFONI K-band spectroscopy and the images B1-B6 of a zC iii]= 2.4 galaxy and images C1-C2 of a Lyα emitter at zLyα= 5.5 that are used as constraints on the lens model (§3.1).
The z = 4.8 − 6.5 Lyα candidates selected in §4are marked with squares on the right panel (see §4and AppendixD). For the MUSE red channel we combine a broad-band centered on 6125 ˚A with an 8 ˚A-wide narrowband centered on the Lyα halo around the z ∼ 4.88 arc (Gladders et al. 2002); the Lyα emission is clearly extended beyond the continuum. Three sources (L2, L4 and L5) in our blind search for Lyα emitters (§4) are found at the same redshift as the z = 4.88 arc, suggesting a galaxy over-density.
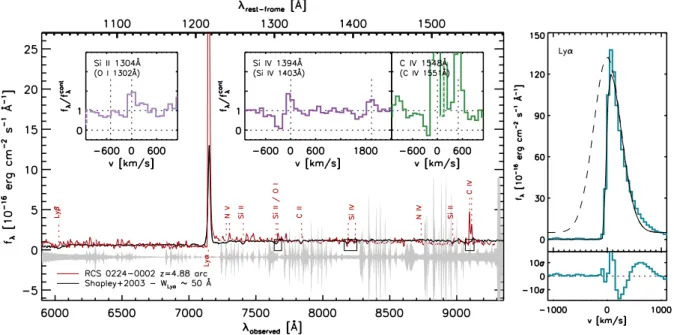
Figure 2. Left panel: The MUSE one-dimensional spectrum extracted over the stellar continuum of the z = 4.88 arc (red line), smoothed with a Gaussian filter with σ = 3 ˚A (the grey filled region shows the sky spectrum, offset from the spectrum for clarity). Regions with strong sky emission lines are omitted for clarity. The solid black line indicates the stacked spectrum of the strongest Lyα emitting Lyman break galaxies in theShapley et al.(2003) sample. The spectrum is normalised to match the z = 4.88 arc continuum at ∼7500 ˚A and redshifted to z[O ii]= 4.8757. The inset panels show the spectra with respect to the [O ii] redshift for the Si iiλ1304 ˚A, Si ivλ1394 ˚A and C ivλ1548 ˚A lines (indicated with black squares on the main spectrum). The spectra are binned to two times lower spectral sampling (2.5 ˚A/pix) and the position of the O iλ1302 ˚A, Si iiλ1304 ˚A, Si ivλλ1394,1403 ˚A and C ivλλ1548,1551 ˚A lines are indicated with dashed lines. The parts of the spectra strongly affected by skylines are indicated with a dashed line in the insets. We detect a single-peaked, strongly asymmetric Lyα line, narrow and strong C iv emission and narrow blueshifted C iv and Si iv absorption lines. All absorption features are signficantly blueshifted with respect to the [O ii] redshift. Right panel: Zoom-in of the observed Lyα line (blue line, top panel) and a Gaussian with Voigt-profile absorber fit to the data (black lines). The narrow Lyα peak in combination with the high-velocity tail are not well described by this simple model as shown by the residuals (bottom panel).
3 ANALYSIS AND DISCUSSION 3.1 Lens model
To constrain the intrinsic properties of the emission-line galaxies in this study we require an accurate lens-model. S07 constructed a simple mass-model of RCS 0224−0002 with the two main elliptical galaxies in the centre of the cluster and the dark matter component approximated by single truncated pseudo-isothermal elliptical mass distri-butions. Their primary observational constraints on the mass configuration are the four lensed images of the z = 4.88 arc. However, our MUSE observations also cover the other arcs in the cluster. We extract spectra over the multiply-imaged central blue arcs (B1–B6 in Fig-ure 1) and detect C iii]λλ1907,1909 ˚A, O iii]λλ1661,1666 ˚A emission and Si iiλ1403 ˚A, Si ivλλ1394,1403 ˚A, Si iiλ1526 ˚A, C ivλλ1548,1551 ˚A, Fe iiλ1608 ˚A, Al iiλ1671 ˚A absorption in images B1–B6 and measure a redshift zC iii]= 2.396 ± 0.001
from the integrated light of these images (Smit et al., in preparation).
We use these new constraints to update the lens model by S07. As in S07, the lens modelling is performed using the
LENSTOOL software (Kneib et al. 1996; Jullo et al. 2007;
Jullo & Kneib 2009).LENSTOOLis a parametric method for
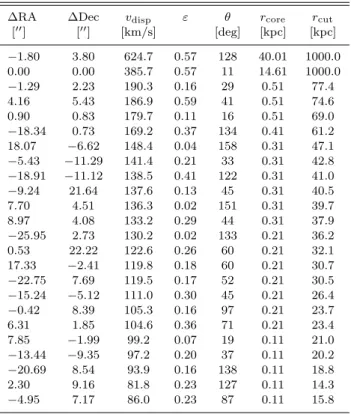
modelling galaxy clusters that uses a Markov Chain Monte Carlo (MCMC) fit for a specified number of mass peaks. Each mass peak corresponds to a dark matter halo mod-elled with a truncated pseudo-isothermal elliptical that is characterised by a position (RA, dec), velocity dispersion σV,
ellipticity ε, truncation radius rcutand core radius rcore.
For our updated mass model we include mass nents for the brightest 22 cluster members and two compo-nents for the cluster halo. We include constraints from the six images B1–B6 of the z = 2.396 galaxy arc, including the de-magnified image in the centre. Another faint arc is identified in the HST imaging (D1–D3 in Table A1), just inside the z = 4.88 arc, but we do not detect any emis-sion lines from this source in the MUSE data-cube. Further-more, we search the MUSE cube for bright multiply lensed line emitters and find a Lyα emitter without an HST con-tinuum counterpart at zLyα= 5.500 ± 0.002 (labelled C1 at
α = 02:24:34.86, δ = −00:02:16.2 and C2 at α = 02:24:34.02, δ = −00:02:36.3 in Figure1). The locations of the Lyα emit-ter images are well predicted by the lens-model that uses all other constraints and therefore we include this doubly lensed image as an additional constraint. In Figure1we show the critical curve of our new model at a redshift of z = 4.88 and we list all multiple images used to constrain the model in TableA1in AppendixA.
Our mass model differs from that of S07 in three ways. First, owing to the different assumed cosmology, our model is ∼ 35% less massive: M = (3.8 ± 0.2) × 1014M
com-pared to M = (5.9 ± 0.4) × 1014M
. We recover the S07
mass if we switch back to their cosmology. Second, the in-clusion of mass from all cluster member galaxies makes the z = 2.4 critical line better match the observed features of lensed system B. Third, our distribution of mass is more elongated toward the North-West. The S07 model had close to circular symmetry, forced by a prior on the ellipticity of the cluster-scale dark matter. This resulted in a scatter of rmsAi = 1.2100between the predicted and observed
posi-tions of images A1-A4 (G. Smith et al. private comm.). By
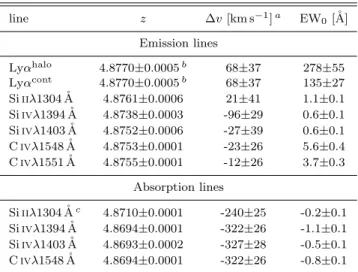
Table 1. Detected spectral features of the z = 4.88 arc (inte-grated over galaxy images 1, 2 and 3)
line z ∆v [km s−1]a EW 0[˚A] Emission lines Lyαhalo 4.8770±0.0005b 68±37 278±55 Lyαcont 4.8770±0.0005b 68±37 135±27 Si iiλ1304 ˚A 4.8761±0.0006 21±41 1.1±0.1 Si ivλ1394 ˚A 4.8738±0.0003 -96±29 0.6±0.1 Si ivλ1403 ˚A 4.8752±0.0006 -27±39 0.6±0.1 C ivλ1548 ˚A 4.8753±0.0001 -23±26 5.6±0.4 C ivλ1551 ˚A 4.8755±0.0001 -12±26 3.7±0.3 Absorption lines Si iiλ1304 ˚Ac 4.8710±0.0001 -240±25 -0.2±0.1 Si ivλ1394 ˚A 4.8694±0.0001 -322±26 -1.1±0.1 Si ivλ1403 ˚A 4.8693±0.0002 -327±28 -0.5±0.1 C ivλ1548 ˚A 4.8694±0.0001 -322±26 -0.8±0.1
aVelocity offset with respect to the the systemic redshift
z[O ii]= 4.8757 ± 0.0005. Uncertainties combine the uncertainty
on the line redshift with the uncertainty on the [O ii] redshift.b
Using the peak of the Lyα line.cBlended with the O iλ1302 ˚A
line.
dropping the prior (and simultaneously imposing constraints from newly identified lens systems), a cluster-scale mass dis-tribution with ellipticity ε = 0.63 achieves rmsAi = 0.52
00
, or rmsi = 1.0300 for all image systems. However, we achieve
a still-better fit (rmsAi = 0.4800, rmsi = 0.8800) using two
cluster-scale halos. These were given a Gaussian prior cen-tred on the two BCGs. The first gets asymmetrically offset to the North-West; the second remains near CG2. This two-halo model achieves a superior log(Likelihood) of –26.57 and χ2 = 61.3 in 11 degrees of freedom compared to the best-fitting one-halo model, which has log(Likelihood) of –142.92 and χ2= 294 in 17 degrees of freedom. The best-fit param-eters are listed in TableA2in AppendixA.
3.2 The z = 4.88 arc
The z = 4.88 arc was first discovered in the Red-Sequence Cluster (RCS) by Gladders et al. (2002). Gladders et al.
(2002) detected the bright Lyα emission in galaxy images 1–3 at zLyα= 4.8786 with VLT/FORS-2 spectroscopy. S07
targeted the arc with VLT/VIMOS (galaxy images 1–4) and VLT/SINFONI (galaxy images 2–3) spectroscopy and de-tected Lyα at zLyα = 4.8760 and [O ii]λλ3726.1,3728.8 ˚A
at z[O ii] = 4.8757. S07 measured a star-formation rate of
12 ± 2 M yr−1, a velocity gradient of . 60 km s−1, and an
estimated dynamical mass of ∼ 1010M within 2 kpc from
the [O ii] emission lines.
For our MUSE study of the z = 4.88 arc we will as-sume the systemic velocity of the galaxy is best estimated by zsys = z[O ii] = 4.8757 ± 0.0005 (integrated over galaxy
images 2–3). Furthermore, from our lens-model we find lu-minosity weighted amplifications of µ = 29+9
−11, µ = 21+12−8 ,
µ = 138+7−74 and µ = 1.30 +0.01
−0.01 for images 1, 2, 3 and 4
re-spectively (note that image 3 has a very high amplification, but also a very large uncertainty, because the arc crosses the critical curve). These values are slightly higher than the
mean, luminosity-weighted magnification of µ = 16±2 found by S07 for images 1,2 and 3 integrated (though within the uncertainties for images 1 and 2). The uncertainty on our numbers is largely due to the fact that a small shift of the critical curve can change the luminosity weighted amplifica-tion significantly. In particular, we note that the high magni-fication of image 3 is dominated by a few pixels that overlap with the critical curve, while the estimated magnification for any modelling method is most uncertain near the criti-cal curves (seeMeneghetti et al. 2016).
To measure the detailed properties of the UV spectrum of this galaxy we first construct a one-dimensional spec-trum (up to ∼ 1600 ˚A in the rest-frame) of the z = 4.88 arc from the MUSE cube by measuring the integrated (non-weighted) spectrum extracted from pixels in the lensed im-ages 1, 2 and 3 with a S/N>2σ in the continuum image of the MUSE data-cube. The resulting spectrum is shown in Fig-ure2. As well as bright Lyα emission, which has an observed equivalent width (EW) of 793 ± 159 ˚A (rest-frame EW0 =
135 ± 27 ˚A), we clearly detect the absorption line dou-blet Si ivλλ1394,1403 ˚A, which originates in the ISM and/or CGM and the emission line doublet C ivλλ1548,1551 ˚A, with some evidence for an absorption component as well (see inset panels), which is likely to arise from a combination of stel-lar, nebular and ISM/CGM components. The observational parameters of the UV spectroscopic features in the MUSE data are listed in Table1(see AppendixBfor measurements on the individual lensed galaxy images).
In the next sections we will first discuss the morphology of the emission lines, before moving to a detailed analysis of the spectral properties of the z = 4.88 arc, the kinematics of the system and the physical picture that emerges from these observations.
3.2.1 Lyα morphology
The Lyα emission in the z = 4.88 arc (see Figure 1) ap-pears to be significantly extended. Lyman Break galaxies and Lyα emitters at z ∼ 2 − 6 often exhibit extended Lyα halos around the stellar continuum of the galaxies, following an exponential surface brightness distribution (Steidel et al.
2011; Matsuda et al. 2012; Momose et al. 2014; Wisotzki
et al. 2016). These Lyα halos are thought to be generated
either by cooling radiation (e.g., Dijkstra et al. 2006;
Dijk-stra & Loeb 2009;Faucher-Gigu`ere et al. 2010;Rosdahl &
Blaizot 2012) or by resonant scattering from a central
power-ing source, such as star-formation or AGN (e.g.,Verhamme
et al. 2006;Gronke et al. 2015). First, we investigate the
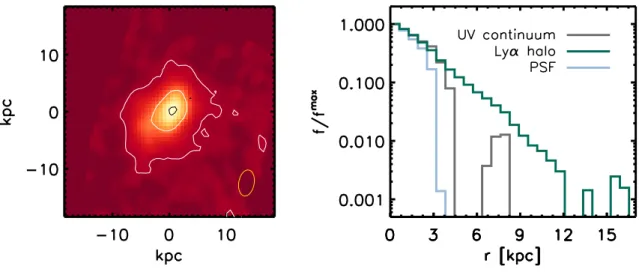
mor-phology of Lyα in the z = 4.88 arc behind RCS 0224−0002. Figure 3 shows the source-plane reconstruction of the continuum subtracted Lyα halo. We use image 4, since the Lyα halos of images 1 to 3 are incomplete and merged to-gether (see the right panel of Figure1). For the spatial pro-file we use bins of 0.1 arcsec in concentric circles around the peak flux of the Lyα emission. The MUSE Lyα halo has an observed FWHM of 2.2 kpc, while the HST con-tinuum has a FWHM of 0.2 kpc. A number of foreground cluster galaxies contaminate the measurement of the stellar spatial profile directly from the continuum image. Therefore we construct a broadband image redwards of Lyα, centered on 7400˚A, and we subtract a continuum image bluewards of the Lyα break centered on 6975˚A in order to remove most of
the foreground contamination. We mask any remaining flux from foreground sources by hand. Furthermore, we extract the PSF from a nearby star and place this at the position of the Lyα peak in our lens model in order to construct the source-plane image of the PSF and measure its spatial profile.
The Lyα halo appears roughly isotropic, with little sub-structure, except for an extended lower luminosity region in the South-East. Comparing the Lyα halo with the UV con-tinuum image in Figure3indicates the extended nature of the faint Lyα profile beyond the continuum. The Lyα halo is consistent with an exponential profile. For comparison with Lyα halos in the literature, we measure the Petrosian ra-dius (Petrosian 1976) of the halo, defined as the annulus where the Lyα flux is equal to η times the mean flux within the annulus. The Petrosian radius is a useful measure, since it is only weakly dependent on the seeing of the observa-tions. For η = 20% we find Rp20,Lyα = 8.1 ± 0.4 kpc and
Rp20,UV = 2.9 ± 0.8 kpc, which is somewhat lower than
the range of Petrosian radii Rp20,Lyα ∼ 10 − 30 kpc (for
Rp20,UV ∼ 1.3 − 3.5 kpc) found by Wisotzki et al.(2016),
but similar to some of the largest Lyα halos around z ∼ 0 analogues in the LARS sample (Hayes et al. 2013), which typically show radii Rp20,Lyα. 8 kpc (Figure4).
Faucher-Gigu`ere et al. (2010) and Rosdahl & Blaizot
(2012) use radiative transfer simulations to investigate the expected morphology of Lyα halos generated by cooling ra-diation and they predict concentrated emission, which can extend out to 10 − 30 kpc. While stacked Lyα halos extend out to ∼ 100 kpc (Steidel et al. 2011;Matsuda et al. 2012;
Momose et al. 2014), indicating cooling is not the origin of
Lyα emission in typical galaxies, our observations do not have sufficient S/N to trace the z = 4.88 Lyα halo be-yond 10 kpc, necessary to rule out a gas cooling scenario. We will therefore further investigate whether the faint, ex-tended Lyα emission is produced by resonant scattering from a central source or by cooling radiation in §3.2.2based on the spectral properties of the line.
3.2.2 Spectral properties of the Lyα line
High-redshift Lyα emitters can exhibit a wide range of spec-tral properties, such as blueshifted and redshifted emission, single and double peaked lines and different line widths and velocity offsets, which gives insight into the emission mech-anism of Lyα and the column density and velocity distribu-tion of the ISM and CGM neutral gas (e.g.Verhamme et al.
2006;Gronke et al. 2015).
For the z = 4.88 arc, the Lyα emission line profile is very asymmetric and we find a single redshifted Lyα line, with a peak at zLyα = 4.8770 ± 0.0005 (using the
wave-length and width of the spectral element where Lyα peaks), ∼ 40 − 90 km s−1
redshifted with respect to the [O ii] emis-sion which marks the systemic redshift, and FWHMred =
285 km s−1, with very little flux bluewards of the [O ii] red-shift (see Figures 2and 5). We set an upper limit on the presence of a weaker blue line; at −vred we find an upper
limit on the flux ratio of any blue peak to the red peak Fpeak,blue/Fpeak,red< 0.027. Furthermore, we detect a faint
tail of redshifted Lyα emission out to ∼ 1000 km s−1. A sim-plified model for this asymmetric line shape is that of a Gaussian emission line profile convolved with a Voigt profile,
Figure 3. Left: The source-plane reconstruction of the Lyα halo of the lensed galaxy image 4. White contours indicate 50% and 10% of the peak flux in the Lyα halo, while the yellow ellipse in the corner indicates the 50% peak flux for the de-lensed PSF of the MUSE continuum image. The black contour indicates 50% of the peak flux of the UV continuum observed in the HST I814 band. The Lyα
flux is dominated by a smooth and largely circularly symmetric halo that is extended beyond the stellar continuum, but we also identify an extended region to the South-East (North-West in the image plane). Right: The exponential surface-brightness profile of the Lyα halo, compared to the MUSE continuum (using a fore-ground subtracted broad-band image at 7400˚A) surface-brightness profile and the MUSE PSF measured from the source-plane reconstruction of galaxy image 4. The Lyα halo is extended beyond the stellar component measured from the UV continuum.
Figure 4. A comparison of the Lyα and UV continuum Petrosian scale radii for the z = 4.88 arc and including measurements at z = 0 − 6 from the Lyα reference sample (LARS;Hayes et al. 2013) and MUSE HDF-S observations (Wisotzki et al. 2016).
describing the collisional and Doppler broadening of inter-stellar absorption lines, as shown in Figure2, where we fix the redshift of the underlying Gaussian emission to the [O ii] redshift z = 4.8757. The best-fit model in Figure2indicates a H i absorber with a column density of 1019cm−2, how-ever, the fit fails to reproduce both the narrow peak and the high-velocity tail of the Lyα line. In fact, the emission-line component of the Lyα line shows a strongly non-gaussian
shape; instead we observe an exponential profile as a func-tion of velocity over two orders of magnitude in flux (Figure
5), remarkably similar to the exponential surface brightness profile (Figure3).
S07 observed the modest redshifted narrow Lyα line in combination with the high velocity tail, and interpreted this as a combination of emission from the central source combined with redshifted emission from an outflow. To test this model, in Figure5we show the spatial variation of the spectral Lyα profile in the image-plane of the lensed galaxy image 1 (the highest S/N image). While we used the source-plane reconstruction of galaxy image 4 for deriving the spa-tial properties of the Lyα halo, we use the brightest galaxy image for spectral analysis to obtain higher signal-to-noise information. First, we partition the halo along contours of constant observed Lyα flux. While the Lyα flux in the halo drops by more than an order of magnitude compared to the emission over the stellar continuum, the shape of the Lyα profile, after normalising to the peak flux, changes only marginally from the Lyα profile extracted over the stellar continuum. Across the lensed image, the wavelength of the peak of the Lyα line changes by less than ∼ 50 km s−1, while the width and the shape of the high velocity tail stays nearly constant (see alsoPatr´ıcio et al. 2016, for a similar pattern in a Lyα halo at z = 3.51).
These results differ strongly from the scenario described in S07, where the main peak of the Lyα profile comes directly from the star-forming regions and the high velocity wing is re-scattered in an expanding shell of gas within the CGM. For this model to hold we would expect the star-formation component (the peak of Lyα) to drop off rapidly with in-creasing radius, while the back-scattered CGM component changes little with radius, and therefore the peak flux would shift to higher velocities and the shape would change
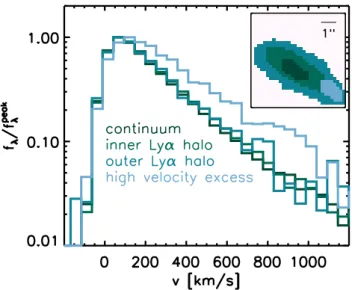
signif-Figure 5. The spatial dependence of the Lyα velocity profile (with respect to the [O ii] redshift) in different bins in the image plane of galaxy image 1. The black line indicates the flux within a contour over the stellar continuum flux and the green lines are emitted within contours of constant Lyα flux. The light blue line indicates a region of high-velocity excess flux. The pixels used to generate the four spectra are shown in the inset panel. The spatial variation of the Lyα halo is surprisingly small, with the peak of the Lyα line varying less than the width of one spectral element corresponding to ∼ 60 km s−1. The small difference in the velocity profile between the inner and outer halo, would suggest that the bulk of the Lyα photons are CGM generated/rescattered, since there is no evidence for an ISM component that falls away as we observe Lyα further away from the stellar continuum. Spatially offset from the spherical halo, we detect excess flux out to 1000 km s−1 (corresponding to the extended region to the South-East in the source-plane image shown in Figure 3), possibly indicating a collimated high velocity outflow superimposed on an isotropic component that dominates the total Lyα emission (see §3.2.1).
icantly. The spatially-uniform Lyα spectral profile instead suggests that the Lyα peak is also produced or resonantly scattered within the CGM, which generates Lyα emission with a wide range in velocities.
We can test this further by searching for any deviations from the average Lyα profile. We use the spectrum extracted over the stellar continuum as a model for fitting the Lyα line in each individual pixel of the z = 4.88 arc, leaving the nor-malisation as the only free parameter and considering only the peak of the Lyα line as a model constraint. After sub-tracting our one-parameter model we detect only a weak residual. In Figure5 we show the spectrum extracted over the region with the largest residual, which shows a slightly offset peak compared to the Lyα extracted over the stel-lar continuum and a broadened profile out to 1000 km s−1, indicating a collimated high-velocity outflow on top of the isotropic Lyα halo component that is described above.
Given the extended nature of the Lyα emission (§3.2.1) we now consider various generation mechanisms for the emis-sion. Given the spatially invariant Lyα line profile, which indicates that only a minor fraction of the Lyα emission reaches us directly from the galaxy, it is reasonable to con-sider whether the halo can be produced by cooling radiation from the CGM. Dijkstra et al.(2006) andFaucher-Gigu`ere
Figure 6. Comparison of the emission line ratio C iv/Lyα as a function of rest-frame Lyα equivalent width with similar de-tections in the literature. We show the measurements along the lensed image 1 of the z = 4.88 arc. We also show data from lensed C iv emitters at z ∼ 2 found byChristensen et al.(2012b),
Stark et al.(2014),Stark et al.(2015),Caminha et al.(2016) and
Vanzella et al.(2016). Narrow-line AGN have been observed to show a emission line ratio of C iv/Lyα & 0.2 (Shapley et al. 2003;
Erb et al. 2010;Hainline et al. 2011). Along the z = 4.88 arc this emission line ratio is steady and always below C iv/Lyα < 0.1 (see §3.2.3).
et al.(2010) model such scenarios using radiative transfer
simulations and find that Lyα should typically be double peaked and blueshifted with respect to the systemic velocity of the galaxy. Assuming these models provide a reasonable description of the system, the single redshifted Lyα peak we observe excludes cooling as a source of Lyα photons in the z = 4.88 arc.
To reproduce the Lyα line profile for the z = 4.88 arc we thus favour a picture where a central powering source is surrounded by a largely isotropic halo of neutral gas, which dampens Lyα bluewards of the systemic velocity and reso-nantly scatters the vast majority of photons towards higher velocities within the expanding gas behind the galaxy (e.g.
Dijkstra et al. 2006;Verhamme et al. 2006).
The strong similarity between the Lyα surface bright-ness profile (Fig.3) and the spectral profile in the z = 4.88 arc could suggest the presence of a smoothly varying velocity gradient in the CGM gas that resonantly scatters the Lyα photons into our line of sight. This scenario is qualitatively in good agreement with the Lyα profile considered in
Ver-hamme et al.(2006, see their Fig. 7), shown in Appendix
C, where the relatively low column density (at a given ve-locity) created by the strong velocity gradient causes the escape of Lyα photons predominantly at low velocity (and small radii), while a weak high-velocity tail is still observed due to the photons that are resonantly scattered through the accelerating outflow. A model with a gas velocity gradi-ent furthermore predicts the absence of a blue peak, which is difficult to reproduce in a shell model, since a low ve-locity shell with low covering fraction which gives rise to a red Lyα peak close to the systemic velocity also produces a nearly symmetric blue peak. In §3.3we will discuss how this
Figure 7. The spatial distribution of the C iv emission lines along the lensed galaxy images 1, 2 and 3 of the z = 4.88 arc (green contours, left panel), compared to the [O ii] distribution over the lensed images 2 and 3 from the SINFONI data (S07, brown contours, right panel). The HST (V666+ I814)-band image is shown in greyscale. The high-ionisation emission lines are spatially extended along
the arc and trace the UV-continuum light. The morphologies of C iv and [O ii] show similarities that might imply a nebular origin of C iv in a large number of the star-forming regions of the z = 4.88 arc.
Figure 8. Left: Predicted C iv equivalent width evolution of nebular C iv emission during the first 100 Myr of a single stellar population at Z = 0.05, 0.2, 0.4 Z metallicity (solid, dot-dashed and dashed lines respectively) using the BPASS stellar population synthesis models
including binary rotation (Eldridge & Stanway 2012). The green region indicates the rest-frame equivalent width observed (including uncertainty) in the integrated spectrum of the z = 4.88 arc. The nebular C iv emission could be produced by a very low-metallicity stellar population if the star clusters are observed during the first ∼ 3 Myr of their lifetime. Right: A comparison of the stellar C iv profiles (excluding nebular emission) predicted by the same three BPASS models at 3 Myr with our data. The binned points on either side of the nebular C iv lines show no evidence for the strong P-Cygni profiles produced by stellar winds, indicating a metallicity of the stellar population lower than the Z = 0.05 Z BPASS model.
model fits into a physical picture that can explain our full set of observations.
3.2.3 CIVemission
The detection of narrow (FWHM = 156 ± 16 km s−1) C ivλλ1548,1551 ˚A emission in the z = 4.88 arc is interesting since the UV spectra of field galaxies generally show C iv in absorption from ISM/CGM gas, or else exhibit a P-Cygni profile from the stellar winds of O-stars, with C iv emission redshifted by a few hundred km s−1 (Leitherer et al. 2001;
Shapley et al. 2003;Jones et al. 2012). AGN can also produce
C iv in emission, though with typical line-widths of at least a few hundred km s−1. Narrow C ivλλ1548,1551 ˚A has so far been observed in a handful of strongly lensed high-redshift galaxies (e.g.Holden et al. 2001;Christensen et al. 2012b;
Stark et al. 2014,2015;Caminha et al. 2016;Vanzella et al.
2016). To date these galaxies have either been studied with slit spectroscopy or they are unresolved in ground-based ob-servations, inhibiting the study of the spatial distribution of the C ivλλ1548,1551 ˚A. The MUSE observations of the brightly lensed z = 4.88 arc therefore provides us with a unique opportunity to investigate the origin of this line in more detail.
In the absence of rest-frame optical spectroscopy, a common approach to assessing the possible presence of AGN is using UV emission line ratios (e.g., Stark et al.
2015; Feltre et al. 2016). At z = 4.88, this requires
near-infrared spectroscopy to measure the He iiλ1640 ˚A and C iii]λλ1907,1909 ˚A lines. With the current observations we can only assess the C iv/Lyα ratio, which has a ratio of & 0.2 in the composite spectra of AGN (Shapley et al. 2003;
Hainline et al. 2011). In contrast, this ratio is C iv/Lyα =
0.054 ± 0.006 in the z = 4.88 arc, with little variation along the images, consistent with the interpretation that this line is associated with star formation and not with a hidden AGN. Figure 6 shows the C iv/Lyα ratio as a function of Lyα equivalent width for various lensed galaxies in the lit-erature (Christensen et al. 2012b; Stark et al. 2014,2015;
Caminha et al. 2016;Vanzella et al. 2016) and in 5 spatial
bins along the lensed image 1 of the z = 4.88 arc (using both the 1548 and 1551 ˚A lines). The C iv/Lyα ratio and the observed equivalent width of C iv 55 ± 2 ˚A (rest-frame EW0= 9.3 ± 0.4 ˚A) do not change significantly as a function
of position along galaxy image 1. Furthermore, we observe no strong emission from typical AGN lines such as N vλ1240 ˚A, S ivλλ1393,1402 ˚A and N ivλλ1483,1486 ˚A (e.g.,Hainline et
al. 2011).
In Figure 7 we show the spatial distribution of C ivλλ1548,1551 ˚A, using a continuum subtracted narrow-band image of the C iv emission and overlaying the con-tours on the HST continuum image. C iv clearly extends along the arc and shows a morphology that is consistent with the [O ii] emission. While we would expect a centrally concentrated source for C iv if it was originating from an AGN, we can distinguish at least four different ‘clumps’ in the C iv morphology with similar brightness, suggesting that the C iv emission is nebular in origin and emerging from multiple star-forming regions throughout the galaxy.
Finally, we measure the UV-continuum slope β (fλ ∝
λβ) from the J125 − H160 color of galaxy image 1
(inte-grated flux) and find β =-2.19 ± 0.14, while the
individ-ual star-forming clumps along the arc show slopes between β=-1.68−-2.64. Since high-redshift galaxies that host faint AGN have measured UV continuum slopes of β ∼-1.4−-0.3
(Hainline et al. 2011;Giallongo et al. 2015) and we therefore
conclude that low-mass accreting black holes are unlikely to contribute to the radiation field giving rise to the C iv emis-sion.
3.2.4 Metal absorption lines
The high-ionisation C ivλλ1548,1551 ˚A line is expected to be a combination of nebular, stellar and ISM/CGM compo-nents. While no absorption by the ISM appears present at the systemic velocity of C iv, blueshifted C iv absorption is observed at ∆v = −322 ± 26 km s−1which also has a narrow profile, with FWHM ∼ 200 km s−1.
The spectrum displays a strong similarity between the C ivλ1548 ˚A and Si ivλ1394 ˚A absorption profiles (Figure
2), indicating the absorption of both lines is due to highly ionised gas clouds in the ISM/CGM of the galaxy moving to-wards us. Furthermore, both Si ivλ1394 ˚A and Si iiλ1304 ˚A show no evidence for absorption at the systemic velocity (Figure 2) and we even find weak emission lines, possibly indicating a low covering fraction of gas in the ISM of the galaxy. Given the strong absoprtion of the high-ionisation lines at ∼ −300 km s−1, galactic feedback in this galaxy has possibly ejected a large fraction of the interstellar gas into the CGM/IGM.
The Si iiλ1304 ˚A absorption appears to be weaker than the C ivλ1548 ˚A and Si ivλ1394 ˚A absorption lines. The ra-tio of the equivalent with of the Si iiλ1304 ˚A line over that of Si ivλ1394 ˚A is EW(Si iiλ1304 ˚A)/EW(Si ivλ1394 ˚A)=0.2 (see Table1). This is in contrast to the typical UV spectra of high-redshift galaxies, where the low-ionisation lines are stronger than the high-ionisation lines of the same species, with for example EW(Si iiλ1304 ˚A)/EW(Si ivλ1394 ˚A)=1.2 in the composite spectrum of Lyman break galaxies by
Shap-ley et al. (2003). We also fit the low- and high-ionisation
lines with a Gaussian profile convolved with a Voigt-profile absorber and estimate column densities of log N/cm−2 = 14.5±0.3 and log N/cm−2= 14.6±0.1 respectively. Possibly a larger fraction of the outflowing gas is highly ionised due to a hard ionisation field, which is present given the widespread nebular C ivλλ1548,1551 ˚A emission in the galaxy. It is pos-sible that the neutral gas swept up by the ionised outflow is optically thin because of this, or else that the covering fraction of neutral gas in the CGM is incomplete (e.g.,Erb 2015). To distinguish between these explanations we would need a clean observation of the Si iiλ1260 ˚A and Si iiλ1527 ˚A absorption features, which are currently obscured by sky-lines.
3.2.5 Stellar population
Given that the C iv emission appears to be nebular in origin and powered by star formation (see §3.2.3), we investigate the properties of the stellar population that are needed to reproduce the ∼ 9 ˚A rest-frame equivalent width nebular C iv emission.
Figure8shows the evolution of the nebular C iv equiva-lent width with metallicity, obtained from the Binary Popu-lation and Spectral Synthesis (BPASS;Eldridge & Stanway
Figure 9. The spatial variation of the various line components along a tangential line through lensed image 1 of the z = 4.88 arc (from North-East to South-West in the image plane, corre-sponding to a line from North to South in the source plane) with respect to the [O ii] redshift of z = 4.8757 measured from galaxy images 2 and 3. The C iv emission is close to the [O ii] redshift, while the Si iv interstellar absorption lines are blue-shifted by ∼ 300 − 400 km s−1(the solid purple point corresponds to a
mea-surement combining galaxy images 1, 2 and 3 to obtain a > 5σ line detection). The peak of the Lyα halo is redshifted by ∼ 80 km s−1, with very little velocity structure along the arc. The width the Lyα line increases on one side of the galaxy as indicated by the positions of the half, 25%, and 10% of the max flux in the line. We find no evidence of a strong velocity gradient in the nebular lines, and the peak of the Lyα emission stays nearly constant even beyond the galaxy. There is, however, a widening of the Lyα pro-file and a weak velocity gradient in the Si iv absorption, possibly indicating a collimated high-velocity outflow.
2012) models, using a single stellar population and including binary stellar evolution. The highly ionising photons needed to generate the high-equivalent width nebular C iv lines can be generated by a young stellar population (1 − 3 Myr old) with a low metallicity Z = 0.05Z .
The low-metallicity BPASS models also predict signifi-cantly reduced equivalent width stellar P-Cygni profiles, due to the fact that the winds of hot stars are driven by metal line absorption and therefore low-metallicity stars are much less efficient in driving stellar winds. This is consistent with the observed profile of C iv in the z = 4.88 arc (see Fig-ure 8), where we see no evidence for any redshifted stel-lar emission (>500 km s−1) or broad blueshifted absorption (<−500 km s−1) from the systemic velocity. In fact, a lower equivalent width stellar P-Cygni profile could provide an im-proved fit to our data, suggesting that the stellar iron
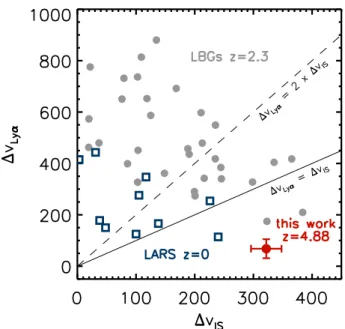
abun-Figure 10. A comparison of the velocity offsets from the systemic redshift for the Lyα peak and the interstellar absorption line Si iv for the z = 4.88 arc and including similar measurements at z = 0 − 2 from the Lyα reference sample (LARSRivera-Thorsen et al. 2015) and UV-selected star-forming galaxies observed with the LRIS spectrograph on Keck (Erb et al. 2006). A “shell”-like outflow is expected to have the Lyα peak be shifted by ∼ 2 × ∆vIS(dashed line), while the z = 4.88 arc is among the very few
galaxies with a Lyα peak shift below ∆vLyα= ∆vIS(solid line).
dance of the stellar population of the z = 4.88 arc could be even lower than that assumed in the lowest-metallicity BPASS models available. The reasonable consistency be-tween the stellar and nebular components in the C iv line profile provides confidence that we are indeed witnessing the early star formation in a galaxy with a very metal-poor stellar population.
3.2.6 Kinematics
To derive spatially resolved dynamics of the stars and gas, we exploit the enhanced spatial resolution of the strongly lensed z = 4.88 arc and the IFU data to understand the spatial variation in the kinematics of the ISM/CGM.
In Figure 9 we show the spatial variation of Lyα, C ivλλ1548,1551 ˚A and Si ivλλ1394,1403 ˚A along the lensed galaxy image 1 running from the North-East to South-West. We use galaxy image 1, since galaxy images 2 and 3 are in-complete images that cross the critical curve (see Figure1) and the stellar continuum of galaxy image 4 is not spatially resolved in the MUSE data. The velocities in Figure 9are given with respect to a redshift of z[O ii] = 4.8757 obtained
from galaxy images 2 and 3 (S07).
As noted in §3.2.2, the Lyα profile is not well described by a traditional Gaussian profile convolved with a Voigt-profile absorber and we therefore choose a non-parametric description of the Lyα profile. We characterise the spatial variation in the shape of the asymmetric Lyα profile by find-ing the wavelength that corresponds to 50%, 25% and 10% of the peak flux redwards of the Lyα peak.
The C ivλλ1548,1551 ˚A emission lines are modelled using a Gaussian emission line doublet. We model the Si ivλλ1394,1403 ˚A absorption line doublet using Gaussians convolved with a Voigt-profile absorber. We detect these lines with > 5σ significance against the brightest continuum clump in galaxy image 1, corresponding to the North of the galaxy in the source plane. To obtain better constraints on the Si iv kinematics over the whole galaxy, we combine the bright clumps in galaxy images 1, 2 and 3 that correspond to the Southern bright star-forming region in the source-plane (we also show this in Fig.1).
The C iv emission shows a velocity gradient of less than 50 km s−1 along the arc, with an irregular velocity pattern that is repeated in the lensed images 2 and 3. This is broadly consistent with the systemic velocity derived by S07, who find a velocity gradient in [O ii] of . 60 km s−1. Moreover, the width of the C iv doublet does not change significantly as a function of position but stays either unresolved or marginally resolved at a FWHM ∼ 100 km s−1.
For the high-ionisation Si iv line, we derive a blueshift of 300 − 400 km s−1 from the systemic redshift, consistent with the measured velocity offset by S07. The Lyα emission shows very little variation in the peak velocity, but broadens along the South-West side of the extended Lyα halo. This is consistent with the analysis in §3.2.1, which suggests a collimated high-velocity outflow on top of a halo of isotrop-ically out-flowing neutral gas. The small (< 60 km s−1) ve-locity gradient in the C iv and [O ii] lines as well as the ∼ 100 km s−1
velocity gradient in the Si iv absorption also support this picture of an outflow over the interpretation of large scale rotation in the halo.
Comparing the high-ionisation absorption features and the Lyα line, the Lyα peak produced by the receding out-flow emits at significantly lower velocities (< 100 km s−1) than where the absorption of interstellar Si iv takes place in the approaching outflow (300 − 400 km s−1). This is in con-tradiction to a simple symmetric shell model (Verhamme et
al. 2006;Gronke et al. 2015), which predicts that the Lyα
peak be shifted by ∼ 2 × ∆vexp, where ∆vexp is the
out-flow velocity of the shell as measured from the interstellar absorption features. In this model the Lyα peak velocity of the z = 4.88 arc would be expected at ∼ 600 − 800 km s−1, a full order of magnitude higher than our observations (see Figure10). For comparison, theShapley et al.(2003) com-posite spectrum of Lyman Break Galaxies at z ∼ 3 shows a Lyα velocity offset of +360 km s−1 and low-ionisation lines at −150 km s−1, consistent with the symmetric shell model. While some asymmetry could be present in the outflow, as indicated by the changing Lyα linewidth on one side of the galaxy, the peak velocity of Lyα changes by less than 50 km s−1 and it therefore seems unlikely that asymmetry in the outflowing gas explains the difference of hundreds of km s−1 between the approaching and receding gas tracers. We therefore suggest that a complex kinematic structure of the CGM, such as the velocity gradient we argued for in
§3.2.2must affect the absorption and escape of Lyα photons.
3.3 A physical picture for the z=4.88 arc
In §3.2 we analysed the morphological and spectral prop-erties of the Lyα, C iv, Si iv and Si ii emission and ab-sorption lines in the z = 4.88 lensed galaxy arc behind
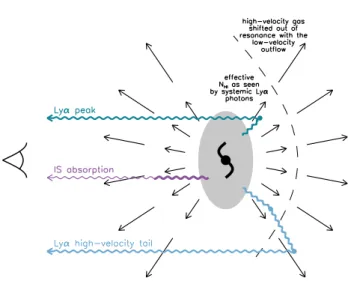
Figure 11. Schematic picture of the outflows, and Lyα and in-terstellar absorption features in the z = 4.88 arc. A strong ve-locity gradient in the outflow can produce the exponential Lyα line profile, due to the effective low column-density seen by pho-tons emerging from the galaxy, while phopho-tons that get scattered into the higher velocity regions emerge as the lower luminosity high-velocity tail.
RCS 0224−0002. Widespread nebular emission of the highly ionised C iv line implies that the source is an actively star-forming galaxy with a hard ionisation field impacting upon the ISM surrounding the sites of star-formation, while the blueshifted Si iv absorption line and spatially extended red-shifted Lyα halo indicate galaxy-wide outflows.
A notable difficulty in this picture is the difference be-tween the gas outflow velocities indicated by Lyα emis-sion and by low-ionisation absorption, suggesting the two tracers are dominated by different parts of a CGM which hosts a complex kinematic gas structure (§3.2.6). To find a model that qualitatively describes the Lyα spectral proper-ties we argued for a strong velocity gradient in the gas (§3.2.2
and AppendixC), implying an accelerating outflow. In this model the velocity gradient affects the column density seen by the Lyα photons at any given velocity and the neutral gas at low velocity (and small radii) becomes transparent and produces the low velocity Lyα peak, while a small fraction of the photons is scattered to the outer, high-velocity halo (see Figure 11). This model could also explain the strong blueshift of the interstellar absorption lines compared to the peak of the Lyα emission, since these lines are absorbed by both low and high velocity gas. While we expect a similar high-velocity tail in the interstellar absorption lines as is present in the Lyα emission line, we do not have the S/N to confirm this prediction. Finally, the spatial extend of the Lyα halo, which is strongly centrally peaked but shows a faint extended wing, is also well described by this model.
Accelerating outflows have already been inferred in lower redshift studies (e.g., Weiner et al. 2009; Martin &
Bouch´e 2009; Steidel et al. 2010). For example, Weiner et
al.(2009) observed a “saw-tooth” profile and a long, high-velocity tail in the Mg ii absorption features of 0.4 < z < 1.4 star-forming galaxies which can be explained by accelerated cool gas. Martin & Bouch´e (2009) suggest ultra-luminous
infrared galaxies (ULIRGs) at z ∼ 0.25 have lower covering fractions for their higher velocity gas, implying the high-est velocity gas is found at the larghigh-est radii and therefore the presence of a velocity gradient in the outflow. Further-more,Steidel et al.(2010) used UV-selected galaxy pairs at z ∼ 2 − 3 to measure the typical gas covering fraction of outflowing gas as a function of impact parameter and ar-gued that consistency between the absorption line strength as a function of impact parameter, and the strength and profile shape of lines observed in the spectra of the galaxies, required large velocities and velocity gradients in the gas.
A physical explanation for accelerating gas is that the outflows are momentum driven (e.g., Murray et al. 2005,
2011). Momentum injection is thought to be provided by radiation pressure produced on the dust grains. However, recent studies using deep ALMA observations (Coppin et
al. 2015;Aravena et al. 2016;Bouwens et al. 2016;Dunlop
et al. 2016) have shown that low-mass high-redshift
galax-ies have low dust content and the z = 4.88 arc does not appear heavily reddened (i.e. the continuum is bluer than that observed in the composite spectrum ofShapley et al. 2003, see Fig. 2), indicating only a small fraction of the star-formation radiation is available to drive winds.
Mur-ray et al.(2005) also consider momentum injection through
ram pressure by supernovae, which can deposit roughly the same amount of momentum as the radiation pressure on the dust and is therefore potentially a more likely source of momentum injection. Alternatively,Haehnelt(1995) con-siders momentum transfer due to the radiation of ionising photons, which could be a preferred source of momentum injection given the hard ionisation radiation field we know is present throughout the galaxy, because of the wide-spread high-equivalent-width C iv emission.
In summary, a physical picture consistent with our ob-servations is that of a vigorously star-forming galaxy, in-ducing a galaxy-wide momentum-driven wind, either due to supernova ram pressure or to the strong radiation field.
3.3.1 Comparison with UV properties of sources at z . 3 To date, only a small sample of high-redshift galaxies have been studied with high S/N rest-frame UV spectroscopy and all below z < 4, due to their faintness and hence the long integration times needed to detect faint spectral features. Therefore, we will compare the z = 4.88 arc with lower red-shift sources in order to understand if the features observed in this arc are common in z . 3 galaxies, or if there is evi-dence for a change in the ISM/CGM properties of galaxies as we start observing sources at higher redshifts.
The brightest targets for rest-frame UV studies at z ∼ 2 − 3 are identified from ground-based surveys, which se-lect strongly lensed galaxies, that are often relatively mas-sive (M∗ > 109.5M ) and strongly star forming (SFR &
50 M yr−1), including cB58 (z = 2.73;Pettini et al. 2000,
2002), the Cosmic Eye (z = 3.07;Smail et al. 2007;Quider
et al. 2010), the Cosmic Horseshoe (z = 2.38; Quider et
al. 2009) and SGAS J105039.6+001730 (z = 3.63; Bayliss
et al. 2014). Typical UV-spectroscopic signatures in these
massive galaxies include strong P-Cygni profiles seen in the C iv line profile, strong low-ionisation absorption features with respect to high-ionisation ISM lines of the same species and a wide velocity range for both low- and high-ionisation
absorption lines (FWHM ∼ 500 − 1000 km s−1). This is in strong contrast to the z = 4.88 arc, where we detect no ev-idence for stellar winds through the C iv P-Cygni line and also where the high-ionisation ISM absorption lines are only a few hundred km s−1 wide, indicating a marked difference in the properties of the stellar winds and the galaxy outflows of our source.
A few of these massive galaxies show strong C iii]λλ1907,1909 ˚A emission, an uncommon feature in lo-cal galaxies (e.g. Rigby et al. 2015) as it requires a signif-icant flux above 24 eV and therefore indicates that these high-redshift galaxies have harder ionisation fields and/or higher ionisation parameters compared to their local coun-terparts. However, the nebular C ivλλ1548,1551 ˚A doublet in the z = 4.88 arc (which is only seen when significant amount of flux above 48 eV is produced) is typically not detected.
With a dynamical mass of ∼ 1010M and SFR
of 12 M yr−1 (see S07) the z = 4.88 arc behind
RCS 0224−0002 might be more likely to share similar prop-erties to lower mass sources such as the Lynx arc (z = 3.36;
Holden et al. 2001;Fosbury et al. 2003), BX418 (z = 2.3;
Erb et al. 2010) and a sample of z = 1.4 − 2.9 galaxies
be-hind Abell 1689 and MACS 0451 targeted by Stark et al.
(2014). Indeed, the Lynx arc and three of the 17 galaxies in theStark et al.(2014) all show evidence for narrow C iv.
Erb et al.(2010) also require a significant contribution from
nebular C iv emission as well as stellar P-Cygni emisison to explain their observations.
Due to the faintness of most of these low-mass sources a detailed analysis of the absorption features is rarely possible.
Stark et al.(2014), however, notice an almost complete
ab-sence of P-Cygni and ISM absorption features in the galaxies where they do detect the continuum (similar to local galaxies selected on their low oxygen abundance presented byBerg
et al. 2016). Furthermore,Erb et al.(2010) are able to detect
numerous absorption features in BX418 at z = 2.3, due to an extremely deep integration, and find that the low-ionisation absorption lines in this galaxy are typically significantly weaker than the high-ionisation ISM lines, similar to the z = 4.88 arc. An obvious difference between BX814 and the z = 4.88 arc behind RCS 0224−0002 is the spectral shape of Lyα; BX814 has an extremely broad, FWHM ∼ 850 km s−1, Lyα line, as opposed to FWHM < 300 km s−1 observed in this galaxy. Furthermore, in BX814 the peak Lyα emerges at ∆v ∼ +300 km s−1, more than 3 times higher than for the z = 4.88 arc, while the interstellar absorption lines show a 1.5 − 2 times lower velocity offset (∆v ∼ −150 km s−1).
In summary, there appear significant differences in the nebular lines, stellar and ISM absorption features between the z = 4.88 arc behind RCS 0224−0002 and lower redshift sources with masses above M∗> 109.5M . Typically,
low-mass sources and/or low-metallicity galaxies at z < 3 can in some cases have very similar highly ionised nebular fea-tures and some similar feafea-tures in the absorption lines of low mass galaxies have been detected as well, however, no galaxy spectrum or composite spectrum of galaxies matches the full set of observations of the z = 4.88 arc, highlighting the need for larger samples of high S/N observations of very high-redshift galaxies in order to understand if the physical properties of the earliest systems are systematically different
from their later-time counterparts or if the z = 4.88 arc is a rare outlier in the z ∼ 5 galaxy population.
3.3.2 Implications for reionisation studies
Whether galaxies can reionise the Universe and what sources contribute most to reionisation, depends on a large number of parameters, including the Lyman-continuum photon pro-duction efficiency of galaxies, ξion, and the escape fraction
of ionising photons (Bouwens et al. 2015b;Robertson et al. 2015). While determining the physical properties of galaxies in the reionisation epoch remains challenging, recent spec-troscopy of z & 7 galaxies has shown evidence for strong rest-frame UV nebular emission lines such as C ivλλ1548,1551 ˚A
(Stark et al. 2015, 2017). Spitzer /IRAC imaging studies
have also inferred extremely strong [O iii]λλ4959,5007 ˚A in the rest-frame optical spectra of typical z ∼ 7 − 8 galaxies
(Labb´e et al. 2013;Smit et al. 2014,2015;Roberts-Borsani
et al. 2016). These results suggest that galaxies in the
reion-isation epoch could have similar hard radiation field and/or high ionisation parameter as the z = 4.88 arc and it is there-fore interesting to assess this galaxy as an analogue of the sources that might be responsible for reionisation.
Using the BPASS stellar population template of a young extremely low metallicity galaxy needed to match the C iv equivalent width (see §3.2.5) we derive a Lyman-continuum photon production efficiency in the z = 4.88 arc of log10ξion= 25.74 Hz erg−1, 0.63 dex higher than the
canon-ical value of log10ξion = 25.11 Hz erg−1 (Kennicutt 1998).
Systemic deviations of ∼ 0.1 dex from the canonical value of ξionhave been derived from the inferred Hα emission in
typi-cal z ∼ 4−5 UV-selected galaxies (Bouwens et al. 2016;Smit
et al. 2016;Rasappu et al. 2016). The bluest z ∼ 4 − 5
galax-ies (β<-2.3), likely very young and dust-free sources, have a significantly higher Lyman-continuum photon production efficiency of log10ξion = 25.53 − 25.78 Hz erg−1 (Bouwens
et al. 2016;Stark et al. 2015), in good agreement with our
derived value for the z = 4.88 arc, which also has a blue UV-continuum colour (β=-2.2). If similarly young and low-metallicity galaxies are common at z & 7, they could con-tribute significantly to reionisation even for modest (. 5%) escape fractions.
Measuring the direct escape of Lyman-continuum pho-tons at z ∼ 5 is challenging due to the intervening Lyα forest in the IGM. However, the Si iiλ1304 ˚A absoprtion in the z = 4.88 arc shows no sign of absorption at the systemic velocity by low-ionisation gas in the ISM, indicating Lyman-continuum photons might also easily escape. Furthermore, the collimated high-velocity outflow discussed in §3.2.2could blow holes into the ISM through which the photons prefer-entially escape (seeErb 2015).
Another important implication of the z = 4.88 arc as an z & 7 galaxy analogue, is the opportunity to identify sim-ilar sources with future facilities such as the James Webb Space Telescope (JWST) and the various Extremely Large Telescopes (ELTs). Most of the Lyα emission of galaxies in the reionisation epoch will be absorbed due to the sur-rounding neutral IGM, but strong nebular lines such as C ivλλ1548,1551 ˚A (seen at an observed EW of ∼ 80 ˚A at z ∼ 8) can be easily identified. While these lines are uncom-mon in the local Universe, our results indicate that these lines are widely produced by the young and low-metallicity
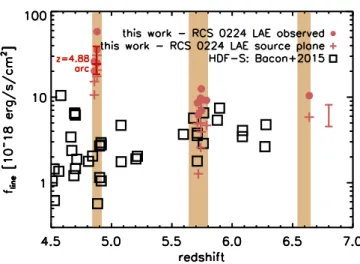
Figure 12. A comparison of observed and intrinsic flux of Lyα emitters in the HDF-S fromBacon et al.(2015) with our blind search in the RCS 0224−0002 MUSE field. The typical uncer-tainty on the intrinsic fluxes is indicated by the errorbars on the right. The shaded regions indicate our search windows, which have low sky contamination. Comparing our 3.75-hour integra-tion to the 27-hour MUSE integraintegra-tion byBacon et al.(2015) we are able to detect similarly faint sources in the source-plane, that is amplified by the cluster lensing.
stellar population within the z = 4.88 arc. These character-istics are likely to be more common as we start observing galaxies at earlier epochs.
4 A BLIND SEARCH FOR HIGH-REDSHIFT LYα EMITTERS
Finally, we can use the relatively wide field of view of MUSE to search for other emitters in the field. Deep MUSE ob-servations in the Hubble deep fields have proven efficient in detecting Lyα out to redshift z ∼ 6.6 (e.g.,Bacon et al. 2015). The extremely faint or undetected HST counterparts of these high-redshift Lyα emitters indicate we are sensitive to the faint end of the UV luminosity function; sources with similar properties to the galaxies expected to be responsi-ble for cosmic reionisation. While these observations require integration times of ∼ 30 hours, similar sources can poten-tially be found behind by strong lensing clusters within rea-sonable integrations times (e.g.,Karman et al. 2015;Bina et
al. 2016).
Due to its high mass, relative compactness and high red-shift RCS 0224−0002 appears to be an efficient lens for high-redshift galaxies. Unlike low-high-redshift strong-lensing clusters, our single MUSE pointing covers the entire z ∼ 6 criti-cal curves of RCS 0224−0002. We therefore explore the po-tential of RCS 0224−0002 as a window into the very high-redshift Universe. We search for emission line candidates in our MUSE dataset in three windows with low sky con-tamination, 7100-7200 ˚A, 8070-8270 ˚A and 9060-9300 ˚A, cor-responding to Lyα redshift ranges of z = 4.84 − 4.92, z = 5.64 − 5.80 and z = 6.54 − 6.65 respectively. To achieve this, we develop a blind line detection method that follows a number of consecutive steps to identify extremely faint sources, while minimizing spurious detections. First, for each
pixel in the MUSE field of view (masking bright continuum sources and removing cluster galaxies from the sample), we extract a one-dimensional spectrum by averaging 5 × 5 pix-els, where we use the PSF measured from the MUSE data to assign a weight to each of the pixels. For each of the one-dimensional spectra we search for individual spectral pixels that have a value > 3.5σ above the noise (estimated from the same one-dimensional spectrum, but masking the sky-lines) to identify potential lines. For each candidate, we fit a single Gaussian profile to the spectrum and we require a ∆χ2 ≥ 7.52
between the Gaussian and a straight line fit with a constant value.
To remove spurious detections we next generate a 12 × 12 arcsec continuum-subtracted narrowband image around the line. We create this image by extracting the images from the cube with a wavelength within the FWHM of the line (as measured from the Gaussian profile fit) and averaging them, we then subtract the median continuum in two bands (20 ˚A wide) at each side of the line (20 ˚A removed from the centre). On the continuum-subtracted narrowband image we measure 1000 randomly selected point-source fluxes, using the PSF extracted from a isolated star in the MUSE con-tinuum image to weight the pixels around each point. We require the line candidates to have a flux ≥ 3σ above the random sampled point-source flux distribution.
We visually inspect our line-candidates and remove all sources that are clearly [O ii], [O iii] or Hα emission and we remove low-redshift interlopers when bright continuum flux is detected blueward of the rest-frame 912 ˚A limit (based on the Lyα redshift). Note that while we do not exclude sources which show continuum flux between rest-frame 912 ˚A and 1216 ˚A, we detect flux below the rest-frame 1216 ˚A break in only one Lyα candidate (RCS0224 LAEz4p8773) from our final sample. Furthermore, we remove sources that appear due to noise artefacts at the edges of the CCDs, or sources that are strongly affected by an uneven background.
A significant uncertainty in our interloper rejection is that almost none of our Lyα candidates are detected in the HST /ACS+WFC3 imaging, and therefore no prior based on photometric redshift of the sources can be applied to our Lyα selection. Furthermore, many of our Lyα candidates are observed with too low S/N to identify the expected asym-metric Lyα spectral line shape and therefore our sample could be contaminated by for example high-equivalent-width [O iii]λ5007 ˚A lines of lower redshift galaxies, for which the [O iii]λ4959 ˚A line is too faint to be detected.
To make an estimate of the number of spurious detec-tions we expect in our blind search we perform a test for false-positives by running our source selection code on the inverted data-cube. To identify a “pure” sample, we calcu-late the S/N required in the algorithm to give a false positive rate of zero; which is ∆χ2 ≥ 7.52 for the line fit and ≥ 3σ
for the continuum-subtracted point source flux.
In our final sample of Lyα candidates we have five sources at z ∼ 4.8, eight sources at z ∼ 5.7 and one source at z ∼ 6.6. The sources are listed in TableD1 and thumb-nails of all the sources presented in Appendix D. For com-parison, in a 30h exposure over a 1 arcmin2 field over the
HDF-SBacon et al.(2015) find for the same redshift inter-vals seven Lyα emitters at z ∼ 4.8, six emitters at z ∼ 5.7 and no emitters at z ∼ 6.6, see Figure12. Using a 4h expo-sure and 1 arcmin2 field, Karman et al.(2015) find only 1
(multiply-lensed) source above z > 4.5 behind the Frontier Fields cluster Abell S1063.
A notable result from our blind search for Lyα line candidates is the presence of a large number of bright Lyα emitting sources at z ∼ 4.88. Three bright sources at 2.5 − 5.8 × 10⁻¹⁷erg s−1cm−2are located at ∼ +250 − 300 km s−1 or ∼ 200 kpc from the bright arc, while two more sources are located ∼ −1000 km s−1 or ∼ 1.7 Mpc from the arc. With the exception of one of these sources, none of the line-emitters are detected in the HST imaging (at > 5σ), how-ever they all exhibit a clear asymmetric line profile that provides evidence of these sources being Lyα emitters. Af-ter correcting for the lensing magnification these sources have Lyα line luminosities ∼ 1 − 3 × 10⁻¹⁷erg s−1cm−2 (L = 2.6 − 5.1 × 1042erg s−1), ∼ 2 − 10× brighter than sources found in the Hubble Deep Field South byBacon et al.(2015) at the same redshift. Comparing to the faint end of the Lyα luminosity functions obtained through narrow-band surveys at z = 3.5 − 5.7 (e.g.Ouchi et al. 2008; Santos et
al. 2016), we would predict 0.1 − 0.9 Lyα emitters as bright
as log L/erg s−1 = 42.5 in our MUSE data in the redshift window z = 4.84 − 4.92. This suggests that either the Lyα luminosity function is steeper at the faint-end than measured in narrow-band surveys (see alsoDrake et al. 2016), or else that the z = 4.88 arc is located in a ∼ 7 − 60× over-dense region, or group.
5 SUMMARY
We present a survey for line emitter galaxies behind the strong lensing cluster RCS 0224−0002. We analyse the rest-frame UV spectrum of a lensed galaxy magnified 29 times at z = 4.88. For this source we observe the following properties: • The z = 4.88 galaxy is surrounded by a spatially ex-tended Lyα halo with an exponential spatial profile. The spectral properties of the Lyα halo are spatially-uniform, showing a single redshifted peak close to the systemic ve-locity (∆v < 100 km s−1) and high-velocity tail (∆v > 1000 km s−1). The spatial and spectral properties of the halo are consistent with resonantly scattered Lyα photons pro-duced in a central source and backscattered in a receding outflow from the galaxy.
• We detect spatially resolved narrow C ivλλ1548,1551 ˚A emission. The spatial distribution of C iv strongly resem-bles that of the [O ii] line, suggesting a nebular origin of the line, powered by star-formation. We argue that the strong C iv emission (EW0∼ 9˚A) can be reproduced with a young
(t < 5 Myr), low-metallicity (Z . 0.05Z ) stellar
popula-tion. The blue UV-continuum color (β=-2.2) and the ab-sence of a P-Cygni profile, indicating low-metallicity stars with significantly reduced stellar winds, is consistent with this analysis.
• We observe strong high-ionisation interstellar ab-sorption lines in C iv and S iv with a significant blueshift (∆v ∼ 300 km s−1) from the systemic ve-locity and much weaker low-ionisation S ii absorption (EW(Si iiλ1304 ˚A)/EW(Si ivλ1394 ˚A)=0.2). The blueshift of the interstellar lines is surprising when considering how close to the systemic velocity we observe the Lyα line and given that an outflowing-shell model suggests ∆vIS∼ vshell
![Figure 7. The spatial distribution of the C iv emission lines along the lensed galaxy images 1, 2 and 3 of the z = 4.88 arc (green contours, left panel), compared to the [O ii] distribution over the lensed images 2 and 3 from the SINFONI data (S07, brown c](https://thumb-eu.123doks.com/thumbv2/123doknet/14645264.735943/9.892.128.744.159.534/figure-spatial-distribution-emission-contours-compared-distribution-sinfoni.webp)
![Table A1. Input locations of strong lens multiple images [RA, Dec], uncertainty on the position [arcsec], redshift](https://thumb-eu.123doks.com/thumbv2/123doknet/14645264.735943/17.892.487.778.234.491/table-input-locations-strong-multiple-uncertainty-position-redshift.webp)