HAL Id: hal-01027558
https://hal-univ-tln.archives-ouvertes.fr/hal-01027558
Submitted on 22 Jul 2014
HAL is a multi-disciplinary open access archive for the deposit and dissemination of sci-entific research documents, whether they are pub-lished or not. The documents may come from teaching and research institutions in France or abroad, or from public or private research centers.
L’archive ouverte pluridisciplinaire HAL, est destinée au dépôt et à la diffusion de documents scientifiques de niveau recherche, publiés ou non, émanant des établissements d’enseignement et de recherche français ou étrangers, des laboratoires publics ou privés.
Synthesis and microstructure of cobalt ferrite
nanoparticles
Lilia Ajroudi, Sylvie Villain, V. Madigou, N. Mliki, Christine Leroux
To cite this version:
Lilia Ajroudi, Sylvie Villain, V. Madigou, N. Mliki, Christine Leroux. Synthesis and microstruc-ture of cobalt ferrite nanoparticles. Journal of Crystal Growth, Elsevier, 2010, 312, pp.2465. �10.1016/j.jcrysgro.2010.05.024�. �hal-01027558�
Synthesis and microstructure of cobalt ferrite nanoparticles
L.Ajroudi1,2, S.Villain1 , V.Madigou1, N. Mliki2 , Ch.Leroux1
1. IM2NP (UMR-CNRS 6242), Université du Sud Toulon-Var (USTV), Bât.R, B.P.20132, 83957 La Garde Cedex, France
2. LMOP, Physics Department, Faculty of Sciences of Tunis, 2092 Tunis, Tunisia
Abstract
Cobalt ferrites (CoxFe3-xO4) nanoparticles with various compositions were synthesized by a
new non-aqueous synthesis method. The cobalt ferrites were characterized by X-rays diffraction, and transmission electron microscopy coupled with energy dispersive spectroscopy. The nanoparticles are highly crystallized, with a homogeneous chemical composition. The particle size varies from 4 nm up to 7.5 nm, depending on the cobalt content. The smallest particles, with a size of 4 nm, are obtained for high cobalt content. These particles have also the highest micro-structural strain. Catalytic measurements were realized using Fourier Transform Infrared Spectroscopy. The lowest activation energy and the highest conversion rateare obtained for Co1.8Fe2.4O4, in the 400-500 °C temperature range.
Corresponding author: Christine Leroux , [email protected] Université du Sud Toulon Var, USTV, IM2NP, CNRS UMR 6242 Bât. R, BP 20132, F-83957 La Garde Cedex, France
tel 0033 (0)4 94 14 23 12, Fax: 0033 (0)4 94 14 21 68
1 Introduction
Cobalt ferrites have already many applications, mainly because of their original magnetic properties [1-3], associated to low cost of production, chemical stability and bio compatibility. Nanoparticles of cobalt ferrites are used for example in ferrofluid technology [4], biosensors [5] and medical diagnostic [6]. In addition, a new domain for the use of spinel ferrites has opened recently, namely catalysis [7, 8]. In fact, ferrites are already effective catalysts for various processes like treatment of exhaust gases [9], oxidation of toluene [10] or propane [11], gas sensing [12]. Nickel ferrites showed good catalytic properties in the
presence of reducing gas such as CO [13], and cobalt ferrites were tested for the Fischer Tropsch reaction [14].
Many techniques have been developed for the synthesis of CoFe2O4 nanoparticles
during the last years. The most frequent one is the co-precipitation method [15-17], which can be associated to mechanical milling [18]. The synthesis can also be performed under hydrothermal condition [19, 20]. Nanoparticles of cobalt ferrites were also obtained by simple ball milling [21], or combustion method [22]. Soft chemical syntheses, like sol gel [23, 24], or more recently a glycothermal process [25] were developed in order to elaborate very small superparamagnetic nanoparticles of cobalt ferrites. The profusion of syntheses in the literature is explained by the dependence of the nanoferrites magnetic properties on the preparation methods [26].
In this work, we have developed a simple one pot solvothermal synthesis method to obtain cobalt ferrites nanoparticles with the general formula CoxFe3-xO4 for 0.5 < x <2,
according to the phase diagram of the Fe-Co-O system [27]. The nanoparticles of cobalt ferrites were synthesized by the so called “benzyl alcohol route”, which is a surfactant free non aqueous synthesis, derived from the work of Pinna [28]. This benzyl alcohol route was up to now mainly used to synthesize simple oxides like Fe3O4, VO2, CeO2, MnO [28, 29]. It is
then a one step synthesis method, in which the metal precursors are dissolved in benzyl alcohol, the solution put in an autoclave, and heated. This way to do is efficient with a lot of precursors like metal alkoxides, acetylacetonates or acetates. On the contrary, in case of multi metal oxides, the nature of the precursors and the way one dissolves the precursors play an important role. The benzyl alcohol route was then successful only using metal and metal alkoxyde [29,30], which means preparation in a glove box to prevent oxidation of the metal and special care in dissolving the precursors. Our work is the first report of the successful synthesis of a highly crystalline multi metal oxide by simply dissolving two acetylacetonates in benzyl alcohol. Nanoparticles of cobalt ferrites , were already obtained by another one pot non aqueous process using cobalt and iron acetates in diethylene glycol, and heating the solution, but then the obtained nanoparticles were poorly crystallized [31].
We were interested in testing the catalytic properties of these nanoparticles, for further applications in gas sensors.The size distribution, the dispersion, and the chemical composition of the nanoparticles were studied by Transmission Electron Microscopy (TEM), coupled with Energy Dispersive Spectroscopy (EDS) . High Resolution Electron Microscopy (HREM) gave information on the faceting of the particles, and more generally, on their shape. The cell parameter of the spinel phases was determined by X-rays diffraction. Catalytic properties of
the nanopowders in presence of methane were studied by Fourier Transform Infrared (FTIR) Spectrometry of outgoing gases from the reactor cell.
2 Experimental procedures
2.1 Synthesis of CoxFe3-xO4 nanoparticles
The nanoparticules of cobalt ferrite were synthesized by a new non aqueous route, derived from the work of Pinna [28] concerning magnetite nanoparticles. Cobalt (II) 2,4-pentanedionate and iron (III) acetylacetonate, characterized by the total mass of precursors mp = 0.1 g, 0.5 g, 1 g, and 5 g, were dissolved in benzyl alcohol. The relative proportion of
both precursors was chosen in order to obtain different nominal composition Co0.6Fe2.4O4,
Co1Fe2O4, Co1.2Fe1.8O4 and Co1.8Fe1.2O4 referred respectively as x = 0.6, x = 1, x = 1.2 and x
= 1.8. The solution was then stirred for 4 hours, poured into a 45 ml teflon cup, which was sealed into a steel autoclave, and heated in a furnace at 175 °C for 48 hours. After cooling, the suspension was several times washed with ethanol and dichloromethane, sonicated and centrifuged, in order to remove the excess of solvent. A black powder was obtained after a final drying at 80 °C. The whole procedure of washing and centrifugation was done until no more solvent could be extracted. The mass of cobalt ferrites obtained with low amount of precursors was not sufficient for further experiments, and physical properties of the nanoparticles were studied on powders obtained with 5 g of precursors, corresponding to 1 g of final cobalt ferrite powder.
2.2 Structural characterization
Morphologies, crystal sizes and chemical compositions of the nanoparticles were determined by TEM, coupled with EDS, using a Tecnai G2 200 kV with a LaB6 source and a
point to point resolution of 0.25 nm. Images were recorded using a 1K x 1K Slow Scan CCD camera. The statistical study on particle size was carried on over 500 particles for one composition. EDS analyses were performed in nanoprobe mode, with a spot size of 7 nm, thus on a single particle. On the contrary, several particles were analysed together in the microprobe mode, with a spot size of 100 nm.
The nanopowders were also characterized by X-rays diffraction. The diagrams were recorded in a classical θ-2θ angles coupled mode, on a Siemens-Bruker D5000 diffractometer, operating with a copper X-rays source and equipped with a back monochromator, to avoid fluorescence. The diagrams were collected with a step of 0.04°, a time of 20s per step, over a
2θ range from 15 to 115°. Information about cell parameters, crystal sizes and micro-deformations were extracted using the whole pattern fitting Powdercell software.
2.3 FTIR spectroscopy
Powders, placed in a heated cell built of porous ZrO2 in a steel tube, were exposed to a
slow continuous flow (10 cm3.min-1) of air-CH4 gas, and outgoing gases were analysed by
FTIR spectroscopy (Unicam-Mattson spectrometer) [32]. The catalytic conversion of CH4
leads to CO2 and H2O, via the classical combustion reaction CH4 +2 O2 → CO2 +2 H2O.
Thus, we related the catalytic efficiency of one sample to the detected amount of CO2, hence
to the CO2 absorption peak intensity I (t) in the FTIR spectra. More precisely, as there is a
continuous flow of CH4, a flow of CO2 , (t)
dt CO [ d 2]
, is produced when the reaction occurs,
and the intensity of the CO2 absorption peak in one spectrum corresponds to the sum of
) t ( dt CO [ d 2]
over the acquisition time τ of the spectrum. Assuming a continuous variation of CO2 flow during the acquisition time τ, I(t) can be considered proportional to the mean value
of (t) dt CO [ d 2]
over τ. For the different samples, the same amount of powder (0.3 g) was used. Different CH4 concentrations in air (625 ppm, 1250 ppm, 2500 ppm) fixed by mass flow
controllers and different temperatures were tested (400 °C, 450 °C and 500 °C). The FTIR spectra of the outgoing gases were recorded every 30 s, with a recording time of 12 s. The initial time t = 0 s corresponds to the moment where the CH4 is injected.
3 Results and discussion
3.1 Structure, morphology, chemical composition
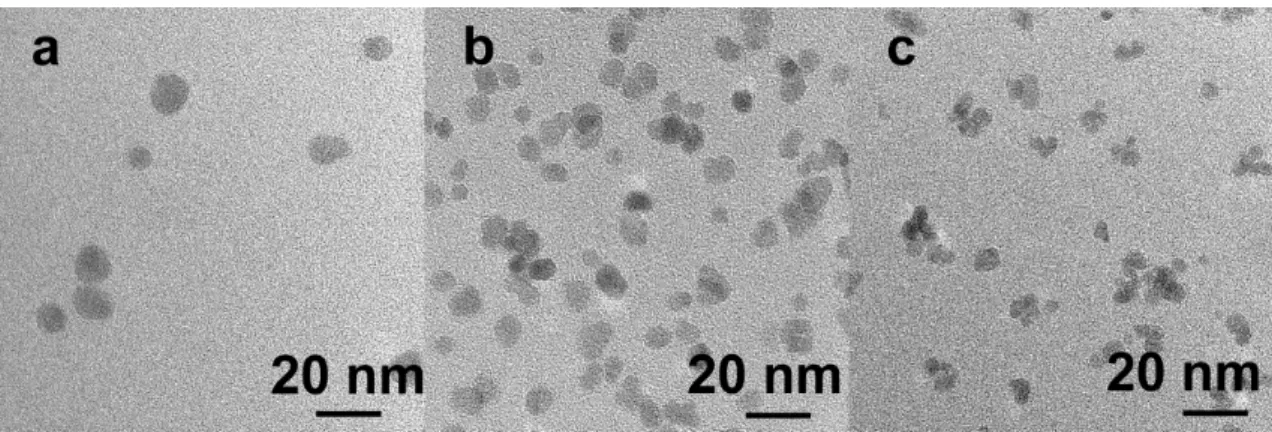
Whatever the composition of the cobalt ferrites powders, and the initial amount of precursors put in benzyl alcohol, we observed by TEM well crystallized and well dispersed nanoparticles (Fig. 1).
Figure 1: TEM images of well dispersed CoxFe3-xO4 nanoparticles, for different cobalt amount x and different
quantity of precursors mp: a) x=0.6, mp=5g; b) x=1, mp=1g; c) x=1.8, mp=1g.
The size distribution of the particles is shown in Fig.2, the mean size and the standard deviation are given in Table 1.
Figure 2: Size distribution of the CoxFe3-xO4 nanoparticles, for different cobalt amount x and different quantity of
precursor mp; x=0.6, x=1 and x=1.8, prepared with mp=1g (a, b, c) and mp=5g (d, e, f).
The mean size of the nanoparticles decreases slightly with increasing cobalt amount x in CoxFe3-xO4, and the smallest ones (4 nm, Fig. 2) are obtained for the highest cobalt amount,
x = 1.8. Measurements of the particles sizes were performed with an error of 0.5 nm. Thus, the slight decrease of the mean size with mp, the precursors mass, for a given cobalt amount,
is not significant. The size distribution of the particles is somewhat influenced by the initial amount of precursors, with broader size distribution for high precursor amount (Fig. 2), due to the presence of particles with sizes around 12-16 nm.
(x; mp) Particle size (nm) Deviation mean σ (nm) (0.6; 1g) 7.5 1.5 (0.6; 5g) 7 2 (1; 1g) 7 1 (1; 5g) 6.5 1 (1.8; 1g) 5 1 (1.8; 5g) 4 1.5
Table 1: Mean size of the particles, and standard deviation, as determined by TEM.
High resolution images showed that these bigger particles are in fact produced during a coalescence phenomenon in powders elaborated with mp = 5 g. Fig. 3 is one example of two
“spherical” nanoparticles building one crystallite, with classical (111) twin boundaries.
Figure 3: HREM image of one Co1Fe2O4 particle oriented with a zone axis [110], resulting from the coalescence
of two particles (the twin boundary is indicated by an arrow).
The relative amount of cobalt and iron influences the morphology of the particles. Particles with a nominal composition near CoFe2O4, are almost spherical (Fig. 4a, x = 0.6),
but clearly more facetted for x = 1 (Fig. 4b). For composition near Co2FeO4, the shape of the
particle is very irregular (Fig. 4c). Concerning the crystallographic structure of the nanoparticles, whatever the composition, the Fast Fourier Transform (FFT) realized on HREM images showed that each particle was monocrystalline, with the expected spinel structure (see Fast Fourier Transform in Fig. 4).
Figure 4: HREM images of nanoparticles, a) nearly spherical Co0.6Fe2.4O4 nanoparticle, oriented [121] (see
FFT a). b) CoFe2O4 nanoparticle, oriented [121], with (113) and (111) facets (see FFT b). c) Two Co1.8Fe1.2O4
nanoparticles with irregular shapes oriented [211] and [111] (see FFT c).
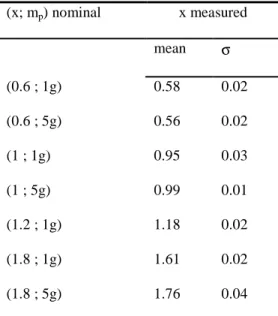
The chemical composition of the powders was determined by EDS analyses. In the microprobe mode, up to 10 particles were analysed together. Results are summarised in Table 2. The measured compositions are in agreement with the nominal composition, excepted for one powder (x = 1.8 ; mp = 1 g). The standard deviation is low, within the experimental error
of EDS analyses, commonly estimated to be 1-2 at. %. This indicates a homogeneous composition of the powders. For some compositions, single particles were analysed, in the so called nanoprobe mode, with a probe size of 7 nm. Both modes led to the same mean composition for the different powders, but with a higher dispersion of the nanoprobe results
x = 1.6 to x = 1.8 could be observed. Let us remember that Fe3O4 has an inverse spinel
structure and Co3O4 a normal spinel one. With increasing x, cobalt ferrites CoxFe3-xO4 change
from the inverse spinel structure to the normal spinel structure [27]. Around x = 2, a spinodal decomposition for cobalt ferrites annealed at high temperatures was evidenced [33,34], with compositions fluctuations from x = 1.1 to 2.7. The HREM characterization of the nanoparticles, coupled with EDS analyses, showed that this decomposition did not occurred in our samples. (x; mp) nominal x measured mean σ (0.6 ; 1g) 0.58 0.02 (0.6 ; 5g) 0.56 0.02 (1 ; 1g) 0.95 0.03 (1 ; 5g) 0.99 0.01 (1.2 ; 1g) 1.18 0.02 (1.8 ; 1g) 1.61 0.02 (1.8 ; 5g) 1.76 0.04
Table 2: Mean composition (with the standard deviation) of the CoxFe3-xO4 powders, obtained by EDS analyses
The X-rays diagrams obtained on CoxFe3-xO4 nanopowders, for 4 different
compositions could all be indexed in a single spinel cubic structure. One diagram is shown Fig. 5.
For each composition, the whole diagram was fitted with Powdercell, using the inverse spinel CoFe2O4 structure, and pseudo Voigt functions. As scattering factors for cobalt and
iron are nearly the same, no refinement of the occupation of the different atomic sites was attempted. The goodness of fit G=Rwp/Rexp was around 1.2 for the different fitted diagrams.
Zero shift, cell parameters, and Full Half Width at Half Maximum (FHWM) or breadth
β
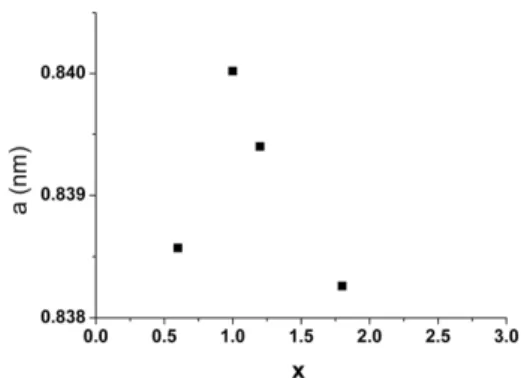
were obtained. The values for cell parameters, grain size, and crystallographic distortions are collected in Table 3. The lattice parameter varies peculiarly with the cobalt concentration x of the ferrites, with a maximum value attained for x = 1 (a = 0.84002 nm), and a minimum value for x = 1.8 (a = 0.83826 nm) (Fig 6). x a (nm) D (nm) ε 0.6 0.83857 10.5 0.011 1 0.84002 10 0.018 1.2 0.83940 10 0.020 1.8 0.83826 8.5 0.028Table 3 : Cell parameters, crystallite size and distortion, as determined by X rays diffraction.
Fig.6: Evolution of the cell parameter a, with x in CoxFe3-xO4 powders.
A similar variation of the cell parameter for cobalt ferrites with x < 1 and x > 1 was already observed by [35], and linked to the variation of the Fe3+, Fe2+, Co3+ and Co2+ repartition on tetrahedral and octahedral sites. Let us remember that in pure Fe3O4 inverse
spinel structure, all the tetrahedral sites A (8a) are occupied by Fe3+, as octahedral sites B (16d) are occupied by Fe3+ and Fe2+ in equal proportion. On the contrary, for Co3O4,
octahedral sites are occupied by Co3+ and tetrahedral sites by Co2+ (normal spinel). Thus, the determination of the precise repartition of the different cations in cobalt ferrites gave rise to a rich literature, among them [33, 36]. It is now admitted that for low cobalt content, Co2+ replaces Fe2+ on octahedral sites, but also Fe3+ on tetrahedral sites, leading to an increase of the cell parameter with increasing x. The decrease of the cell parameter, when x varies from 1 to 3, is explained by an increasing substitution of Fe3+ by Co3+ in octahedral sites. The breadth
β
of pseudo Voigt functions is usually linked to the size D of the diffracting domains and to the crystallographic distortionε
by the relation:2 2 2 2 * d * D 1 * d * + = β β ε , with λ θ β β*= cos and
λ θ
sin 2 *
d = , where
λ
is the wavelength of the incident X-rays,θ
is the diffraction angle.Thus, using Halder-Wagner-Langford (HWL) plots, with 2 * d * β drawn as a function of 2 * d * β , D
and
ε
could be deduced. The HWL plots showed a slight decrease of the size of the nanoparticles and an increase of the crystallographic distortion, for increasing cobalt amount (Table 3).3.2 Catalytic activity
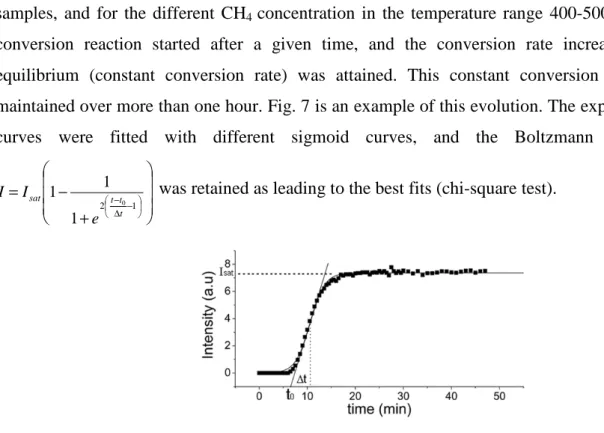
The kinetics of the CH4 conversion followed the same scheme, for all the tested
samples, and for the different CH4 concentration in the temperature range 400-500 °C. The
conversion reaction started after a given time, and the conversion rate increased until equilibrium (constant conversion rate) was attained. This constant conversion rate was maintained over more than one hour. Fig. 7 is an example of this evolution. The experimental curves were fitted with different sigmoid curves, and the Boltzmann function,
+ − = − ∆ − 1 2 0 1 1 1 t t t sat e I
I was retained as leading to the best fits (chi-square test).
Figure 7: One example of the conversion kinetic of CH4 into CO2, obtained at 450°C, with Co1.8Fe1.2O4 as
catalytic powder, under 1250ppm CH4 in air. t0 corresponds to the time at which the slope of the curve at Isat/2
intercept I=0 and ∆t is the time delay between I=0 and Isat/2.
Full methane conversion rate was obtained at 500 °C for the different cobalt ferrites and for various CH4 concentrations. The Isat values, corresponding to constant conversion rate,
were normalized to the highest Isat value, which correspond to 100 % CH4 conversion rate (see
Fig.8). The highest conversion rate at a given temperature is obtained for x = 1.8, the powder with the smallest particle size. The powders with x = 0.6 and x = 1 have comparable
conversion rates excepted for high concentration of CH4 for which the cobalt ferrite powder
with x = 0.6 shows a slightly better conversion rate than for the powder with x = 1.
Figure 8: Methane conversion rate,plotted versus temperature, for different CoxFe3-xO4 powders (x= 0.6 ;
x=1 ; x=1.8 ∆) and different CH4 concentrations (2500 ppm in black ; 1250 ppm in gray ; 625 ppm in white)
The nanoparticles Co1.8Fe1.2O4 are the smallest ones from the tested CoxFe3-xO4
nanopowders, and with the most irregular exposed surfaces, thus correspond to the highest exposed surface. Co0.6Fe2.4O4 and Co1Fe2O4 have nearly the same size and the same spherical
shape. It is well known that the efficiency of the catalytic conversion increases with the amount of exposed surface, the nature of the exposed cation sites, and the number and type of defects at the surface [37-39]. A relationship between particle size and catalytic activity was recently evidenced in the case of CoFe2O4 nanoparticles [40], thus for only one composition x
= 1. Evans et al. [40] showed that a increase of the particle size induces a significant lowering of the conversion rate at a given temperature; the variation of methane conversion rate at a given temperature, for a size variation of the particles from 6 to 8 nm, is around 10 to 15 %. We observed bigger variations of the conversion rate, around 20 to 25 %, indicating that the size effect is not the only one affecting the conversion rate. By comparing the conversion rate for x = 0.6 and x = 1, it appears that vacancies and cation distribution play a role in the catalytic reaction. Indeed, nanoparticles with x = 0.6 and x = 1 have nearly the same size and shape, but differ in their composition, x = 1 corresponding to the stoechiometric composition, thus to the particles with the less vacancies. More information can be obtained about the mechanism of the reaction which governs the conversion of CH4 into CO2 by considering the
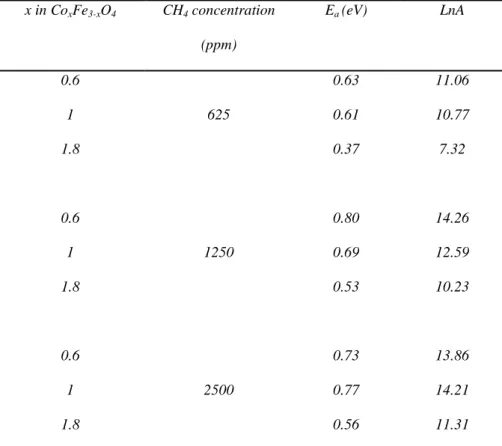
apparent activation energy of the process. When drawing the saturation values as Arrhenius plots, kT E LnA I
Ln( sat)= − , one obtained linear plots. The apparent activation energies as
well as the pre-exponential factor LnA, deduced from linear regression, are listed in Table 4.
x in CoxFe3-xO4 CH4 concentration (ppm) Ea (eV) LnA 0.6 0.63 11.06 1 625 0.61 10.77 1.8 0.37 7.32 0.6 0.80 14.26 1 1250 0.69 12.59 1.8 0.53 10.23 0.6 0.73 13.86 1 2500 0.77 14.21 1.8 0.56 11.31
Table 4: Apparent activation energy Ea (eV), and pre-exponential factor LnA, for different compositions x of the
CoxFe3-xO4 powders and for three different CH4 concentration in air (625 ppm, 1250 ppm, 2500 ppm).
The apparent activation energy varies from 0.4 eV to 0.8 eV, depending on the methane concentration and on the cobalt amount. The lowest activation energies are obtained for x = 1.8, whatever the temperature and the CH4 concentration, indicating the reaction is
easier for this composition. These values are in the range of those obtained when assuming a first order kinetic model for the combustion of methane [41], on various cobaltites.
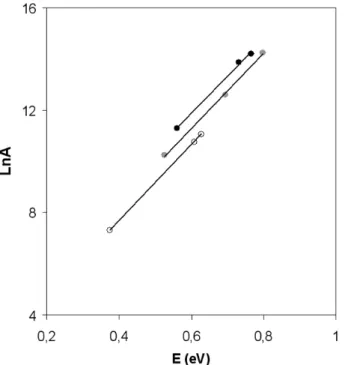
The constant slopes obtained in Fig.9, where LnA is plotted versus the apparent activation energies, for the different samples and CH4 concentrations, indicate that basically,
the nature of the active site is the same over the various samples [42]. The decrease of the activation energy is then linked to an increase in concentration of active sites in the different samples. The composition x = 1.8 is non stoechiometric, and the number of defects will be also higher than for the other tested compositions. These results indicate that the size effect
governs the catalytic efficiency, but also that defects and vacancies play a role in the catalysis process.
Figure 9 : plot of the pre exponential factor, LnA, versus the apparent activation energy, E (eV), for the different samples (x=0.6, x=1, x=1.8) for various CH4 concentration (2500 ppm in black ; 1250 ppm in gray ; 625 ppm
in white)
Information about the kinetics of the conversion process can be found in the values of
∆t, the delay between the beginning of the reaction and the half constant conversion rate (see Table 5).
CH4 concentration (ppm)
x T (°C) 625 1250 2500
∆t (min) ∆t (min) ∆t (min)
400 5 3.5 6 450 4 3 5.5 0.6 500 4.5 3 3.5 400 4 3.5 4 450 4.5 3 3 1 500 4.5 4 3 400 4.5 3.5 5.5 450 5 3 3 1.8 500 5 3 2.5
Table 5: Collected dynamic data ( ∆t), at different temperatures in the range 400°C-500°C, for three different CH4 concentrations in air and for three different composition x of the CoxFe3-xO4 powders.
For all the samples, temperatures, and CH4 concentrations, ∆t values, are independent
from the composition of the powders, and depend on the CH4 concentration and on
temperatures. More precisely, ∆t is independent of temperature for low and medium CH4 concentration, but decreases with temperature at high CH4 concentration. This indicates a change in the mechanisms governing the reaction for low CH4 and high CH4 concentration.
This phenomenon was predicted in the case of the Langmuir- Hinshelwood mechanism [43]. This mechanism was evidenced already in mixed oxides, although it is more often associated to metal supported catalysts [44]. However, the experimental device we used to test the catalytic activity of the cobalt ferrites powder can only give some hints on the mechanism involved in the oxidation of methane.
4 Conclusion
Cobalt ferrites nanoparticles CoxFe3-xO4 with various compositions (x = 0.6, x = 1,x = 1.8),
were obtained by a very simple non aqueous one pot process. These particles proved to be well dispersed, highly crystalline and chemically very homogeneous, even at the level of individual particles, and even for composition near Co2FeO4. Depending on the cobalt
content, the size of the particles varied from 4 nm for high cobalt content up to 7.5 nm for low cobalt content. The shape of the nanoparticles was also influenced by the cobalt content, nearly spherical particles being obtained for low cobalt content, as for high cobalt content the shape of the particles was very irregular.
The catalytic tests showed that cobalt ferrite powders are valuable candidates for the combustion of methane. Among the different powders tested, Co1.8Fe1.2O4 has the most
interesting behaviour, with low activation energies and high conversion rates. This can be related to the microstructure of this powder, composed of very small particles with irregular shapes and to the increase of active sites with the cobalt amount in CoxFe3-xO4.
Acknowledgements:
The authors acknowledge the financial support of the France-Tunisia Cooperation Program (CMCU 06/S1309)
References
[1] M. Sugimoto, J. Am. Ceram. Soc. 82 (1999) 269.
[2] A. Virden, S. Wells, K. O’Grady, J. Magn. Magn. Mater. 316 (2007) 768. [3] D.S. Mathew, R.S. Juang, Chem. Eng. J. 129 (2007) 51.
[4] J.-C. Bacri, R. Perzynski, D. Salin, V. Cabuil, R. Massart, J. Magn. Magn. Mater. 62 (1986) 36.
[5] M. Pita, J.M. Abad, C. Vaz-Dominguez, C. Briones, E. Mateo-Marti, J.A. Martin-Gago, M. del Puerto Morales, V.M. Fernandez, J. Colloid Interface Sci. 321 (2008) 484.
[6] D.K. Kim, Y. Zhang, W. Voit, K.V. Rao, J. Kehr, B. Bjelke, M. Muhammed, Scr. Mater. 44 (2001) 1713.
[7] C.G. Ramankutty, S. Sugunan, Appl. Catal., A 218 (2001) 39.
[8] L.C.A. Oliveira, J.D. Fabris, R.R.V.A. Rios, W.N. Mussel, R.M. Lago, Appl. Cata. A 259 (2004) 253.
[9] D. Fino, N. Russo, G. Saracco, V. Specchia, J. Catal. 242 (2006) 38.
[10] M. Florea, M. Alifanti, V.I. Parulescu, D. Mihaila-Tarabasanu, L. Diamandescu, M. Feder, C. Negrila, L. Frunza, Catal. Today 141 (2009) 361.
[11] Q. Liu, L.C. Wang, M. Chen, Y. Cao, .H.Y. He, K.N. Fan, J. Catal. 263 (2009) 104. [12] K. Madhusudan Reddy, L. Satyanarayana, S.V. Manorama, R.D.K. Misra, Mater. Res. Bull. 39 (2004) 1491.
[13] M.M. Raschad, O.A. Fouad, Mater. Chem. Phys. 94 (2005) 365.
[14] A. Mirzaei, R. Habibpour, M. Faizi, E. Kashi, Appl. Catal. A 301 (2006) 272.
[15] F. Bensebaa, F. Zavaliche, P. L’Ecuyer, R.W. Cochrane, T. Veres, J. Colloid Interface Sci. 277 (2004) 104.
[16] J. Wang, T. Deng, Y. Lin, C. Yang, W. Zhan, J. Alloys Compd. 450 (2008) 532. [17] Z. Jiao, X. Geng, M. Wu, Y. Jiang, B. Zhao, Colloids Surf. A 313-314 (2008) 31. [18] Y. Shi, J. Ding, H. Yin, J. Alloys Compd. 308 (2000) 290.
[19] L.J. Cote, A.S. Teja, A.P. Wilkinson, Z.J. Zhang, Fluid Phase Equilib. 210 (2003) 307. [20] D. Zhao, X. Wu, H. Guan, E. Han, J. Supercritical Fluids 42 (2007) 226.
[21] R. Sani, A. Beitollahi, Y.V. Maksimov, I.P. Suzdalev, J. Mater. Sci. 42 (2007) 2126. [22] C.-H. Yan, Z.-G. Xu, F.-X. Cheng, Z.-M. Wang, L.-D. Sun, C.-S. Liao, J.-T. Jia, Solid State Commun. 11 (1999) 287.
[23] N. Hanh, O.K. Quy, N.P. Thuy, L.D. Tung, L. Spinu, Phys. B 327 (2003) 382.
[26] M.H. Khedr, A.A. Omar, S.A. Abdel - Moaty, Colloids Surf. A 281 (2006) 8.
[27] I.-H.Jung, S. A. Decterov, A. D. Pelton, H. –M. Jim, Y. –B. Kang, Acta Mat. 52 (2004) 507.
[28] N. Pinna, S. Grancharov, P. Beato, P. Bonville, M. Antonietti, M. Niederberger, Chem. Mater. 17 (2005) 3044.
[29] N.Pinna, M. Niederberger, Angew. Chem. 47 (2008) 5292
[30] M. Niederberger, G. Garnweitner, N.Pinna, M. Antonietti, J. Am. Chem. Soc. 126 (2004) 9120
[31] G. Baldi, D.Bonacchi, M. C. Franchini, D. Gentili, G. Lorenzi, A. Ricci, C. Ravagli, Langmuir 23 (2007) 4026
[32] M.-I. Baraton, L. Mehrari, Scripta Mat. 44 (2001) 1643.
[33] T.A.S. Ferreira, J.C. Waerenborgh, M.H.R.M. Mendonça, M.R. Nunes, F.M. Costa, Solid State Sci. 5 (2003) 383.
[34] H. Le Trong, A. Barnabe, L. Presmanes, Ph. Tailhades, Solid State Sci. 10 (2008) 550. [35] D.H. Lee, H.S. Kim, J.Y. Lee, C.H. Yo, K.H. Kim, Solid State Commun. 96 (1995) 445. [36] M.F.F. Lelis, A.O. Poro, C.M. Gonçalves, J.D. Fabris, J. Magn. Magn. Mater. 278 (2004) 263.
[37] J.-P. Jacobs, A. Maltha, G.H. Reintjes, J. Drimal, V. Ponec, H. H. Brongersma, J. Cat. 147 (1994) 294.
[38] L. Satyanarayana, K. Madhusudan Reddy, S.V. Manorama, Mater. Chem. Phys. 82 (2003) 21.
[39] D.Y. Murzin, Chem. Eng.Sci. 64 (2009) 1046.
[40] G. Evans, I.V. Kozhevnikov, E.F. Kozhevnikova, J.B. Claridge, R. Vaidhyanathan, C. Dickinson, C.D. Wood, A.I. Cooper, M.J. Rosseinsky, J. Mater. Chem. 18 (2008) 5518. [41] M. Bosomoiu, G. Bozga, D. Berger, C. Matei, Appl. Catal. B 84 (2008) 758.
[42] G.A. El-Shobaky, A.M. Turky, N.Y.Mostafa, S.K. Mohamed, J. Alloys Compd. 493 (2010) 415
[43] H. Lynggaard, A. Andreasen, C. Stegelmann, P. Stoltze, Prog. Surf. Sci. 77 (2004) 71. [44] S. Pengpanich, V. Meeyoo, T. Rirksomboon, K. Bunyakiat, Appl. Cat. A 234 (2002) 221.
![Figure 3: HREM image of one Co 1 Fe 2 O 4 particle oriented with a zone axis [110], resulting from the coalescence of two particles (the twin boundary is indicated by an arrow)](https://thumb-eu.123doks.com/thumbv2/123doknet/14636226.734877/7.892.272.626.104.339/figure-particle-oriented-resulting-coalescence-particles-boundary-indicated.webp)
![Figure 4: HREM images of nanoparticles, a) nearly spherical Co 0.6 Fe 2.4 O 4 nanoparticle, oriented [ 1 2 1 ] (see FFT a)](https://thumb-eu.123doks.com/thumbv2/123doknet/14636226.734877/8.892.122.760.102.745/figure-hrem-images-nanoparticles-nearly-spherical-nanoparticle-oriented.webp)