HAL Id: hal-01632263
https://hal-amu.archives-ouvertes.fr/hal-01632263
Submitted on 7 Mar 2020HAL is a multi-disciplinary open access
archive for the deposit and dissemination of sci-entific research documents, whether they are pub-lished or not. The documents may come from teaching and research institutions in France or abroad, or from public or private research centers.
L’archive ouverte pluridisciplinaire HAL, est destinée au dépôt et à la diffusion de documents scientifiques de niveau recherche, publiés ou non, émanant des établissements d’enseignement et de recherche français ou étrangers, des laboratoires publics ou privés.
Global Histogram Stretching Based on Adaptive
Parameter Acquisition
Dongmei Huang, Yan Wang, Wei Song, Jean Sequeira, Sébastien Mavromatis
To cite this version:
Dongmei Huang, Yan Wang, Wei Song, Jean Sequeira, Sébastien Mavromatis. Shallow-water Image Enhancement Using Relative Global Histogram Stretching Based on Adaptive Parameter Acquisition. 24th International Conference on Multimedia Modeling - MMM2018, Feb 2018, Bangkok, Thailand. �hal-01632263�
Global Histogram Stretching Based on Adaptive
Parameter Acquisition
Dongmei Huang1, Yan Wang1 (*), Wei Song1 (*), Jean Sequeira2 and Sébastien Mavromatis2
1 College of Information Technology, Shanghai Ocean University, Shanghai, China {Dmhuang, wsong}@shou.edu.cn, [email protected]
2 Aix-Marseille University, France
{jean.sequeira, sebastien.mavromatis }@univ-amu.fr
Abstract. Light absorption and scattering lead to underwater image showing low
contrast, fuzzy, and color cast. To solve these problems presented in various shal-low-water images, we propose a simple but effective shalshal-low-water image en-hancement method - relative global histogram stretching (RGHS) based on adap-tive parameter acquisition. The proposed method consists of two parts: contrast correction and color correction. The contrast correction in RGB color space firstly equalizes G and B channels and then re-distributes each R-G-B channel histogram with dynamic parameters that relate to the intensity distribution of original image and wavelength attenuation of different colors under the water. The bilateral filtering is used to eliminate the effect of noise while still preserving valuable details of the shallow-water image and even enhancing local infor-mation of the image. The color correction is performed by stretching the ‘L’ com-ponent and modifying ‘a’ and ‘b’ comcom-ponents in CIE-Lab color space. Experi-mental results demonstrate that the proposed method can achieve better percep-tual quality, higher image information entropy, and less noise, compared to the state-of-the-art underwater image enhancement methods.
Keywords: Shallow-water image enhancement, Relative global histogram
stretching (RGHS), Adaptive parameter acquisition.
1
Introduction
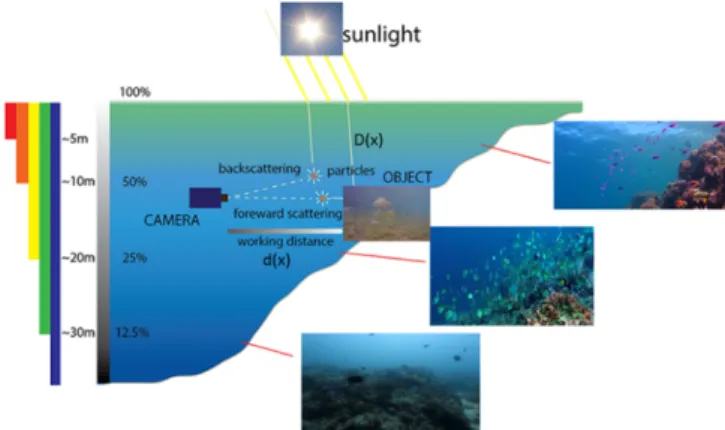
Restoring clear and real video of underwater image is of great importance to marine ecology, underwater archaeology, underwater biological recognition, and underwater robot vision [1]. However, in contrast with the images under natural environment, the underwater image is more complex and poorly visible. Main reason has two aspects: one is the underwater environment and the influence of water turbidity, the second is the light absorption, scattering and reflection. Assuming most clear coastal water with a high level of attenuation, the light beam absorbs and scatters, as illustrated in Fig. 1.
Before reaching the camera, the light is reflected and deflected multiple times by parti-cles present in the shallow water [2]. In the water, the longer the wavelength is, the faster the light disappears. Compared with green and blue, red is the most affected, so underwater images appear blue tone. To compensate for the light absorption, underwa-ter image acquisition is often illuminated with artificial lights.
Fig. 1. The basic model of underwater optical imaging and the selective fading of
underwater lighting
Generally speaking, underwater images can be restored and enhanced by two cate-gories of algorithms and techniques: physics-based methods and image-based methods [3]. The former method enhances underwater images by considering the basic physics of light propagation in the water medium. For example, Zhao et al. [4] derived inherent optical properties of water from the background color of underwater images and used for underwater image enhancement. Due to the hazing effects of underwater images caused by light scattering and color change, a phenomenon similar as the effect of heavy fog in the air, He’s Dark Channel Prior (DCP) dehazing method [5] is widely used in underwater image enhancement [6, 7]. The algorithm based on wavelength compensa-tion and image dehazing (WCID) [8] compensates the attenuacompensa-tion discrepancy along the propagation path and the influence of the possible presence of an artificial light source. It effectively enhances visibility and restore the color balance of underwater images, but requires high computing resources and long computing time.
Image-based methods are usually simpler and more efficient than physics-based methods. Color equalization is widely adopted approach to deal with color cast problem of underwater image, where blue or green color is dominant. Iqbal et al. proposed the integrated color model (ICM) [9] and the unsupervised color correction method (UCM) [10]. These methods used the histogram stretching in RGB color mode and then satu-ration-intensity stretching in HSI color model to enhance the contrast of the images and correct color cast. Different from ICM, the UCM is to modify red and green channels based on the Von Kries hypothesis and stretch one side or both side according to the characteristic of each R-G-B channel. The output results of these two methods do not
have significant difference and still exist blue-green illumination, and may bring seri-ous noise to the enhanced image [11]. But, ignoring the characteristics of different channels, [11] applies the Rayleigh distribution to stretch each channel.
Considering the validity of the physical model used in the underwater image and the simplicity of the inherent nature of the underwater image, we propose a new method, namely relative global histogram stretching (RGHS). It is mainly on the basis of the equalization of G-B channels and histogram stretching in the RGB color model but determines the tensile range parameters according to both the distribution features of original image and the light absorption of different wavelength under the water. The bilateral filter is a simple, non-iterative scheme for edge-preserving smoothing to be used to effectively capture the fine details after the image is stretched in the RGB color model. After the contrast correction and color correction are performed, our method can preserve the image details and enhance visibility. The superiority of our method to the classic DCP, ICM and UCM methods is illustrated from having the highest value of entropy [12]and UCIQE [13], the lowest value of Q-MOS [14]and MSE [15].
The rest of the paper is organized as followed: Section 2 introduces related pro-cessing on the underwater image enhancement. Section 3 show the shallow-water im-age enhancement model in details. The results and evaluation are expressed in Section 4, followed by conclusion in section 5.
2
RELATED WORK
2.1 Underwater ModelA well-known haze image function model [16, 17] is often used to approximate the propagation equation of underwater scattering in the background light. The equation is as follows:
𝐼!(𝑥) = 𝐽!(𝑥)𝑡!(𝑥) + )1 − 𝑡!(𝑥),𝐵! (1)
Where the light wavelength 𝜆 ∈ {𝑟𝑒𝑑, 𝑔𝑟𝑒𝑒𝑛, 𝑏𝑙𝑢𝑒}, 𝑥 represents the pixel point in the underwater image I!(𝑥), 𝐽!(𝑥) is the scene radiance at point 𝑥, 𝑡!(𝑥) is the residual
energy ratio of after reflecting from point 𝑥 in the underwater scene and reaching the camera, B! is the uniform background light. 𝐽!(𝑥)𝑡!(𝑥) describes the direct attenuation
of scene radiance in the water [20]. Note that the residual energy ratio 𝑡!(𝑥) is a
func-tion of both 𝜆 and the scene–camera distance 𝑑(𝑥), which reflects the overall effects for both light scattering and color change suffered by light with wavelength traveling the underwater distance 𝑑(𝑥). Thus, 𝑡!(𝑥)can be represented as (2):
𝑡!(𝑥) = 𝑁𝑟𝑒𝑟(𝜆)"($) (2)
𝑁𝑟𝑒𝑟(𝜆) is the normalized residual energy ratio, which refers to the ratio of residual to initial energy for every unit of distance propagated. As showed in the Fig. 1, where the green and blue lights process shorter wavelength and high frequency thereby atten-uates extraordinarily lower than the red counterpart. This is why the deep sea image appears the bluish tone prevalent but the performance of the shallow-water image is not
obvious. The dependency of 𝑁𝑟𝑒𝑟(𝜆) on the light wavelength can be defined based on that of Ocean Type I as (3).
Nrer(λ) = C
0.8~0.85 if λ = 650~750µm(red) 0.93~0.97 if λ = 490~550µm(green)
0.95~0.99 if λ = 400~490µm(blue) (3) In this paper, these equations will be considered to decide the maximum range of R-G-B channel in the RGHS.
2.2 Histogram Stretching
Due to the relative-concentrated distribution and quite low histogram range, underwater images often have low contrast and visibility. Histogram stretching is therefore adopted to provide a better pixel distribution of the image channels to the whole dynamic range and thus improve the image contrast. A linear contrast stretching function as (4) is used in [9]–[11], [18], [19].
𝑝& = (𝑝'− 𝑎) Z*)+()"[ + 𝑑 (4)
where 𝑝' and 𝑝& are the input and output pixels intensity values, respectively,
𝑎, 𝑏 and 𝑐, 𝑑 represent the minimum and maximum intensity of the input image and the targeted output images, respectively. In a global stretching, 𝑐 and 𝑑 are constant and often set to 255 and 0 respectively; 𝑎 and 𝑏 are selected at 0.2% and 99.8% in the whole histogram of original image.
3
Shallow-water Image Enhancement Model
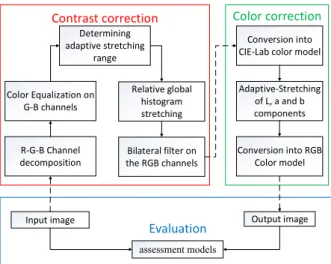
Fig. 2 shows the entire processing of our proposed method, which includes three main steps: 1) contrast correction, 2) color correction and 3) quality assessment.
Fig. 2. The entire processing of our proposed method
In the contrast correction step, we apply the color equalization and the relative global histogram stretching (RGHS) to the image after R-G-B channel decomposition. The bilateral filter is used to eliminate the noise after the above transformation when pre-serving the details of the desired colorful underwater image [20]. This will neutralize the low contrast and reduce color cast effect due to light scattering and absorption. In the color correction step, we apply simple global histogram stretching to the ‘L’ com-ponent of the image and adjust for the ‘a’ and ‘b’ comcom-ponents in CIE-Lab color space. The adaptive-stretching of ‘L’, ‘a’ and ‘b’ will improve the saturation and brightness of the image to obtain more vivid color. In the last step, we use five quality assessment models to evaluate the enhancement performance of the proposed method.
3.1 Gray-World Color Equalization
In the underwater situation, images are rarely color balanced correctly. After R-G-B channel decomposition, we firstly conduct color equalization for underwater image. Iqbal et al. (2010) adjusted the color values of the RGB components based on Von Kries hypothesis [10], which keeps the dominant color cast channel constant. Based on the UCM model, once the average of one channel is extraordinary low, the channel must multiply with a bigger multiplier, which will cause the wrong pretreatment of image color. However, Inspired by the Gray-World (GW) assumption theory [21]that the average value of color object in a perfect image is gray, we correct the G-B channel following the assumptions shown as (5), (6).
Z)𝑅+,-+ 𝐺+,-+ 𝐵+,-,[ /3 = 0.5 (5)
where 𝑅+,-, 𝐺+,-, 𝐵+,- are the normalized average values of the recovered red channel,
green channel, blue channel, respectively.
Input image Adaptive-Stretching of L, a and b components Conversion into RGB Color model Output image Conversion into CIE-Lab color model Contrast correction Color correction
Relative global histogram stretching Determining adaptive stretching range assessment models Evaluation R-G-B Channel decomposition Color Equalization on G-B channels Bilateral filter on the RGB channels
𝐺+,- =/00∗23. ∑'5.2 ∑345.𝐼-(𝑖, 𝑗), 𝜃-=86.0
!"# 𝐵+,- =/00∗23. ∑'5.2 ∑345.𝐼*(𝑖, 𝑗), 𝜃* =96.0
!"#
(6) We correct the G and B channels following the GW assumption theory. Here, R channel is not considered because the red light in the water is hard to compensate by simple color equalization, which may bring about red over-saturation. Equation (6) is used to calculate the G-B channel of color equalization coefficient 𝜃-, 𝜃*, where M and
N are the spatial resolution of an image. Based on the coefficient 𝜃-, 𝜃*, the intensity
values of G-B channel can be corrected by multiplying 𝜃-, 𝜃*, respectively. Next, we
carry out dynamic histogram stretching for the image channels with the RGHS strategy.
3.2 Relative Global Histogram Stretching (RGHS)
The blind global histogram stretching usually uses the same parameters for all R-G-B channels of the images, ignoring the histogram distribution characteristics of different channels and in different images. When the fixed values (e.g., 0, 255) are applied in equation (4), it may over-stretch or under-stretch certain color channel and damage the details of the original image.
According to the propagation law of underwater light, we need to apply the contrast correction method to modify the distorted images. The histogram distribution rule of RGB channels on the following observation in shallow-water images: In most of shal-low-water images, the histogram of red light is focused in such values [50, 150], while G channel and B channel have the most of numerical concentrated in the range [70, 210]. This indicates that histogram stretching should be sensitive to channels.
To differentiate from the global histogram stretching in (4), we re-write the relative global histogram stretching equation in (7).
𝑝&:;= (𝑝'<− 𝐼='<) Z>?$!%)>$&'
$!%)?$&'[ + 𝑂='< (7) where 𝑝'< and 𝑝&:; are the input and output pixels, respectively, and 𝐼='<, 𝐼=+$ , 𝑂='<
and 𝑂=+$ are the adaptive parameters for the before and after stretching images,
re-spectively. In the next step, specifically, we will introduce the calculation of the stretch-ing range [𝐼='<, 𝐼@AB] and the desired range [O@CD, O@AB].
Adaptive parameter acquisition for the stretching range. From the histogram
dis-tribution of various shallow-water images, we can observe that the histogram distribu-tion of R-G-B channel similar to the variadistribu-tion of Rayleigh distribudistribu-tion defined as (8), which is a continuous probability distribution for positive-valued random variables.
𝑅𝐷 =+$(𝑒)$(⁄/+(
, 𝑥 ≥ 0, 𝑎 > 0 (8) where the scale parameter of the distribution 𝑎 is mode, the peak of R-G-B channel histograms. It should be noted that when the distribution of a channel shows a normal
distribution, its mode and its mid-point are almost the same. We take the mode value as a dividing line to separately decide the minimum (left) and maximum (right) inten-sity level values of the input image in the histogram stretching.
Because the underwater images are influenced by various factors, to reduce the im-pact of some extreme pixels on the relative global histogram stretching, it usually takes the stretching range between 0.1% and 99.9% of the histogram. However, if the histo-gram is not normally distributed, this method that removes an equal number of pixels from two tails of the histogram may not be reasonable. We split the upper and lower proportion of the intensity values to calculate the 𝐼='< and 𝐼=+$ for each R-G-B
chan-nel, which is showed in the equation (9).
𝐼='<= 𝑆. 𝑠𝑜𝑟𝑡[𝑆. 𝑠𝑜𝑟𝑡. 𝑖𝑛𝑑𝑒𝑥(𝑎) ∗ 0.1%]
𝐼=+$= 𝑆. 𝑠𝑜𝑟𝑡r−)𝑆. 𝑙𝑒𝑛𝑔𝑡ℎ − 𝑆. 𝑠𝑜𝑟𝑡. 𝑖𝑛𝑑𝑒𝑥(𝑎), ∗ 0.1%t (9)
where 𝑆 is the set of image pixel values for each R-G-B channel, 𝑆. 𝑠𝑜𝑟𝑡 is the sorted data set in an ascending order, 𝑆. 𝑠𝑜𝑟𝑡. 𝑖𝑛𝑑𝑒𝑥(𝑎) is the index number of the mode in the histogram distribution, and 𝑆. 𝑠𝑜𝑟𝑡[𝑥] represents the value in the index 𝑥 of posi-tive-sorted data set. Equation (9) means that from the peak division line, we separate the pixels which values are in the smallest 0.1% of the total number on the left side and the biggest 0.1% of the total number on the right side from the histogram distribution to perform the special method. For different images and RGB channels of the Rayleigh distributions, the 𝐼='< and 𝐼=+$ are both image- and channel-sensitive.
Adaptive parameter acquisition for the stretching range. For the underwater
im-ages, global histogram stretching with a range of [0, 255] often brings excessive blue-green illumination. In order to achieve an optimal desired range of stretching, we dy-namically determine the minimum (𝑂='<) and maximum (𝑂=+$) intensity level values
for each R-G-B channels.
We first calculate the standard deviation values of the Rayleigh distribution 𝜎! ,
shown in (10).
σ!= wF)G/ 𝑎! = 0.655 𝑎! , 𝜆 ∈ {𝑅, 𝐺, 𝐵} (10)
where 𝜆 ∈ {𝑅, 𝐺, 𝐵} indicates the R, G, B channel, 𝑎 is the mode in a channel. Then, we define the minimum value of the desired range 𝑂! ='< as (11).
𝑂! ='<= 𝑎!− 𝛽!∗ 𝜎! , 0 ≤ 𝑂! ='<≤ 𝐼! ='< (11)
Here, 𝛽! can be derived from (11) and substitute 𝜎!with (10).
𝛽!=+))>I) $&' ) , +))?$&' J) ≤ 𝛽!≤ +) J) (12)
On the right of equation (12), as 𝑎 ≥ 𝐼='<, we can get 0 ≤ 𝛽!. Substitute (10) into
the right of equation (12), we can get 𝛽!≤ 1.526. Define 𝛽!∈ 𝑍, then 𝛽! has a unique
𝑂! ='<= 𝑎!− 𝜎! (13)
For the maximum parameters of the desired range, because of different degrees of attenuation of the different light bands in the water, we must take separate analysis of RGB channels to calculate. According to the simplified fuzzy imaging model (1), the haze-free image 𝐽!(𝑥) can be recovered by (14).
𝐽!(𝑥) = ?)($)) K.);M ; )($)L9)
)($) (14)
Where κ= 1.1 and κ= 0.9 are an experiential value for red channel and green-blue channel respectively. The maximum value of the desired range 𝑂=+$ can be achieved
when maximizing the recovered image 𝐽!(𝑥), as represented in (15).
𝑀𝑎𝑥((𝐽!(𝑥)) = 𝑀𝑎𝑥 (?)($)) K.);N ; )($)L9)
)($) ) (15)
When 𝐽!(𝑥) achieves the maximum value, 𝐵! is 0. Then, 𝑂=+$ for different color
channel can be defined as (16). 𝑂! =+$=N ;?)
)=
+)OP)∗I)
N∗ ;) , 𝐼!=+$≤ 𝑂! =+$≤ 255 (16)
Here, 𝑡!(𝑥) is measured using equation (2) with the 𝑁𝑟𝑒𝑟(𝜆) values of 0.83, 0.95,
0.97 for R, G, B channels respectively (see also equation (3)), and 𝑑(𝑥) is set to 3 as the estimation distance between the scene and the camera. 𝐼! is a value on the right of
the mode in the channel histogram, and can be represented as 𝑎!+ 𝜇!∗ 𝜎! .
Based on the range value of 𝑂! =+$, the coefficient 𝜇! meets the inequity (17).
𝜇!= 𝜅 ∗ 𝑡!∗ 𝑂! =+$− 𝑎! 𝜎! M ∗;) ∗ ?) J) ≤ 𝜇!+ 1.526 ≤ M ∗;) ∗ /00 J) (17)
In (17), 𝜇! will has no solution or limited solutions in integer field. When µQ has
multiple solutions, we chose the average value of their solutions; when µQhas no
solu-tion, we simply set the OQ @AB to 255. These adaptive parameters obtained based on the
histogram distributions of different channels can effectively improve the contrast of the stretched image, preserve the details and simultaneously reduce noise.
3.3 Adaptive-stretching in CIE-Lab Color Model
After the contrast correction in RGB color model, the image will undergo the color correction process. In this process, the underwater image is converted into CIE-Lab color model to improve color performance. In the CIE-Lab color model, ‘L’ compo-nent, which is equivalent to the image lightness, represents the brightest value at L = 100 and the darkest value at L= 0. When a = 0 and b = 0, the color channel will present true neutral gray values. Hence, the output color gradations of ‘a’ and ‘b’ components are modified to acquire color correction accurately, meanwhile, ‘L’ component is used
to adjust the brightness of the entire image. Firstly, the shallow-water image in the CIE-Lab color model is decomposed into respective channels.
The ‘L’ component is applied with linear slide stretching, given by (8), which range between 0.1% and 99.9% is stretched to range [0, 100]. The 0.1% of the lower and upper values in the image are set to 0 and 100 respectively.
The ‘a’ and ‘b’ components are in the range of [−128, 127], of which 0 is the me-dian value. The stretching of ‘a’ and ‘b’ is defined as an S-model curve (18).
𝑝R= 𝐼R∗ (𝜑 .)S-(.+,S
) , 𝜒 ∈ {𝑎, 𝑏} (18) Where 𝐼R and 𝑝R represents the input and output pixels, respectively, 𝜒 ∈ {𝑎, 𝑏}
indi-cates the ‘a’ and ‘b’ components, 𝜑 is optimally-experimental value, set to 1.3 in the method. Equation (18) uses an exponential function as the stretching coefficient, whereby the closer the values to 0, the further they will be stretched.
Color and brightness in an image are the important parameters of clearness and vis-ibility. Therefore, the objects in the image can be clearly differentiated from the back-ground. After the adaptive-stretching process of ‘L’, ‘a’ and ‘b’ components in the CIE-Lab color model, the channels are then composed and converted back into the RGB color model. A contrast-enhanced and color-corrected output image can be generated as the perceivable and visible final output image.
4
Result and Discussion
Our proposed method characterized by contrast improvement, saturation equalization and brightness enhancement is compared with three traditional image enhancement methods qualitatively and quantitatively. Single image haze removal using dark chan-nel prior by He [5] used in comparison as it is the classic technique for dehazing and the underwater image is often considered as haze image. The other comparison methods are ICM and UCM [9, 10] because they are the effective non-physical method and are most similar to the proposed method in terms of histogram modification. Because of failing to run out of the algorithm of Rayleigh distribution in [11, 18,19], in the com-parison results, we only present the UCM images because the ICM has similar results to the UCM. In Fig. 3, our proposed method, apparently, generates better visual image than the other method. The overall perception of fishes produced by He’s model has slight changes which cannot improve the quality of the image and even lowers the vis-ibility and contrast. The UCM over-saturates the image color as the blue-green color of this image appears prominent and lead in the noise, reducing the visual effect of the entire image. The result image produced in our method presents the better contrast and color saturation as the fishers are differentiated from the background which are im-proved and less blue-green illumination retained. In the second row of the Fig. 3, the x-axis of the histogram (original and enhanced images) ranges from 0 to 255. The gray-level histogram distributions of (a) and (b) are comparatively concentrated, used to ex-plain the low contrast and visibility of two colorful images. The gray-level histogram of (c) and (d) are distributed in the whole range, but on the basis of the Gray-World
(GW) assumption theory [21], the histogram of enhanced image (d) is more superior in the distribution by the precise histogram stretching.
(a) (b) (c) (d)
Fig. 3.(a) Original image; (b) DCP; (c) UCM; (d) Our proposed model; enhanced images on the top and their corresponding gray-level histogram distributions on the bottom
Different methods for underwater image enhancement achieve the result images, showing in the Fig. 4. Obviously, the DCP fails to enhance the shallow-water image. In the first two rows of Fig. 4, The UCM over-saturates the image color as the blue-green color of the image becomes too bright and the enhanced images are not as natural as those of our method. In the last two rows of Fig. 4, the result images of the UCM exist distinct noise but our method successfully removes the noise and preserves the image details.
(a) (b) (c) (d)
Fig. 4.(a) Original images extracted from YouTube Website with a size 𝟔𝟎𝟎 × 𝟒𝟎𝟎; (b) DCP; (c) UCM; (d) Our proposed model
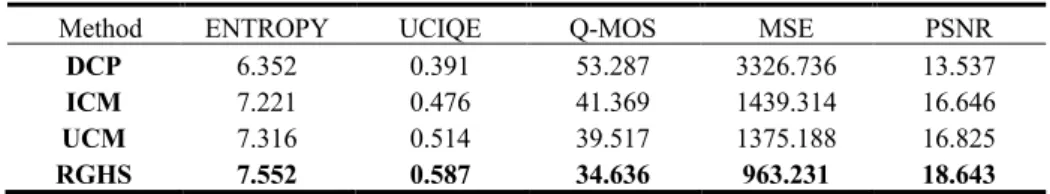
We conduct quantitative analysis, with objective metrics including entropy, under-water color image-quality evaluation (UCIQE) [13], High-Dynamic Range Visual Dif-ference Predictor2 (HDR-VDP2) [14], mean square error (MSE) and peak signal noise ratio (PSNR) [15]. The UCIQE is very recent non-reference model for underwater color image quality assessment, which is the aggregative indicator of chroma, saturation, and contrast. Entropy represents the abundance of information, which is interpreted as the average uncertainty of information source. The higher the entropy value is, the more information contains. The HDR-VDP2 uses a fairly advanced model of human percep-tion to predict both visibility of artifacts and overall quality in images. It produces Q-MOS value to indicate the image quality from 0 (best) to 100(worst). MSE and PSNR are conventional metrics in image quality assessment, mainly measuring the noise deg-radation of image. Although the Q-MOS, MSE and PSNR are full-reference metrics, using the original underwater image as the reference image, they are useful to indicate the human perceived quality loss and the noise increase of the produced image from the original. Table 1 shows the comparison results in terms of the five assessment models.
Table 1. Quantitative analysis in terms of ENTROPY, UCIQE, Q-MOS, MSE and PSNR.
Our proposed method gains the best results (show in the bold) in the evaluations. It preserves the most information and details, achieves the great visibility and overall high quality and eliminates the noise. The maximum UCIQE value means that our method can effectively balance chroma, saturation, and contrast of the enhanced underwater images. The DCP produces the worst performance in four methods, which is in accord-ance with the visual observation of low contrast and visibility. It means that simple haze removal with the dark channel prior cannot be directly used for underwater enhance-ment. The ICM and UCM produce the method images with obvious noise, which causes high value of MSE and low value of PSNR. To sum up, the results show that our method can produce the high-quality shallow-water images and is superior to widely-accepted underwater image enhancement models.
5
Conclusion
In this paper, we have explored the issues related to shallow-water images and existing underwater image enhancement methods, and successfully proposed a new image en-hancement method RGHS for different shallow-water images. Our proposed method firstly performs contrast correction based on simple histogram stretching with dynamic parameters acquisition in RGB color model, which takes into account both the histo-gram distribution feature of the raw image and underwater transmission properties of different light channels. Then, adaptive-stretching in CIE-Lab color model is conducted
Method ENTROPY UCIQE Q-MOS MSE PSNR
DCP 6.352 0.391 53.287 3326.736 13.537
ICM 7.221 0.476 41.369 1439.314 16.646
UCM 7.316 0.514 39.517 1375.188 16.825
for color correction. Our proposed method was compared with the typical haze removal model DCP, and the underwater image enhancement model ICM and UCM which are based on histogram stretching in the RGB and HSV/HSI color models. Qualitative and quantitative results proof that our method is more effective to enhance the visibility, improve details and not to increase artifacts and noise of shallow-water image. The integration of histogram redistribution in the RGB and CIE-Lab color model can be used in other underwater image research. However, our proposed method is limited in the shallow-water image enhancement, which ignores the energy attenuation along propagation path between the surface and the scene and failing to compensate the seri-ous-distorted channel in deeper-water image. In fact, many underwater image enhance-ment methods are not tested with the images from deep ocean below 1000m. With the reasonable combination of the properties and the degraded physical model of image, we will improve the algorithm to be suitable for different kinds of underwater images.
Acknowledgment. This work was supported by the Program for Professor of Special
Appointment (Eastern Scholar) at Shanghai Institutions of Higher Learning No. TP2016038, the National Natural Science Foundation of China (NSFC) Grant 61702323, and the Doctoral Research Startup Fund of Shanghai Ocean University A2-0203-17-100322.
References
1. Sahu, P., Gupta, N., Sharma, N.: A Survey on Underwater Image Enhancement Techniques. Int. J. Comput. Appl. 87(13), 19–23 (2014)
2. Zaneveld, J.R.V., Pegau, W.S.: Robust underwater visibility parameter. Opt. Express.
11(23), 2997–3009 (2003)
3. Schettini, R., Corchs, S.: Underwater Image Processing: State of the Art of Restoration and Image Enhancement Methods. EURASIP J. Adv. Signal Process. 2010(1), 746052 (2010) 4. Zhao, X., Jin, T., Qu, S.: Deriving inherent optical properties from background color and
underwater image enhancement. Ocean Eng. 94, 163–172 (2015)
5. He, K., Sun, J., Tang, X.: Single Image Haze Removal Using Dark Channel Prior. IEEE Trans. Pattern Anal. Mach. Intell. 33(12), 2341–2353 (2011)
6. Galdran,A., Pardo,D., Picón, A., Alvarez-Gila,A.: Automatic Red-Channel underwater im-age restoration. J. Vis. Commun. Imim-age Represent. 26, 132–145 (2015)
7. Drews, P., Nascimento, E., Moraes, F., Botelho, S., Campos, M.: Transmission Estimation in Underwater Single Images. In: Proceedings of the IEEE International Conference on Computer Vision Workshops. 825–830 (2013)
8. Chiang, J.Y. Chen, Y.C.: Underwater Image Enhancement by Wavelength Compensation and Dehazing. IEEE Trans. Image Process. 21(4), 1756–1769 (2012)
9. Iqbal,K., Abdul Salam, R., Osman, M.A. Talib, A.Z.: Underwater Image Enhancement Us-ing An Integrated Colour Model. IAENG Int. J. Comput. Sci. 32(2), 239–244 (2007) 10. Iqbal, K., Odetayo, M., James, A., Salam, R.A., Talib, A.Z.H.: Enhancing the low quality
images using Unsupervised Colour Correction Method. In: 2010 IEEE International Confer-ence on Systems, Man and Cybernetics. 1703–1709 (2010)
11. Ghani, A.S.A., Isa, N.A.M.: Underwater image quality enhancement through integrated color model with Rayleigh distribution. Appl. Soft Comput. 27, 219–230 (2015)
12. Schechner, Y.Y., Karpel, N.: Recovery of underwater visibility and structure by polarization analysis. IEEE J. Ocean. Eng. 30(3), 570–587 (2005)
13. Yang, M., Sowmya, A.: An Underwater Color Image Quality Evaluation Metric. IEEE Trans. Image Process. 24(12), 6062–6071 (2015)
14. Mantiuk, R., Kim, K.J., Rempel, A.G., Heidrich, W.: HDR-VDP-2: A Calibrated Visual Metric for Visibility and Quality Predictions in All Luminance Conditions. In: ACM SIGGRAPH 2011 Papers, New York, NY, USA. 40, 1–14 (2011)
15. Hitam, M.S., Awalludin, E.A., Yussof, W.N.J.H.W., Bachok, Z.: Mixture contrast limited adaptive histogram equalization for underwater image enhancement. In: 2013 International Conference on Computer Applications Technology (ICCAT). 1–5 (2013)
16. Schechner, Y.Y., Narasimhan, S. G., Nayar, S.K.: Instant dehazing of images using polari-zation. In: Proceedings of the 2001 IEEE Computer Society Conference on Computer Vision and Pattern Recognition (CVPR). 325–332 (2001)
17. Narasimhan, S.G., Nayar, S.K.: Vision and the Atmosphere. Int. J. Comput. Vis. 48(3), 233– 254 (2002)
18. Ghani, A.S.A., Isa, N.A.M.: Underwater image quality enhancement through Rayleigh-stretching and averaging image planes. Int. J. Nav. Archit. Ocean Eng. 6(4), 840–866 (2014) 19. Ghani, A.S.A., Isa, N.A.M.: Enhancement of low quality underwater image through
inte-grated global and local contrast correction, Appl. Soft Comput. 37, 332–344 (2015). 20. Paris, S., Durand, F.: A Fast Approximation of the Bilateral Filter Using a Signal Processing
Approach. In: Computer Vision – ECCV 2006. 568–580 (2006)
21. Chambah, M., Semani, D., Renouf, A., Courtellemont, P., Rizzi, A.: Underwater color con-stancy: enhancement of automatic live fish recognition. In: Color Imaging IX: Processing, Hardcopy, and Applications. 5293, 157–168 (2003)