Supporting Information
Sequential Multiple-Target Sensor: In
3+, Fe
2+and
Fe
3+Discrimination by an Anthracene-Based Probe
Alba Finelli
†, Valentin Chabert
†, Nelly Hérault
†, Aurélien Crochet
‡, Cheal Kim
#,
Katharina M. Fromm
*
,†† Department of Chemistry, University of Fribourg, Ch. du Musée 9, 1700 Fribourg, Switzerland ‡ FriMat,Department of Chemistry, University of Fribourg, Ch. du Musée 9, 1700 Fribourg, Switzerland #Department of Fine Chemistry, Seoul National University of Science and Technology (SeoulTech), Seoul
139-743, Republic of Korea
Table of Contents
General
. . . 2
NMR Spectra of S1’ and S1
. . . 2
Fe
2+and Fe
3+Oxidation Test
. . . 4
UV-Vis Titration of sensor S1
. . . 5
ESI mass analysis for Fe
3+complex
. . . 6
NMR Titration of the Probe S1 with Fe
3+and Fe
2+. . . 7
Detection limit of Fe
2+and Fe
3+. . . 8
Fluorescent Titration of sensor S1
. . . 10
Detection limit of In
3+. . . 12
ESI mass analysis for In
3+complex
. . . 13
Fluorescence emission spectrum of InS1 complex in CHCl
3/MeOH
. . . 14
NMR Titration of the Probe S1 with In
3+. . . 15
Competition Experiments
. . . 17
UV-Vis sensor S1 with Cu
2+. . . 20
General
All chemicals were commercial products of reagent grade and were used without further purification. 1H and 13C NMR measurements were carried out with a Bruker 400 MHz
spectrometer at ambient temperature, and chemical shifts are given in ppm with respect to the residual solvent peak. Mass spectra (ESI-TOF, positive mode) were recorded with a Bruker esquire HCT spectrometer with a DMF/ACN mixture as solvent. The UV-vis spectra were recorded with a Perkin–Elmer Lambda 40 spectrometer. The crystallographic data of single crystals were collected with Mo-Kα radiation (λ = 0.71073 Å). All measurements were performed at 200 K, with
Stoe IPDS-II or IPDS-II T diffractometers equipped with Oxford Cryosystem open-flow cryostats. Single crystals were picked under the microscope, and placed in inert oil. All crystals were mounted on loops and all geometric and intensity data were taken from one single crystal. The absorption corrections were partially integrated in the data reduction procedure. The structures were solved and refined using full-matrix least-squares on F2 with the SHELX-2014 package. All
atoms (except hydrogen atoms) were refined anisotropically. Hydrogen atoms were refined where possible, and otherwise added using the riding model position parameters.
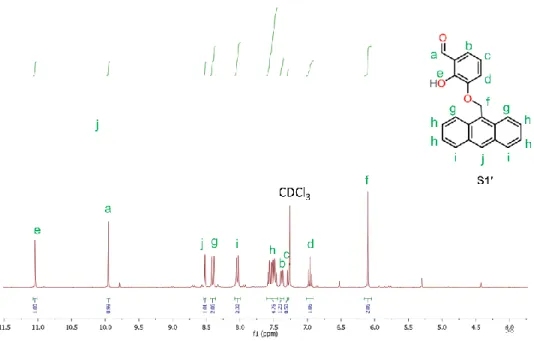
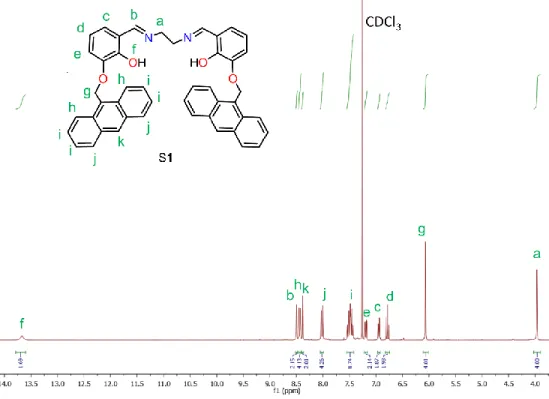
NMR Spectra of S1’ and S1
Figure S1: 1H NMR spectrum of the precursor S1’ in CDCl 3.
Figure S2: 1H NMR spectrum of the anthracene-based ligand S1 in CDCl 3.
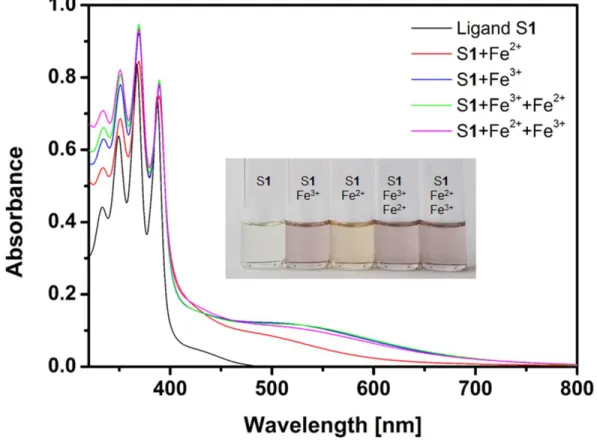
Fe
2+and Fe
3+Oxidation Test
Figure S3: UV-Vis spectra of S1 (40 µM) solutions containing Fe2+ and/or Fe3+ salts under
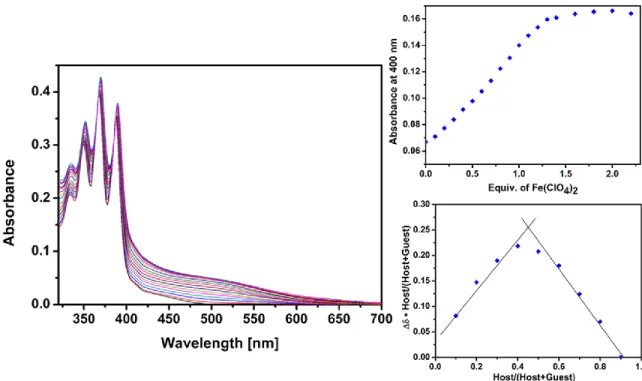
UV-Vis Titration of sensor S1
Figure S4: Titration of ligand S1 (40 µM) with Fe(NO3)3, the corresponding binding isotherm
curve and the Job Plot.
Figure S5: Titration of ligand S1 (40 µM) with Fe(ClO4)2, the corresponding binding isotherm
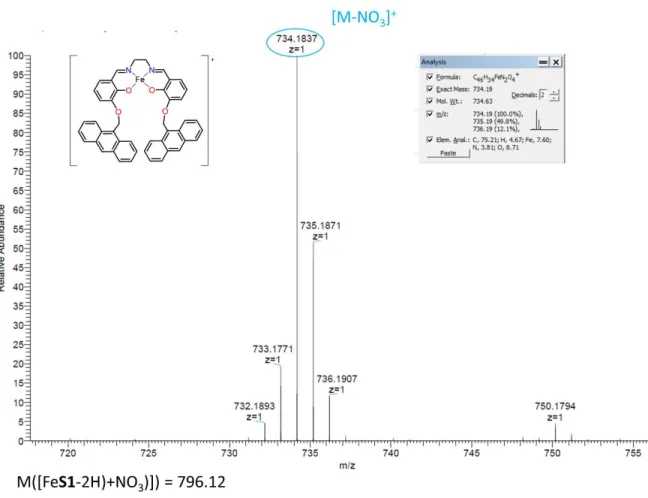
ESI mass analysis for Fe
3+complex
NMR Titration of the Probe S1 with Fe
3+and Fe
2+Figure S7: NMR titration of the ligand S1 (1mM) with Fe(NO3)3 in DMSO.
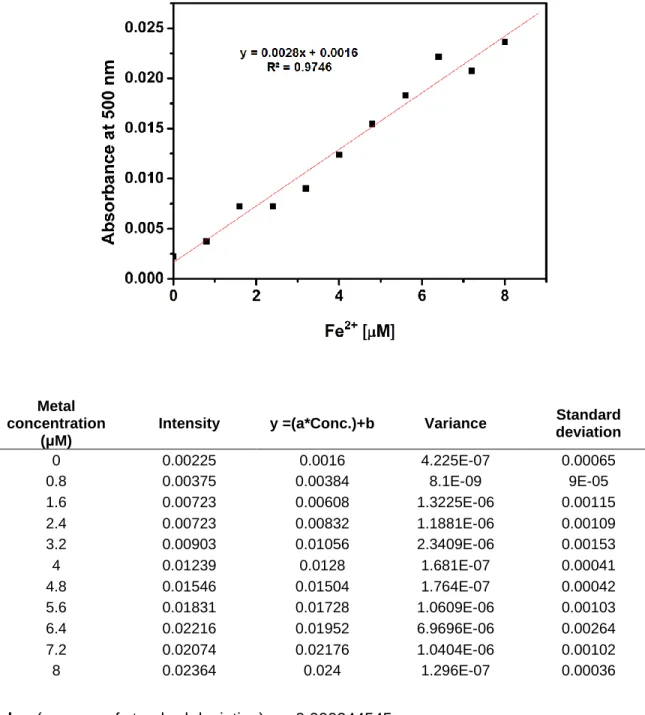
-Detection limit of Fe
2+and Fe
3+Metal concentration
(μM)
Intensity y =(a*Conc.)+b Variance Standard
deviation 0 0.00225 0.0016 4.225E-07 0.00065 0.8 0.00375 0.00384 8.1E-09 9E-05 1.6 0.00723 0.00608 1.3225E-06 0.00115 2.4 0.00723 0.00832 1.1881E-06 0.00109 3.2 0.00903 0.01056 2.3409E-06 0.00153 4 0.01239 0.0128 1.681E-07 0.00041 4.8 0.01546 0.01504 1.764E-07 0.00042 5.6 0.01831 0.01728 1.0609E-06 0.00103 6.4 0.02216 0.01952 6.9696E-06 0.00264 7.2 0.02074 0.02176 1.0404E-06 0.00102 8 0.02364 0.024 1.296E-07 0.00036
σ Value (average of standard deviation): 0.000944545
L.O.D ((3*σ)/a): 0.69113082 μM
Figure S9: Standard deviations and linear fitting for detection limit calculations of S1 (40 µM) +
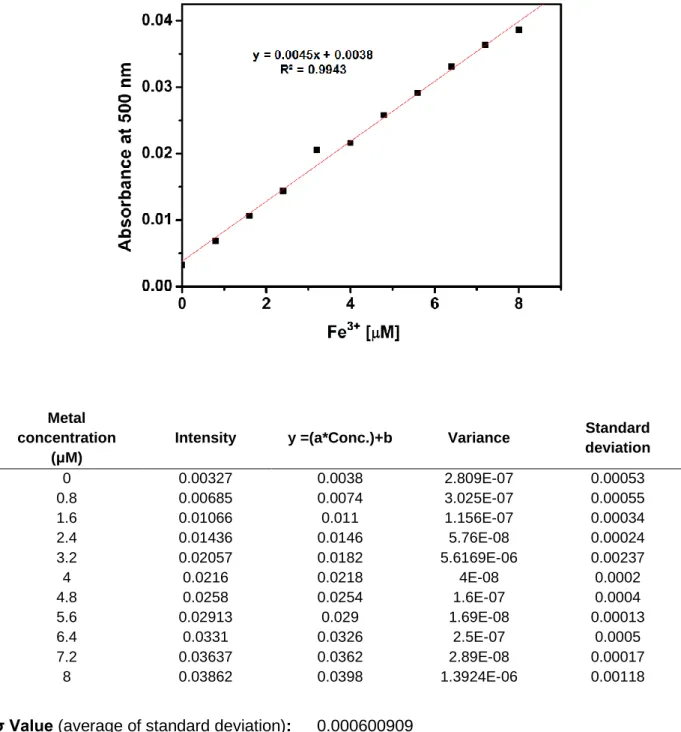
σ Value (average of standard deviation): 0.000600909
L.O.D ((3*σ)/a): 0.439689579μM
Figure S10: Standard deviations and linear fitting for detection limit calculations of S1 (40 µM) +
Fe3+.
Metal concentration
(μM)
Intensity y =(a*Conc.)+b Variance Standard
deviation 0 0.00327 0.0038 2.809E-07 0.00053 0.8 0.00685 0.0074 3.025E-07 0.00055 1.6 0.01066 0.011 1.156E-07 0.00034 2.4 0.01436 0.0146 5.76E-08 0.00024 3.2 0.02057 0.0182 5.6169E-06 0.00237 4 0.0216 0.0218 4E-08 0.0002 4.8 0.0258 0.0254 1.6E-07 0.0004 5.6 0.02913 0.029 1.69E-08 0.00013 6.4 0.0331 0.0326 2.5E-07 0.0005 7.2 0.03637 0.0362 2.89E-08 0.00017 8 0.03862 0.0398 1.3924E-06 0.00118
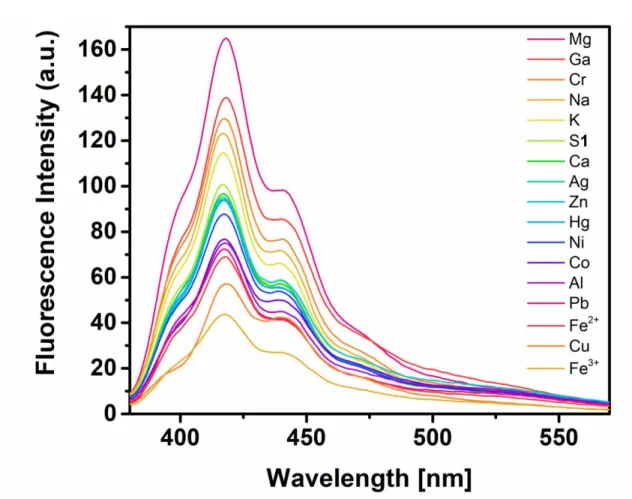
Fluorescent Titration of sensor S1
Figure S11: Fluorescence intensity variation depending on the metal ion used. The
fluores-cence emission spectra (λex = 365 nm) of S1 (40 µM in DMF) were obtained after the addition of
1.2 equiv. of different metal ions (Ag+, Al3+, Ga3+, Zn2+, Cu2+, Mg2+, Cr3+, Co2+, Ni2+, Na+, K+, Ca2+
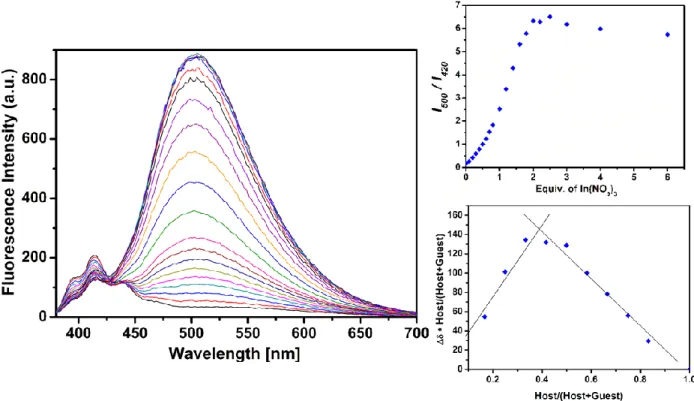
Figure S12: Titration of ligand S1 (40 µM) with In(NO3)3, the corresponding binding isotherm
Detection limit of In
3+Metal concentration
(μM)
Intensity y =(a*Conc.)+b Variance Standard
deviation 0 34.57075119 28.998 31.05555583 5.57275119 0.8 41.38391495 40.558 0.682135505 0.82591495 1.6 50.03685379 52.118 4.331169547 2.08114621 2.4 60.7942009 63.678 8.316297249 2.8837991 3.2 72.40631866 75.238 8.018419211 2.83168134 4 85.26144409 86.798 2.361004065 1.53655591 4.8 94.96090698 98.358 11.54024099 3.39709302 5.6 111.2199631 109.918 1.695107914 1.3019631 6.4 124.4255447 121.478 8.688019758 2.9475447 7.2 135.1032257 133.038 4.265157192 2.0652257
σ Value (average of standard deviation): 2.544367522
L.O.D ((3*σ)/a): 0.528242392 μM
Figure S13: Standard deviations and linear fitting for detection limit calculations of S1 (40 µM) +
ESI mass analysis for In
3+complex
Fluorescence emission spectrum of InS1 complex in CHCl
3/MeOH
Figure S15: Fluorescence emission spectrum (λex = 365 nm) of S1 (40 µM) in CHCl3 in
NMR Titration of the Probe S1 with In
3+Figure S16: 1H NMR spectrum of the In3+-S1 complex in CDCl 3.
Competition Experiments
Figure S18: UV-Vis spectra of S1 solutions (40 µM) containing equimolar concentrations (48 M)
Figure S19: UV-Vis spectra of S1 solutions (40 µM) containing equimolar concentrations (48 M)
Figure S20: UV-Vis spectra of S1 solutions (40 µM) containing equimolar concentrations (88 M)
UV-Vis sensor S1 with Cu
2+Figure S21: Titration of ligand S1 (40 µM) with Cu(NO3)2, the corresponding binding isotherm
Crystallography
Figure S22: Crystal structure of anthracene-based aldehyde S1’, all H-atoms are omitted for
Sensor S1
Sensor S1 crystallized in the orthorhombic Pccn space group (N°56), as yellow block-like crystals by slow evaporation in DCM. Completely symmetric, the external anthracene moieties are nearly perpendicular to the benzene ring planes with an angle of 85.09°. The two side arms of the sensor are repelled to each other in an anti-parallel arrangement with an angle of 70.36° due to the steric hindrance of the two chromophores. This arrangement is stabilized by the H-bond between the alcohol group protons H1 and the N-atom, N1, with a distance of 1.947 Å. While C21 ̶ π, π ̶ C1#4 and C18 ̶ C13#4 interactions (3.431 Å, 3.792 Å and 3.632 Å, respectively) allows an expansion of the structure into the direction of the c-axis, a growth along the a-axis is governed by the C20 ̶ C9#6 contact (3.342 Å).
Figure S23: Crystal structure of sensor S1 (#2(1/2x, ½y, z), #3(x, ½y, 1/2+z), #4(1/2x, y,
Complex Cu
2+-S1
Cu2+-S1 crystallized in a monoclinic space group C2/c (N° 15) in red plate-like crystals by slow
diffusion of diethyl ether in a solution of the complex in THF. The Cu2+ cation occupied the N 2O2
chelating site of the ligand S1 in a quasi-perfect square planar fashion, formed by the phenolate moieties and imine groups. Having an average bond valence sum of 1.99 provided by the N2O2
cavity of the sensor, Cu2+ does not need to complete its coordination sphere using additional
solvent or anions entities. The angle sum around the metal ions within the recognition moiety is 360.85°, indicating the approximate planarity of this coordination. Compared to the precedent structure, the structure of one side arm of the complex is almost preserved with an angle of 79.40° between the extern anthracene moiety and the plane formed by the di-oxo-benzene ring. For the other extremity of the compound, the anthracene moiety meets practically face to face the benzene ring with an angle of 64.44° stabilized by C32 ̶ π and C10 ̶ C33 interactions (3.584 Å and 3.534 Å, respectively) inducing a slight distortion of the planarity of the N2O2 coordination of
20.03° based on the aromatic ring planes. The bond between the ether O-atom and the carbon (C15 ̶ O1) of the distorted side, connecting the benzene core to the anthracene moiety, was observed to be shorter than in the regular side (C32 ̶ O4) with a distance of 115.66 Å and 117.17 Å, respectively. The crystal packing reveals that the probe S1 is packed to each other along the
c-axis in an anti-parallel layer like assembly by C15 ̶ C13#2 interactions (3.387 Å) from the regular
anthracene groups and by C22 ̶ C38#3 contacts (3.371 Å) from the distorted anthracene moieties along the a-axis.
Figure S24: Crystal structure of the complex Cu2+-S1 (#2(1-x, 1-y, 1-z), #3(x, 2-y, 1/2+z)), all
Table S1: Crystallographic data.
S1’ S1 Cu2+-S1
Formula C22H16O3 C46H36N2O4 C46H34CuN2O4
Mw 328.35 680.77 742.29
T [K] 140 140 200
Lattice Triclinic Orthorhombic Monoclinic
Space group P-1 Pccn C2/c a [Å] 10.2229(6) 6.5460(10) 31.106(2) b [Å] 17.9147(9) 45.378 (11) 12.6818(7) c [Å] 18.2447(11) 11.5025(15) 22.0348(13) α [°] 78.197(5) 90 90 β [°] 89.633(5) 90 125.843(4) γ [°] 89.552(4) 90 90 V [Å3] 3270.6(3) 3416.7(11) 7046.2(8) Z 8 4 8 dcalc [g cm-3] 1.334 1.323 1.399 R1/ wR2 [I>2sigma(I)] 0.0723/ 0.1963 0.1251/ 0.2762 0.0686/0.1523