HAL Id: hal-00330343
https://hal.archives-ouvertes.fr/hal-00330343
Submitted on 14 Oct 2008
HAL is a multi-disciplinary open access
archive for the deposit and dissemination of
sci-entific research documents, whether they are
pub-lished or not. The documents may come from
teaching and research institutions in France or
abroad, or from public or private research centers.
L’archive ouverte pluridisciplinaire HAL, est
destinée au dépôt et à la diffusion de documents
scientifiques de niveau recherche, publiés ou non,
émanant des établissements d’enseignement et de
recherche français ou étrangers, des laboratoires
publics ou privés.
Southeast Pacific (BIOSOPE cruise)
Sophie Bonnet, C. Guieu, F. Bruyant, O. Prášil, France van Wambeke,
Patrick Raimbault, T. Moutin, C. Grob, M. Y. Gorbunov, J. P. Zehr, et al.
To cite this version:
Sophie Bonnet, C. Guieu, F. Bruyant, O. Prášil, France van Wambeke, et al.. Nutrient limitation
of primary productivity in the Southeast Pacific (BIOSOPE cruise). Biogeosciences, European
Geo-sciences Union, 2008, 5 (1), pp.215-225. �hal-00330343�
www.biogeosciences.net/5/215/2008/ © Author(s) 2008. This work is licensed under a Creative Commons License.
Biogeosciences
Nutrient limitation of primary productivity in the Southeast Pacific
(BIOSOPE cruise)
S. Bonnet1, C. Guieu1, F. Bruyant2, O. Pr´aˇsil3, F. Van Wambeke4, P. Raimbault4, T. Moutin4, C. Grob1, M. Y. Gorbunov5, J. P. Zehr6, S. M. Masquelier7, L. Garczarek7, and H. Claustre1
1Laboratoire d’Oc´eanographie de Villefranche, UMR 7093, CNRS and Universit´e Pierre et Marie Curie, BP 08 06238
Villefranche sur mer Cedex, France
2Dalhousie University–Department of Oceanography, 1355 Oxford Street Halifax, NS, B3H 4J1, Canada
3Institute of Microbiology ASCR, Opatovick´y ml´yn, 37981 Trebon and University of South Bohemia, Z´amek, 37333 Nov´e
Hrady, Czech Republic
4Centre d’Oc´eanologie de Marseille - Campus de Luminy, 13288 Marseille Cedex 09, France
5Rutgers University, Institute of marine and Costal Sciences, 71 Dudley road, New Brunswick, N. J. 08901-8521, USA 6University of California Santa Cruz, Ocean Sciences Department, 1156 high street, Santa Cruz, CA 95064, USA
7Station Biologique de Roscoff, UMR 7144, CNRS and Univ. Pierre et Marie Curie, BP 74, 29682 Roscoff Cedex, France
Received: 2 July 2007 – Published in Biogeosciences Discuss.: 9 August 2007
Revised: 19 November 2007 – Accepted: 11 January 2008 – Published: 20 February 2008
Abstract. Iron is an essential nutrient involved in a variety of biological processes in the ocean, including photosynthe-sis, respiration and dinitrogen fixation. Atmospheric depo-sition of aerosols is recognized as the main source of iron for the surface ocean. In high nutrient, low chlorophyll ar-eas, it is now clearly established that iron limits phytoplank-ton productivity but its biogeochemical role in low nutrient, low chlorophyll environments has been poorly studied. We investigated this question in the unexplored southeast Pa-cific, arguably the most oligotrophic area of the global ocean. Situated far from any continental aerosol source, the atmo-spheric iron flux to this province is amongst the lowest of the world ocean. Here we report that, despite low dissolved iron concentrations (∼0.1 nmol l−1) across the whole gyre (3 stations located in the center and at the western and the eastern edges), primary productivity are only limited by iron availability at the border of the gyre, but not in the center. The seasonal stability of the gyre has apparently allowed for the development of populations acclimated to these extreme oligotrophic conditions. Moreover, despite clear evidence of nitrogen limitation in the central gyre, we were unable to measure dinitrogen fixation in our experiments, even af-ter iron and/or phosphate additions, and cyanobacaf-terial nif H gene abundances were extremely low compared to the North Pacific Gyre. The South Pacific gyre is therefore unique with respect to the physiological status of its phytoplankton pop-ulations.
Correspondence to: S. Bonnet (sbonnet@usc.edu)
1 Introduction
The production of organic matter in the sea is sustained by a continuous supply of essential macro- (C, N, P) and mi-cronutrients (metals, vitamins). The nutrients requirements vary among different phytoplanktonic species. According to the Liebig’s law, organic matter production is controlled by the element that is available in the lowest concentration rel-ative to the growth requirements. This simple view is now replaced by the realization that multiple resources simultane-ously limit phytoplankton growth in some parts of the ocean (Arrigo, 2005). Global environmental forcings, including human-induced climate change, could potentially modify the nutrient delivery processes to the ocean, leading to funda-mental changes in the diversity and functioning of the ma-rine food web. It is thus fundamental to understand which nutrients control primary productivity in the open ocean to predict the biogeochemical consequences of global change. Representing 60% of the global ocean’s area, the subtropi-cal open-ocean ecosystems are the largest coherent biomes on our planet, and the biogeochemical processes they sup-port are of global imsup-portance (Emerson et al., 1997; Karl, 2002). The development of permanent time series stations in the North tropical Atlantic and Pacific over the past two decades have led to a revolution in the understanding of the mechanisms and controls of nutrient dynamics in these re-mote environments. These oceanic gyres provide ideal eco-logical niche for the development of nitrogen-fixing organ-isms (e.g. Karl et al., 2002). In the North subtropical and tropical Atlantic and Pacific oceans, it has been estimated that dinitrogen fixation is equivalent to 50–180% of the flux
a 1 2 3 4 6 7 12 13 15 14 b
Fig. 1. (a) Transect of the BIOSOPE cruise from the Marquesas
Is-lands to Chile superimposed on a SeaWiFS surface Chl-a compos-ite image (November–December 2004), and location of the short (numbers) and long-stations of the cruise (MAR, HNL, GYR, EGY, UPW, UPX). This study reports results of bioassay experiments per-formed at stations HNL, GYR and EGY. (b) Dissolved iron
concen-trations (0–400 m) (nmol l−1)along the BIOSOPE transect from
Marquesas Islands (left) to Chile (right).
of NO−3 into the euphotic zone (Karl et al., 1997; Capone et al., 2005), demonstrating that a large part of new primary productivity is fuelled by N2 fixation, rather than NO−3 dif-fusing from deeper layer into the euphotic zone. Dinitrogen fixation requires the iron-rich nitrogenase complex, there-fore N2-fixing organisms have high iron (Fe) requirements
compared to phytoplankton growing on nitrate or ammonium (Raven, 1988; Kustka et al., 2003). Dinitrogen fixation in oceanic gyres has been seen to be controlled by Fe avail-ability, as well as phosphate, which can (co)limit the process (Sanudo-Wilhelmy et al., 2001; Mills et al., 2004). However, all studies dedicated to the nutrient control of primary pro-ductivity and dinitrogen fixation have focused so far on the Northern Hemisphere and there are few data available in the Southern Hemisphere.
The South Pacific gyre, which is the largest oceanic gyre of the global ocean, had been particularly undersampled (Claus-tre et al. see introduction of this issue). This unique environ-ment appears from satellite imagery and ocean colour to have the lowest chlorophyll-a (Chl-a) concentrations of the global ocean and thus represents an end-member of oceanic hyper-oligotrophic conditions (Claustre and Maritorena, 2003). In contrast to the oceanic gyres located in the Northern Hemi-sphere, the South Pacific Gyre is far removed from any con-tinental source (anthropogenic and natural desert aerosols) and receives amongst the lowest atmospheric Fe flux in the world (Wagener et al., 2008). Consequently, the phytoplank-ton community as a whole, and particularly nitrogen-fixing
organisms have been suggested to be Fe-limited (Falkowski et al., 1998; Berman-Frank et al., 2001; Moore et al., 2002), but direct experiment were lacking.
The BIOSOPE cruise provided the first spatially extensive experiment in the Southeast Pacific. We conducted ent addition bioassays, designed to investigate which nutri-ent (N, P and/or Fe) controls primary productivity, photosyn-thetic efficiency and dinitrogen fixation along a trophic gra-dient in the Southeast Pacific. A complementary paper (Van Wambeke et al. this issue) examines the factors that control heterotrophic bacterial growth in the same area.
2 Material and methods
This research was carried out onboard the R/V Atalante in October–November 2004. The experiments were performed at three stations (Fig. 1a) located in the western edge (sta-tion HNL, 9◦S 136◦W), in the center (station GYR, 26◦S 114◦W) and in the southeastern edge of the gyre (station EGY, 34◦S 92◦W).
All experimental setups were performed under strict trace metal clean conditions inside a clean container. Seawater was collected at 30 m depth using a trace metal-clean Teflon pump system and dispensed into 21 to 33 (depending on the number of treatments) acid-washed 4.5 l transparent polycar-bonate bottles. Under a laminar flow hood, nutrients or dust were added either alone or in combination: +Fe, +NPSi and +FeNPSi at station HNL, +Fe, +N, +P, +FeN, +FeNP and +dust at stations GYR and EGY. The final concentrations were 1 µmol l−1 NH+4, 2 µmol l−1 NaNO3−, 0.3 µmol l−1
NaH2 PO4, 2 nmol l−1 FeCl3and 0.25 mg l−1of dust.
De-spite the fact that Saharan dust deposition events are unlikely to occur in the Southeast Pacific, the dust used in this exper-iment was the Saharan soils collected and characterized by Guieu et al. (2002) in order to allow a comparison with ear-lier efforts (Mills et al., 2004; Blain et al., 2004, Bonnet et al., 2005). Each fertilization was performed in triplicate. The bottles were immediately capped with parafilm, sealed with PVC tape, and incubated for 48 h in an on-deck incubator with circulating surface seawater at appropriated irradiance (50% ambient light level). For each station, the incubation started in the morning. After two selected time points during the course of the experiment (T1=24 h; T2=48 h), three
repli-cates of each treatment were sacrificed in order to measure the following parameters: variable fluorescence, Chl-a con-centrations, epifluorescence microscopy counts and flow cy-tometry. For rate measurements such as primary productivity and dinitrogen fixation, subsamples of each 4.5 l microcosms have been used after each time point (24 h and 48 h) for par-allel incubations (see below). For each parameter, treatment means were compared using a one-way ANOVA and a Fisher PLSD means comparison test.
2.1 Nutrient analysis
Ambient nutrient concentrations have been measured at each of the three stations before the incubation experiments as well as during the incubations. Concentrations of nitrate, nitrite, phosphate and silicate have been analysed using a Technicon Autoanalyser II (Treguer and Le Corre, 1975). All the measurements have been done onboard, except for the silicate samples, which were poisoned (mercuric chlo-ride 1 µg ml−1) and analyzed on land. Measurements in the nanomolar range (lower detection limit=3 nmoles l−1)
were obtained from the sensitive method described by Raim-bault et al. (1990). Nitrate at submicromolar levels (detec-tion limit: 0.05 µmoles l−1)and phosphate (detection limit:
0.02 µ moles l−1)were measured according to Armstrong et
al. (1967). Ammonium concentrations were measured as de-scribed by Holmes et al. (1999), with a detection limit of 5 nmoles l−1
2.2 Dissolved iron (DFe) concentrations
DFe concentrations were measured on 19 vertical profiles (0–400 m) along the 8000 km transect. They were analyzed by Flow Injection Analysis with online preconcentration and chemiluminescence detection (FIA-CL) (adapted from Obata et al., 1993). The mean blank, calculated from daily deter-minations, equaled 69±18 pmol l−1(n=19) and the detection limit was 54 pmol l−1. Each sample was analyzed in tripli-cate. When at least two of the three runs agreed within ex-pected reproducibility (10%), the average of the two or three concordant runs was taken as a correct concentration. If the concentration obtained deviated too much from the profile continuum expectations and seemed to be contaminated, one of the other sampled bottles was then analyzed (in triplicate) (see Blain et al. this issue, for more details on the methodol-ogy).
2.3 Dinitrogen fixation
At the last time point of each experiment, 0.6 ml of each mi-crocosms have been subsampled. 1 ml of 15N2 gas (99% 15N
2EURISOTOP) was introduced to each 0.6 l
polycarbon-ate bottle through a Teflon-lined butyl rubber septum using a gas-tight syringe according to Montoya et al. (1996). After 24 h of incubation, the samples were filtered under low vac-uum (100 mm Hg) through a precombusted (24 h at 450◦C)
25-mm GF/F filter and dried at 60◦C. Filters were stored in
a desiccator until analysed. Determination of 15N enrich-ments was performed with an Integra-CN PDZ EUROPA mass spectrometer. The background natural abundance de-termined on 8 unlabelled samples was 0.367±0.007% for N. Only excess enrichments larger than twice the standard de-viation (0.014% for N) were considered as significant. The spectrometer was calibrated in order to detect the low levels of particulate nitrogen encountered; it was calibrated with
glycin references every batch of 10–15 samples. The ac-curacy of our analytical system was also regularly verified using reference materials from the International Atomic En-ergy Agency (AIEA, Analytical Quality Control Services). Based on the lowest nitrogen level determined by our mass spectrometer (0.2 µmoles), the detection limit for dinitrogen fixation was 0.3 µmoles l−1. Dinitrogen fixation rates (rN in nmoles N l−1 t−1)were computed from an equation based on final particulate nitrogen (Dugdale and Wilkerson, 1986) (see Raimbault and Garcia, this issue for more details on the methodology).
2.4 Primary productivity
After each time point, primary production was measured on 250 ml subsamples of each microcosm as described by Moutin and Raimbault (2002). Each subsample was inocu-lated with 0.37 MBq of NaH14CO3(Amersham CFA3) and
incubated in a on-deck incubator (50% ambient light level) for four to seven hours around noon. Three samples were fil-tered immediately after inoculation for radioactivity determi-nation at T0, and 250 µl were sampled randomly from three bottles and stored with 250 µl of ethanolamine to determine the quantity of added tracer (Qi). After incubation, the
sam-ples were filtered on GF/F filters, covered with 500 µl of HCl 0.5 mol l−1and stored for pending analysis in the laboratory. In the laboratory, samples were dried for 12 h at 60◦C, 10 ml of ULTIMAGOLD-MV (Packard) were added to the filters and the radioactivity measured after 24 h with a Packard Tri carb 2100 TR liquid scintillation analyser. The hourly rate of primary production (PP) was calculated as:
PP(mgC m−3h−1)=(dpm-dpm(to))/(dpm(Qi)×1000)×25000/T
with T=incubation duration.
2.5 Flow cytometry
Cytometric analyses for picophytoplankton were performed on fresh samples with a FACSCalibur (Becton Dickin-son) flow cytometer. Populations were differentiated based on their scattering and fluorescence signals (Marie et al., 2000). Samples were acquired for 3 minutes at ∼80 µl min−1 (∼12 to 100×103 cells) using Cell Quest Pro soft-ware and data were analysed using the Cytowin softsoft-ware (see http://www.sb-roscoff.fr/Phyto/index.php?option=com docman\&task=cat view&gid=118\&Itemid=112). For-ward scatter (FSC) and chlorophyll-a fluorescence (FL3) cy-tometric signals were normalized to reference beads (Flu-oresbrite® YG Microspheres, Calibration Grade 1.00 µm, Polysciences, Inc) and then used as indicators of mean cell size and intracellular chlorophyll content, respectively (e.g. Campbell and Vaulot 1993). Significant changes in mean FSC and FL3 after incubation under the different treat-ments (48 h) was evaluated through ANOVA analyses.
2.6 Epifluorescence microscopy counts
Counts were performed with a Olympus BX51 epifluo-rescence microscope. Water samples (100 ml) were fixed with glutaraldehyde (0.25% final concentration) and filtered through 0.8 µm pore size filters. Samples were stained with 4’6-diamidino-2-phenylindole (DAPI, 5 µg ml−1 final con-centration). Eukaryotes were identified and counted by stan-dard epifluorescence microscopy (Porter and Feig, 1980). 2.7 Variable fluorescence
Chlorophyll variable fluorescence of phytoplankton was measured using the custom-built benchtop Fluorescence Induction and Relaxation (FIRe) system (Gorbunov and Falkowski, 2005). The excitation light was provided by 4 blue light-emitting diodes, LEDs, (central wavelength 450 nm, 30 nm bandwidth, with the peak optical power den-sity of 2 W cm−2). The variable fluorescence sequences were
processed to calculate minimum (Fo) and maximum (Fm)
fluorescence (measured in the dark), as the quantum effi-ciency of PSII (Fv/Fm), according to Kolber et al. (1998).
Measurements were made on dark-adapted samples (30 min). The background fluorescence signal (blank) was measured using 0.2 µm filtered seawater and was subtracted from the measured variable fluorescence.
2.8 Abundance of nitrogen fixers
Water samples (3 l) were filtered through 3 µm pore size fil-ters (GE Osmonics) and subsequently through 0.2 µm pore size Supor filters (PALL corp.). Both filters were processed to determine the N2-fixing microorganisms in the >3 µm
and <3 µm size fractions. DNA was extracted from the filters (Church et al., 2005) with the addition of a bead-beating step prior to the lysis step. The nif H gene was amplified with nested PCR primers (nif H1, nif H2, nif H3 and nif H4) (Church et al., 2005). The amplification prod-ucts were cloned into pGEM®-T vectors (Promega). Plas-mid DNA was isolated with Montage kits (Millipore) and the cloned inserts were sequenced at the University of California-Berkeley Sequencing facility. Quantitative PCR for Group A and B unicellular cyanobacterial nif H was per-formed as described in Church et al. (2005).
2.9 Determination of pigments
2.8 l of seawater were filtered onto GF/F filters and imme-diately stored in liquid nitrogen then at −80◦C until anal-ysis on land which was performed according to the proce-dure described in Ras et al. (2007). Pigment grouping into pigment-base size classes was performed according to Uitz et al. (2006).
3 Results
3.1 Initial nutrient concentrations and phytoplankton com-position
The initial nutrient concentrations and phytoplanktonic species composition for these bioassay experiments are given in Table 1. Fe vertical profiles indicated low (below 0.134±0.05 nmol l−1) and constant DFe con-centrations from the surface to 400 m depth through-out the entire transect (station MAR throughthrough-out sta-tion EGY, n=110), except in the Chilean coastal up-welling zone (Fig. 1b, see also Blain et al. this is-sue). Surface DFe concentrations were 0.14±0.02 nmol l−1, 0.10±0.01 nmol l−1 and 0.10±0.01 nmol l−1, respectively for the HNL, GYR and EGY stations (Table 1). In contrast, macronutrients and Chl-a concentrations differed markedly among stations, with Chl-a concentrations be-ing 0.029±0.01 mg m−3 in NO−
3-depleted waters of GYR
and 0.103±0.02 and 0.110±0.01 mg m−3 respectively at EGY and HNL, where NO−3 concentrations were higher (0.02±0.02 and 1.66±0.11 µmol l−1; Table 1). Waters were phosphate-replete along the whole transect with concentra-tions always above 0.11 µmol l−1.
The phytoplankton community structure was dominated by picophytoplankton at the three stations, where it repsented 58%, 49% and 47% of the total Chl-a (Table 1), re-spectively at HNL, GYR and EGY. Cyanobacteria, mainly belonging to the Prochlorococcus genera, dominated pico-phytoplancton. Phytoplankton pigment distribution along the transect is described in Ras et al. (2007).
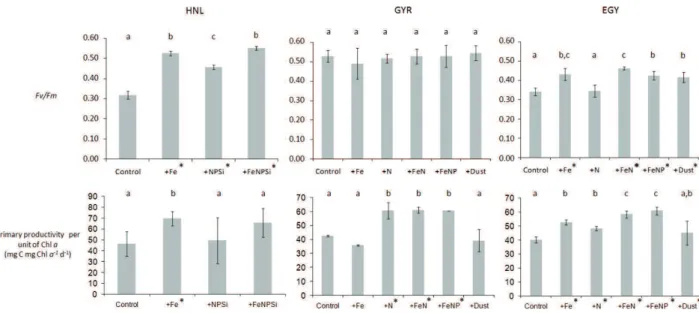
3.2 Biological response during the incubation experiments For all the parameters measured in this experiments, the stim-ulation by nutrients was considered to be significant when the ANOVA comparison of distribution of triplicate treatments gave values of p<0.05. The significant responses (different from the control) are indicated by an asterisk on Fig. 2. 3.2.1 Photosynthetic quantum efficiency of photosystem II The western part of the gyre (station HNL) was character-ized by low Fv/Fm (0.16±0.01) at T0 (Table 1), indicating an apparently low yield of photosynthesis. Iron was found to be the nutrient that controls photosynthetic efficiency at that station, as indicated by the increase of 65% of Fv/Fm
after an Fe addition (p<0.05; Fig. 2). The station located at the eastern side of the gyre (station EGY) exhibited medium
Fv/Fmvalues at T0 (0.30±0.02) (Table 1) that increased
sig-nificantly (p<0.05) after Fe addition, but in a lower propor-tion compared to stapropor-tion HNL (30%; Fig. 2). In contrast, the center of the South Pacific Gyre was characterized by high
Fv/Fmat T0 (0.51±0.03) (Table 1). This value didnot
Fig. 2. Effect of nutrient additions during bioassay experiments performed at the three stations (HNL, GYR, EGY) (a) Photochemical
efficiency of photosystem II (Fv/Fm)after 24 h incubation, (b) Primary productivity per unit chlorophyll-a (mg C mg Chl-a−1d−1)after
48 h of incubation. Fv/Fmand carbon fixation were measured from separate triplicate bottles, such that nine bottles were incubated for
each nutrient treatment. The error bars represent the standard deviation from triplicate incubations. Treatment means were compared using a one-way ANOVA and a Fisher PLSD means comparison test. Means that are significantly different from the control are labelled with an asterisk and means that are not significantly different are labelled with the same letter (p<0.05).
Table 1. Initial conditions for bioassay experiments. % pico-, nano- and microphytoplankton correspond to the biomass proportion of total
Chl-a associated with each size class of phytoplankton calculated as described in Uitz et al. (2006).
Experiment 1 HNL Experiment 2 GYR Experiment 3 EGY
Latitude Longitude 9◦04′S 136◦97′W 26◦04′S 114◦02′W 31◦89′S 91◦39′W Chl-a (mg m−3) 0.11±0.05 0.029±0.01 0.103±0.02 NO−3 (µmol l−1) 1.66±0.11 <0.003 0.02±0.02 NO−2 (µmol l−1) 0.03±0.00 <0.003 0.01±0.00 NH+4 (µmol l−1) 0.03±0.00 0.006±0.00 <0.005 PO3−4 (µmol l−1) 0.30±0.01 0.11±0.02 0.14±0.06 SiOH4(µmol l−1) 1.31±0.12 0.98±0.09 1.21±0.17 DFe (nmol l−1) 0.14±0.02 0.10±0.01 0.10±0.01 Fv/Fm 0.16±0.01 0.51±0.03 0.30±0.01 % pico- 58 49 47 % nano- 31 48 43 % micro- 11 13 10
addition of macronutrients without Fe had a positive effect at station HNL, but did not have any effect at station EGY, where only a Fe addition (alone or in combination) resulted in an increase of Fv/Fm. The dust treatment also had a
posi-tive effect on Fv/Fmat the station EGY.
3.2.2 Rate measurements
Primary productivity
At station HNL, only the addition of Fe resulted in a significant increase of primary productivity (+50%,
p<0.05), whereas at station GYR, only the treatments hav-ing nitrogen (+N, +FeN and +FeNP) resulted in a positive response (+45%, p<0.05). At station EGY, all treatments
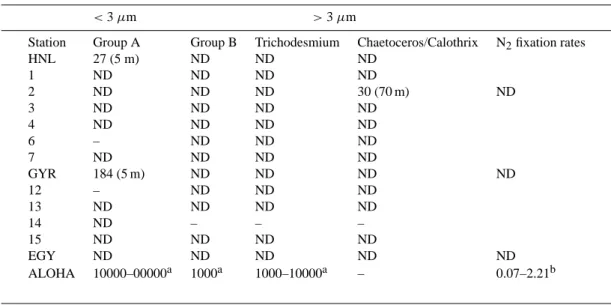
Table 2. Abundance of diazotrophs (gene copies per liter) determined by QPCR for samples collected at 13 stations between HNL and EGY
(ND: Non Detectable). The depth at which the nif H gene was detectable is indicated between parentheses. The nitrogen fixation rates (nmol
l−1d−1)measured at the three stations during the incubation experiments are also indicated. aData obtained from Church et al. (2005) at
25 m depth in December 2002 (Aloha station).bData from Dore et al. (2002).
<3 µm >3 µm
Station Group A Group B Trichodesmium Chaetoceros/Calothrix N2fixation rates
HNL 27 (5 m) ND ND ND 1 ND ND ND ND 2 ND ND ND 30 (70 m) ND 3 ND ND ND ND 4 ND ND ND ND 6 – ND ND ND 7 ND ND ND ND GYR 184 (5 m) ND ND ND ND 12 – ND ND ND 13 ND ND ND ND 14 ND – – – 15 ND ND ND ND EGY ND ND ND ND ND ALOHA 10000–00000a 1000a 1000–10000a – 0.07–2.21b
with a source of Fe or N resulted in a positive increase (+25%). The addition of both Fe and N resulted in a higher response (+50%), indicating a clear Fe and N co-limitation. At stations GYR and EGY, the addition of P together with Fe and N did not result in a significantly higher response than the addition of Fe and N alone, indicating that P is not limiting.
Dinitrogen fixation
15N
2assimilation consistently remained below the detection
limit at the three stations in our incubation experiments (Table 2), indicating the absence of dinitrogen fixation, even after dust, Fe, and FeP additions.
3.2.3 Abundance of nitrogen fixers
Water samples from 13 stations situated between HNL and EGY (Fig. 1a) were examined for presence of N2-fixing
microorganisms by amplification of the nif H gene. Af-ter amplification, cloning and sequencing the nitrogenase genes, our results indicate the absence of the filamentous cyanobacteria Trichodesmium, or any large (3–7 µm) uni-cellular putative nitrogen fixing cyanobacteria (Group B). The results suggest however the presence of low numbers of Group A cyanobacterial phylotypes at two stations (less than 200 copies l−1, Table 2), and low numbers of non-cyanobacterial nif H sequences (Vibrio diazotrophicus and proteobacteria), that must explain the significant dinitrogen fixation rates measured by Raimbault et al. (2007) during
the transect. It must be noted that the molecular data for both ends of the transect (data not related to these incuba-tions) indicate the presence of larger number of cyanobacte-ria close to the Marquesas archipelago (up to 342 copies l−1
Group B, 45 copies l−1Trichodesmium and 178 copies l−1
Chaetoceros/Calothrix) and close to the Chilean upwelling (108 copies l−1Group B and 20 copies l−1Trichodesmium). These higher densities of diazotrophs are consistent with the higher dinitrogen fixation rates measured by Raimbault et al. (2007) at both ends of the transect.
3.2.4 Cell numbers
Epifluorescence microscopy confirmed the absence of the two phylotypes Trichodesmium and unicellular from Group B at any station and treatment, which is in agreement with molecular biology data. Concerning non nitrogen-fixing or-ganisms, the addition of Fe or Fe and/or macronutrients at stations HNL resulted in a significant (p<0.05) increase in Synechococcus and picoeukaryotes abundances (Table 3). At station EGY, all treatments containing nitrogen had a pos-itive effect on picoeukaryotes, Prochlorococcus and Syne-chococcus abundances. At station GYR, only the +N and +Fe and N treatments induced a significant increase in pi-coeukaryotes abundances. The other treatments did not have any effect on this group, nor on Synechococcus. However, larger Synechococcus fluorescence (FL3) and forward light scatter (FSC) cytometric signals indicated at station GYR an increase in relative cell size and intracellular chlorophyll-a content after addition of N, Fe and N and FeNP (p<0.05 for
Table 3. Evolution of the abundances of Prochlorococcus, Synechococcus and picophyto-eukaryotes after 48 h of incubation at the three
stations studied, for each treatment (cells ml−1; mean± SD). The standard deviation (SD) is calculated on the triplicates. At station GYR,
Prochlorococcus fluorescence was too dim to allow us to detect changes in either the abundance or cytometric signals. Treatment means
were compared using a one-way ANOVA and a Fisher PLSD means comparison test. Means that are significantly different from the control (p<0.05) are labelled with an asterisk.
HNL station
Sample Prochlorococcus/ml Synechococcus/ml Picoeukaryotes/ml
Control 264133 ± 17091 30096 ± 677 10140 ± 371
Fe 116928 ± 1858 47740 ± 1256* 15502 ± 1039*
NPSi 420368 ± 43935* 60892 ± 4157* 23309 ± 1056*
FeNPSi 142137 ± 12420 61178 ± 1726* 18243 ± 1398*
GYR station
Sample Prochlorococcus/ml Synechococcus/ml Picoeukaryotes/ml
Control nd 1704 ± 272 572 ± 109 Fe nd 1873 ± 176 518 ± 37 N nd 1659 ± 119 775 ± 144* FeN nd 1491 ± 79 916 ± 106* FeNP nd 1546 ± 55 678 ± 113 Dust nd 2012 ± 129 625 ± 33 EGY station
Sample Prochlorococcus/ml Synechococcus/ml Picoeukaryotes/ml
Control 158798 ± 6284 18743 ± 512 6422 ± 162 Fe 102588 ± 3761 15963 ± 795 5724 ± 141 N 253317 ± 19927* 20521 ± 900* 8642 ± 589* FeN 129818 ± 12825 18129 ± 669 7960 ± 237* FeNP 127752 ± 7424 17400 ± 454 8694 ± 186* Dust 138278 ± nd 17936 ± 481 8288 ± 312*
Table 4. Cytometric signals obtained at station GYR for each
treat-ment. Significant changes in mean FSC and FL3 after incubation under the different treatments (48 h) was evaluated using a one-way ANOVA. Significant data (p<0.05) are labelled with an as-terisk. Abbreviations: Proc (Prochlorococcus), Syn (Synechococ-cus), Euk (picophytoeukaryotes), SSC (side scattered light inten-sity), FSC (Forward scattered light inteninten-sity), FL3 (chlorophyll-a fluorescence).
Fe N Fe and N All Dust
SSC Proc. 0.065* 0.013* 0.024* 0.034* 0.016* FSC Syn. 0.470 0.012* 0.006* 0.009* 0.858 SSC Syn. 0.792 0.805 0.374 0.444 0.400 FL3 Syn. 0.230 0.021* 0.020* 0.018* 0.708 FSC Euk. 0.646 0.011* 0.259 0.221 0.883 SSC Euk. 0.663 0.002* 0.124 0.048* 1.000 FL3 Euk. 0.096 0.032* 0.117 0.01* 0.595
FSC and FL3, Table 4). The presence of cyanobacteria in the size range 1 to 3 µm was later confirmed by epifluorescence microscopy counts.
4 Discussion 4.1 The role of Fe
The data indicate that Fe is the nutrient that controls pho-tosynthetic efficiency and primary productivity outside the gyre, at station HNL. These results are in accordance with the patterns found in other HNLC waters (e.g. Boyd et al., 2000). Around Marquesas, Behrenfeld and Kolber (1999) also found low values of Fv/Fmwith a pronounced decrease
at night; in our experiments, the addition of Fe eliminated the nocturnal decrease and increased Fv/Fm values. In the central gyre (GYR), the high Fv/Fmvalue (0.51±0.03) was however unexpected due to the low dissolved Fe concentra-tions. This value is close to the maximum value observed in the ocean (Falkowski et al., 2004) and did not increase af-ter Fe or dust addition. Behrenfeld et al. (2006) found the same pattern (high Fv/Fm, absence of nocturnal decrease) in
the North Tropical Pacific, but the ambient dissolved Fe con-centrations there are two to seven times higher (Boyle et al., 2005) than in the South Pacific Gyre, where our experiments were carried out. Our data also indicate that the addition of Fe did not change Chl-a concentrations or primary produc-tivity (p>0.05), indicating that, in contrary to the HNL
sta-tion, the photoautotrophic community was not Fe-limited in the gyre. This suggests that the natural assemblage is accli-mated to Fe deprivation.
Flow cytometry measurements identified Prochlorococcus as a prominent component of the prokaryote-dominated phy-toplankton assemblage at station GYR (20 000 cells ml−1), whereas in terms of carbon biomass, picophytoeukary-otes dominated (0.89 mg C m−3, i.e. 2.6-fold higher than Prochlorococcus). Although Synechococcus abundance was similar to that of Prochlorococcus (1400 cells ml−1), their contribution to the phytoplanktonic carbon biomass was neg-ligible (0.06 mg C m−3). To maintain high carbon fixation rates in such a low Fe environment, the organisms must have developed ecophysiological strategies to survive the shortage of Fe, including Fe scavenging systems (Geider and la Roche, 1994), efficient Fe transport systems over the plasma membrane (Katoh et al., 2001) or gene regulation systems consisting in rearrangements of photosynthetic ap-paratus (Sandstr¨om et al., 2002).
In summary, although DFe concentrations were identical at the three stations, our data clearly show contrasting phys-iological responses to Fe additions. Cultures experiments conducted under Fe limited conditions exhibit either low (∼0.1) or high (∼0.5) Fv/Fmdepending on whether growth
is balanced or unbalanced (Price, 2005). The high Fv/Fm
values measured in the center of the gyre (GYR) are a clear indication that the phytoplankton assemblages are well ac-climated to the stable environmental conditions of low N and low Fe. In contrast, station HNL (situated in the southern limit of the equatorial upwelling and embedded in the west-ward flowing South Equatorial Current) and station EGY (corresponding to a transition zone between the salty East-ern South Pacific Central Waters and the waters influenced by fresher Subantarctic Surface Waters (Emery and Meincke, 1986) are less steady environments, with low Fv/Fmvalues
and increased Fopossibly due to the presence of specific
Fe-stress pigment-protein complexes (Behrenfeld et al., 2006). This might also suggest an unbalanced growth (Parkhill et al., 2001) in environment with occasional spikes of nutrients.
It is interesting to note that a dust addition did not cause any increase of primary productivity at station EGY, while an iron addition resulted in a positive response. This absence of response can be interpreted by the fact that only 0.1% of the iron in the dust dissolved, which is ten times lower than the dissolution found with the same amount of the same dust in the Mediterranean waters by Bonnet and Guieu (2004). This difference can be interpreted by the difference in organic ligands concentrations between the Pacific and the Mediter-ranean waters (Bonnet, 2005).
4.2 From Fe to nitrogen limitation
Dissolved Fe concentrations were low and constant along the three stations studied, but the data clearly show a progression from Fe limitation in station HNL towards nitrogen
limita-tion in stalimita-tion GYR. Stalimita-tion EGY, located on the southeast-ern edge of the gyre, is a transition station where primary productivity is Fe and N co-limited. In the center of the gyre (station GYR), nitrogen is the nutrient that controls primary productivity. The addition of a nitrogen source resulted in an increase in the abundance of picophytoeukaryotes and an in-crease in relative cell size and intracellular Chl-a content of Synechococcus (p<0.05). It is interesting to note that bac-terial production is also directly enhanced after a nitrogen addition (by a factor of 9 after 48 h, see Van Wambeke et al. this issue).
Perhaps the most intriguing part of this study is the ab-sence of dinitrogen fixation in our experiments, even after dust, Fe and/or P additions. These results suggest that nei-ther P nor Fe limit dinitrogen fixation at 30 m depth. It must be noted that Raimbault and Garcia (2007) measured low dinitrogen fixation rates at 30 m in the central gyre (sta-tions GYR), revealing the weakness of the process at this depth. However, these authors measured significant N2
fix-ation rates in subsurface waters (∼1 nmol l−1d−1), which is
in accordance with the molecular data (Table 2) and recent modelling efforts (Deutsch et al. 2007). At the other stations located between stations HNL and EGY, diazotrophic het-erotrophic bacteria detected by molecular tools must be re-sponsible of the dinitrogen fixation rates measured at regular stations by Raimbault and Garcia (2007). It has to be noted that the density of diazotrophic cyanobacteria are extremely low compared to those of the North Pacific Gyre (ALOHA station in December, 10 000 to 100 000 copies l−1). The ab-sence of Trichodesmium and Group B phylotypes also con-trasts with amplification from oligotrophic waters of the trop-ical North Pacific Ocean, where cyanobacterial nif H genes from these two groups are abundant, even during the winter season (see Table 2; Church et al., 2005). In this area, dini-trogen fixation rates are high throughout the water column (Dore et al., 2002) and provide a major source of newly fixed nitrogen to the euphotic zone, sustaining up to 50% of new primary production, and drives the system towards P- and/or Fe-limitation (Karl et al., 1997; Sohm et al.1). The scarcity of nitrogen fixing organisms in the South Pacific Gyre may be one of the origins of the relatively large phosphate concen-trations (always above 0.11 µmol l−1; Moutin et al., 2007), as well as the N controlled status of the phytoplankton and bacterial communities. However, the other potential sources of nitrogen for the South Pacific Gyre are small and dinitro-gen fixation may nonetheless represent the main source of new nitrogen in the system (Raimbault and Garcia, 2007): the vertical flux of NO−3 from below the thermocline is ex-tremely low compared to other gyres (10 to 12 times lower than the one measured in the North Atlantic gyre; Capone
1Sohm, J., Krauk, J., Mahaffey, C., Capone, D. G.: Diagnostics
of phosphorus stress in the cyanobacterium Trichodesmium reveal the northwest Atlantic is more severely P limited than the tropical Pacific, Limnol. Oceanogr., submitted, 2008.
et al., 2005), and potential atmospheric deposition of nitro-gen is almost absent according to the aerosols measurements performed in this area by Wagener et al. (2008).
5 Conclusions
This paper is an attempt to analyse which are the nutrients that control primary productivity in the Southeast Pacific. A gradient in the nutrient control of phytoplanktonic com-munities is described, from an Fe-controlled system (on the edge of the gyre) towards a nitrogen-controlled system (in the center of the gyre). By combining physiological data, rate processes measurements and molecular approaches, this unique nutritional status of the phytoplankton populations is described for the first time in the gyre. Autotrophic com-munities are indeed adapted to living under extremely low Fe levels; these results add a new perspective on life in ex-treme environments and give a new perspective to so-called HNLC areas of the world ocean. In addition, we show for the first time that nitrogen fixing cyanobacteria are scarce in the South Pacific Gyre. Due to the extremely low Fe-rich dust inputs at the surface waters of the gyre, these waters con-stitute a “low iron” environment (Blain et al. this issue). It is hypothesized that this region is not a favourable environ-ment for common photoautotrophic nitrogen fixing organ-isms (e.g. Trichodesmium), as they have elevated Fe quo-tas relative to non-diazotrophic phytoplankton (Kustka et al., 2003). However, the factors controlling dinitrogen fixation are still poorly understood and further studies are needed to understand the distribution of these organisms and their bio-geochemical impact in the ocean.
Acknowledgements. Dominique Tailliez and Claudie Bournot are
warmly thanked for their efficient help in CTD rosette management
and data processing. This is a contribution of the BIOSOPE
project of the LEFE-CYBER program. This research was funded by the Centre National de la Recherche Scientifique (CNRS), the Institut des Sciences de l’Univers (INSU), the Centre National
d’ ´Etudes Spatiales (CNES), the European Space Agency (ESA),
The National Aeronautics and Space Administration (NASA), the Academy of Sciences (AVCR) and the Ministry of Education (MSMT) of the Czech Republic, and the Natural Sciences and Engineering Research Council of Canada (NSERC).
Edited by: J.-P. Gattuso
References
Armstrong, F. A. J., Stearns, C. R., and Strickland, J. D. H.: The measurement of upwelling and subsequent biological processes by means of the Technicon AutoAnalyzer and associated equip-ment, Deep Sea Res., 14(3), 381–389, 1967.
Arrigo, K. R.: Marine micro-organisms and global nutrient cycles, Nature, 437(7057), 349–355, 2005.
Behrenfeld, M. J. and Kolber, Z. S.: Widespread iron limitation of phytoplankton in the South Pacific Ocean, Science, 238 840– 843, 1999.
Behrenfeld, M. J., Worthington, K., Sherell, R. M., et al.: Controls on tropical Pacific ocean productivity revealed through nutrient stress diagnostic, Nature 442, 1025–1028, 2006.
Berman-Frank, I., J., Cullen, J., Hareli, Y., et al.: Iron availabil-ity, cellular iron quotas, and nitrogen fixation in Trichodesmium, Limnol. Oceanogr., 46, 1249–1277, 2001.
Blain, S., Bonnet, S., and Guieu, C.: Dissolved iron distribution in the tropical and sub tropical Southeastern Pacific, Biogeo-sciences Discuss., 4, 2845–2875, 2007,
http://www.biogeosciences-discuss.net/4/2845/2007/.
Bonnet, S. and Guieu, C.: Dissolution of atmospheric
iron in seawater. Geophys. Res. Lett., 31, L03303,
doi:10.1029/2003GL018423, 2004.
Bonnet S., Guieu C., Chiaverini J., et al.: Impact of atmospheric in-puts on the autotrophic communities in a low nutrient low chloro-phyll system, Limnol. Oceanogr., 50(6), 1810–1819, 2005. Bonnet, S.: The role of atmospheric iron in oligotrophic
environ-ments. Ph.D. thesis, University Pierre et Marie Curie, Paris 6, 207 pp., 2005.
Boyd, P. W., Watson, A. J., Law, C. S., et al.: A mesoscale phyto-plankton bloom in the polar Southern Ocean stimulated by iron fertilization, Nature, 407, 695–702, 2000.
Boyle, E., Bergquist, B. A., Kayser, R. A., and Mahowald, N.: Iron, manganese, and Lead at Hawaii Ocean Time-series sta-tion ALOHA: Temporal variability and an intermediate water hydrothermal plume, Geochim. Cosmochim. Act., 69, 933–952, 2005.
Campbell, L. and Vaulot, D.: Photosynthetic picoplankton commu-nity structure in the subtropical North Pacific Ocean near Hawaii (station ALOHA).Deep-Sea Res., 40, 2043–2060, 1993. Capone, D. G., Burns, J. A., Montoya, J. P. et al.: New nitrogen
input to the tropical North Atlantic Ocean by nitrogen fixation by the cyanobacterium, Trichodesmium spp., Global Biogeoch. Cy., 19, GB2024, doi:10.1029/2004GB002331, 2005.
Church, M. J., Jenkins, B. D., Karl, D. M., and Zehr, J. P.: Vertical distributions of nitrogen-fixing phylotypes at Stn ALOHA in the oligotrophic North Pacific Ocean. Aquat. Microb. Ecol., 38(1), 3–14, 2005.
Claustre, H. and Maritorena, S.: The many shades of ocean blue, Science, 302, 1514–1515, 2003.
Deutsch, C., Sarmiento, J. L., Sigman, D. M., et al.: Spatial cou-pling of nitrogen inputs and losses in the ocean, Nature, 445, 163–167, 2007.
Dore, J. E., Brum, J. R., Tupas, L. M., and Karl, D. M.: Sea-sonal and Interannual Variability in Sources of Nitrogen Support-ing Export in the Oligotrophic Subtropical North Pacific Ocean. Limnol. Oceanogr, 47, 1595–1607, 2002.
Dugdale, R. C. and Wilkerson, F. P.: The use of 15N to measure ni-trogen uptake in eutrophic oceans, experimental conditions.
Lim-nol. Oceanogr., 31 673–689, 1986.
Emerson, S., Quay, P., Karl, D., et al.: Experimental determina-tion of the organic carbon flux from open-ocean surface waters, Nature, 389, 951–954, 1997.
Emery, W. J. and Meincke, J.: Global water masses: summary and review. Oceanol. Acta., 9, 383–391, 1986.
Falkowski, P. G., Katz, M. E., Knoll, A. H., et al.: The Evolu-tion of Modern Eukaryotic Phytoplankton., Nature, 305, doi: 0.1126/science.1095964, 354–360, 2004.
Falkowski, P. G., Barber, R. T., and Smetacek, V.: Biogeochemi-cal controls and feedbacks on primary production, Science, 281, 200–206, 1998.
Falkowski, P. G.: Evolution of the nitrogen cycle and its influence
on the biological sequestration of CO2in the Ocean, Nature, 387,
272–275, 1997.
Geider, J. G. and La Roche, J.: The role of iron in phytoplankton. photosynthesis, and the potential for iron-limitation of primary production in the sea. Photosynth. Res., 39, 275–301, 1994. Guieu C., Lo¨ye-Pilot, M.-D., Ridame, C., and Thomas, C.:
Chemi-cal characterization of the Saharan dust end-member; some bio-logical implications for the western Mediterranean, J. Geophys. Res, 107(D15),4258, doi:10.1029/2001JD000582, 2002. Gorbunov, M. Y. and Falkowski, P. G.: Fluorescence Induction and
Relaxation (FIRe) Technique and Instrumentation for Monitor-ing Photosynthetic Processes and Primary Production in Aquatic Ecosystems. Photosynthesis: Fundamental Aspects to Global Perspectives. A. v. d. E. a. D. Bruce, Allen Press: 1029–1031, 2005.
Holmes, M. R., Aminot, A., Kerouel, R., Hooker, B. A., and Pe-terson,J. B.: A simple and precise method for measuring am-monium in marine and freshwater ecosystems, Can.J.FishAquat. Sci., 56, 1801–1808, 1999.
Karl, D. M., Letelier, R., Tupas, L., et al.: The role of nitrogen fix-ation in biogeochemical cycling in the subtropical North Pacific Ocean, Nature, 388, 533–538, 1997.
Karl, D. M.: Nutrient dynamics in the deep blue sea, Trends Micro-biol, 10, 410–418, 2002.
Karl, D., Michaels, A., Bergman, B., Capone, D., Carpenter, E., Letelier, R., Lipschultz, F., Paerl, H., Sigman, D., and Stal, L.: Dinitrogen Fixation in the World’s Oceans, Biogeochem., 57, 47–98, 2002.
Katoh, H., Hagino, N., Grossman, A. R., and Ohawa, T.: Gens essential to iron transoport in the cyaniobacterium synechocystis sp. stain PCC 6803, J. Bacteriol., 183(9), 2779–2784, 2001. Kolber, Z., Prasil, O., and Falkowski, P.: Measurements of variable
chlorophyll fluorescence using fast repetition technique I. Defin-ing methodology and experimental protocols, Biochim. Biophys. Acta., 1367, 88–106, 1998.
Kustka, A. B., Carpenter, E. J., Sa˜nudo-Wilhelmy, S., and Sunda, W. G.: Iron requirements for N2 and NH4+ supported growth in cultures of Trichodesmium (IMS 101): comparison with nitro-gen fixation rates and Fe: C ratios of field populations, Limnol. Oceanogr., 48, 1869–1884, 2003.
Marie, D., Partensky, F., Simon, N., et al.: Flow cytometry analysis of marine picoplankton. living colors: protocols in flow cytom-etry and cell sorting, D. S. Diamond RA, NewYork, Springer-Verlag, 421–454, 2000.
Mills, M. M., Ridame, C., Davey, M., et al.: Iron and phosphorus co-limit nitrogen fixation in the eastern tropical North Atlantic,
Nature, 429, 292–294, 2004.
Montoya, J. P., Voss, M., Kaehler, P., and Capone, D. G.: A simple, high precision tracer assay for dinitrogen fixation, App. Environ. Microb., 62, 986–993, 1996.
Moore, J. K., Doney, S. C., Glover, D. M., Fung, I. Y.: Iron cycling and nutrient-limitation patterns in surface waters of the World Ocean, Deep-Sea Research Part II-Topical Studies in Oceanog-raphy, 49, 463–507, 2002.
Moutin, T. and Raimbault, P.: Primary production, carbon export and nutrients availability in western and eastern Mediterranean Sea in early summer 1996, J. Marine Syst., 33–34, 273–288, 2002.
Moutin T., Karl, D. M., Duhamel, S., Rimmelin, P., Raimbault, P., Van Mooy, B. A. S., and Claustre, H.: Phosphate availability and the ultimate control of new nitrogen input by nitrogen fixation in the tropical Pacific Ocean, Biogeosciences Discuss., 4, 2407– 2440, 2007,
http://www.biogeosciences-discuss.net/4/2407/2007/.
Obata, H., Karatani, H., and Nakayama, E.: Automated deter-mination of iron in seawater by chelating resin concentration and chemiluminescence detection, Anal. Chem., 5, 1524–1528, 1993.
Parkhill, J. P., Maillet, G., and Cullen, J. J.: Fluorescence-based maximal quantum yield for PSII as a diagnostic of nutrient stress, J. Phycol., 17, 517–529, 2001.
Price, N. M.:The elemental stoichiometry and composition of an iron-limited diatom. Limnol. Oceanogr., 50, 1159–1171, 2005. Porter, K. G. and Feig, Y. S.: The use of DAPI for identifying and
counting aquatic microflora, Limnol. Oceanogr., 25, 943–948, 1980.
Raimbault P., Slawyk G., Coste B., and Fry J.: Feasibility of us-ing an automated colorimetric procedure for the determination
of seawater nitrate in the 0 to 100 nmol l−1range: examples
from field and culture, Mar. Biol., 104, 347–351, 1990. Raimbault, P. and Garcia, N.: Carbon and nitrogen uptake in the
South Pacific Ocean: Evidence for efficient dinitrogen fixation and regenerated production leading to large accumulation of dissolved organic matter in nitrogen-depleted waters, Biogeo-sciences Discuss., 4, 3531–3579, 2007,
http://www.biogeosciences-discuss.net/4/3531/2007/.
Ras J., Claustre, H., and Uitz, J.: Spatial variability of phytoplank-ton pigment distributions in the Subtropical South Pacific Ocean: comparison between in situ and predicted data, Biogeosciences Discuss., 4, 3409–3451, 2007,
http://www.biogeosciences-discuss.net/4/3409/2007/.
Raven, J. A.: The iron and molybdenum use efficiencies of plant growth with different energy, carbon and nitrogen source, New Phytol., 109, 279–287, 1988.
Sandstr¨om, S., Ivanov, A. G., Park, Y., et al.: Iron stress responses in the cyanobacterium Synechococcus sp. PCC7942, Physiol. Plan-tarum, 116(2), 255-263, doi:10.1034/j.1399-3054, 2002. Sa˜nudo-Wihelmy, S. A., Kustka, A., B., Gobler, C. J., et al. :
Phos-phorus limitation of nitrogen fixation by Trichodesmium in the central Atlantic Ocean, Nature, 411, 66–69, 2001.
Tr´eguer P. and Le Corre P.: Manuel d’analyse des sels nutritifs dans l’eau de mer. Utilisation de l’AutoAnalyser II Technicon. 2nd ed., Univ. Bretagne Occidentale, Laboratoire de Chimie marine, Brest, France, 1–110, 1975.
distri-bution of phytoplankton communities in open ocean: an assess-ment based on surface chlorophyll, J. Geophys. Res-oceans, 111, C08005, doi:10.1029/2005JC003207, 2006.
Van Wambeke F., Bonnet S., Moutin T., Raimbault P., Alarc¸on G., and Guieu C.: Factors limiting heterotrophic prokaryotic produc-tion in the Southern Pacific Ocean, Biogeosciences Discuss., 4, 3799–3828, 2007,
http://www.biogeosciences-discuss.net/4/3799/2007/.
Wagener, T., Guieu, C., Losno, R., Bonnet, S., and Ma-howald, N.: Revisiting Atmospheric dust export to the South Hemisphere Ocean, Global Biogeochemical Cycles, in press, doi:10.1029/2007GB002984, Decenber 2007.
Zehr, J. P., Waterbury, J. B., Turner, P. J., et al.: New nitrogen-fixing unicellular cyanobacteria discovered in the North Pacific subtropical gyre, Nature, 412, 635–638, 2001.