DOI 10.1007/s00442-014-2935-5
PhysIOlOgIcal ecOlOgy - OrIgInal research
Long‑term
13C labeling provides evidence for temporal
and spatial carbon allocation patterns in mature Picea abies
Manuel Mildner · Martin K.‑F. Bader · Sebastian Leuzinger · Rolf T. W. Siegwolf · Christian Körner
received: 25 October 2013 / accepted: 15 March 2014 / Published online: 3 april 2014 © springer-Verlag Berlin heidelberg 2014
2.5 years. The isotopic signals in soil cO2 arrived 12 days after the onset of Face, yet it contained only ca. 15 % new c thereafter. We conclude that new c first feeds into fast turnover c pools in the canopy and becomes increas-ingly mixed with older c sources as one moves away (downward) from the crown. We speculate that enhanced c turnover (its metabolic cost) along the phloem path, as evidenced by basipetal isotope signal depletion, explains part of the ‘missing carbon’ in trees that assimilated more c under elevated cO2.
Keywords carbon isotopes · elevated cO2 · Face · Forest · respiration
Introduction
atmospheric cO2 concentrations are rising and have now
been shown to follow the most extreme of the trajecto-ries predicted earlier (le Quéré et al. 2009; Friedlingstein et al. 2010). carbon (c) uptake and transpiration of trees exposed to future atmospheric cO2 concentrations have
been shown to strongly depend on the age of trees (ceule-mans and Mousseau 1994; Medlyn et al. 2001), tree spe-cies and tree spacing in a forest (Körner 2000), on soil conditions (spinnler et al. 2002), and on the duration of the treatment (Idso 1999; Körner 2006; leuzinger et al. 2011). Therefore, no generally valid response patterns are found for trees exposed to elevated cO2 (norby and Zak 2011). The most realistic responses can be expected when trees are experimentally exposed to elevated cO2 in situ in closed forest stands.
To date, only three free air cO2 enrichment (Face) experiments have been completed (with a fourth experi-ment using whole-tree chambers). a Pinus taeda
Abstract There is evidence of continued stimulation of
foliage photosynthesis in trees exposed to elevated atmos-pheric cO2 concentrations; however, this is mostly with-out a proportional growth response. consequently, we lack information on the fate of this extra carbon (c) acquired. By a steady application of a 13cO
2 label in a free air cO2
enrichment (Face) experiment, we traced the fate of c in 37-m-tall, ca. 110-year-old Picea abies trees in a natu-ral forest in switzerland. hence, we are not reporting tree responses to elevated cO2 (which would require equally 13c labeled controls), but are providing insights into
assim-ilate processing in such trees. sunlit needles and branchlets grow almost exclusively from current assimilates, whereas shaded parts of the crowns also rely on stored c. Only 2.5 years after Face initiation, tree rings contained 100 % new c. stem-respiratory cO2 averaged 50 % of new c over the entire Face period. Fine roots and mycorrhizal fungi contained 49–56 and 26–43 % new c, respectively, after
communicated by rowan sage.
M. Mildner (*) · M. K.-F. Bader · s. leuzinger · c. Körner Institute of Botany, University of Basel, schönbeinstrasse 6, 4056 Basel, switzerland
e-mail: [email protected] M. K.-F. Bader
new Zealand Forest research Institute (scIOn), Te Papa Tipu Innovation Park, 49 sala street, 3046 rotorua, new Zealand s. leuzinger
Institute for applied ecology new Zealand, school of applied sciences, auckland University of Technology, 31-33 symonds street, 1142 auckland, new Zealand
r. T. W. siegwolf
laboratory of atmospheric chemistry, Paul scherrer Institute, PsI, 5323 Villigen, switzerland
plantation in north carolina, Usa (Duke Face; schles-inger et al. 2006), revealed sustained stimulation of stem growth, which, however, was strongly influenced by high nitrogen (and possibly other nutrients) availability (Oren et al. 2001; schäfer et al. 2003; Mccarthy et al. 2010). The second experiment, a Liquidambar styraciflua plan-tation in Tennessee, Usa (Oak ridge Face), showed a strong initial but no long-term stimulation of growth and productivity (norby and Zak 2011). higher nitrogen demand to keep up with the greater c uptake eventually provoked soil nitrogen limitation, followed by a complete loss of the photosynthetic and nPP response to elevated cO2 by the end of the experiment (norby et al. 2010). a third experiment, using adult trees in a mature deciduous forest in switzerland [swiss canopy crane (scc) web-Face], reported no growth response to elevated cO2 at all (Körner et al. 2005; Bader et al. 2013), although some species-specific water savings induced a soil priming effect (nitrate release; schleppi et al. 2012). The fourth experiment, using whole-tree chambers on 40-year-old P.
abies trees in a boreal forest in northern sweden (Med-hurst et al. 2006), showed a growth response to elevated cO2 only when mineral fertilizer was applied, and none under natural nutrient conditions (comstedt et al. 2006; sigurdsson et al. 2013).
In summary, these results suggest that c is not generally a limiting resource for tree growth at current cO2 concen-trations. however, a common observation in most cO2 -enrichment experiments is that leaf photosynthesis remains stimulated by elevated cO2 (ainsworth and rogers 2007;
Bader et al. 2010; but see norby et al. 2010). even in cases where some downward adjustment had been seen, the diminished photosynthetic stimulation still did not produce a proportional growth response. Thus, the question of the fate of the additionally assimilated c remains (Fatichi and leuzinger 2013).
Tracing the fate of c in a forest needs a marker that can be applied at canopy scale. The stable 13c isotope is
the only suitable marker for such large-scale and long-term in situ labeling investigations. Pulse labeling (a strong, short-term peak with highly enriched 13cO
2;
usu-ally 99 % 13c) is suitable for studying short-term
dynam-ics of the c distribution (epron et al. 2012). The other option is to expose the foliage continuously with 13c
depleted cO2 originating from fossil fuel (e.g., −30 ‰ relative to the V-PDB standard), permitting the continu-ous tracing of the fate of novel c over a longer period (andrews et al. 1999; hättenschwiler et al. 2002; Körner et al. 2005; comstedt et al. 2006; Keel et al. 2007; von Felten et al. 2007).
recent studies on in situ c allocation in field-grown conifers (<25 m tall) used the whole tree/canopy 13c
pulse (or extended pulse) method with trees, which
are normally growing under ambient cO2 concentra-tion (Kagawa et al. 2006; högberg et al. 2008; endrulat et al. 2010; Dannoura et al. 2011; Kuptz et al. 2011a; Warren et al. 2012). such short-term pulse experiments in conifers revealed a rapid appearance (a few days) of labeled c in respiratory cO2 released from soils
(hög-berg et al. 2008; ritter et al. 2011), indicating a strong linkage between assimilation and soil cO2 release. how-ever, transport velocity and basipetal c propagation was found to vary with tree size and season, and is con-trolled by weather conditions and sink strength, as was demonstrated by repeated pulse labeling of 12-year-old
Pinus pinaster growing in a plantation (Dannoura et al. 2011; epron et al. 2011). Moreover, the dilution of new assimilates in large, old non-structural c pools prior to utilization (Keel et al. 2007) led to only a small and sea-sonally fluctuating contribution of new c to respiratory cO2 release from stems and coarse roots of a
60-year-old P. abies stand in germany (Kuptz et al. 2011a). similar c mixing and seasonal patterns for structural c were observed elsewhere (lippu 1994; Kagawa et al. 2006), and in deciduous trees at our study site (Keel et al. 2007; Bader et al. 2013). given that tissue forma-tion in evergreen trees profits from a year-round supply of new assimilates (hansen et al. 1996), we can assume a rapid manifestation of the isotopic signal contained in new photoassimilates, particularly in foliage and adjacent branchlets (branch autonomy; gordon and larson 1968; hoch 2005). signals of new c should dilute basipetally, e.g., in stem wood, and extend the time until old c is completely replaced by new c (Keel et al. 2007).
Using the scc web-Face facility in switzerland (Pepin and Körner 2002), we started cO2 enrichment of canopies of mature P. abies, and, thus, labeling with 13c depleted
cO2 in a near-natural forest ecosystem on 30 July 2009. The work presented here is not aimed at elucidating tree responses to elevated cO2, but should illustrate the basic patterns of c allocation in mature forest trees. establish-ing the fate of novel c should help in identifyestablish-ing sites and processes that explain ‘missing c’ in experiments with ele-vated atmospheric cO2. We present c distribution patterns using 13c signals, spanning a pre-treatment period and two
full growing seasons under elevated cO2. By consecutive sampling with short intervals in various tree compartments from tree tops to roots, we aim at analyzing (1) seasonal shifts in assimilate allocation, (2) locations of c-invest-ment, and (3) residence times (turnover) of mobile c pools. We expect that the 13c signal would be transferred from
needles to respiratory fluxes within a few days, but that it will take several years before new structural biomass such as stem wood consists fully of new c. although we cannot assess cO2 effects on new/old c mixing ratios due to miss-ing similarly labeled control trees, we are able to quantify
the main pathways and the duration of c transfer following assimilation for the first time in mature coniferous trees.
Materials and methods
Description of the free air cO2-enrichment facility
In 2009, a web-Face system (Pepin and Körner 2002) was installed in five 37-m-tall, then ca. 110-year-old Picea
abies individuals. With this system, the trees were exposed to increased atmospheric cO2 concentration at ca. 550 ppm in their natural forest environment. The site is located near the village of hofstetten (47°33′n, 7°36′e, 500 m a.s.l),
12 km south-west of Basel, switzerland. all five P. abies trees that were subjected to elevated cO2 are located within max. 5 m distance from another. Five similarly tall trees served as controls. Of these controls, one tree is situated only 6 m from the treated trees (separated from the treated trees by a forest road), whereas the other trees grew at a distance of 17–30 m from the cO2-enriched trees. The only control tree that was closer to the treated trees was ‘unpol-luted’ by tank cO2 as evidenced by the 13c data. While the
canopies of all cO2-treated trees and one control tree were accessible with a crane gondola, the crowns of the remain-ing control trees could only be reached by professional tree climbers.
The cO2 enrichment started on 30 July 2009, when earlywood and current year foliage formation of that year had been completed. Pure cO2 (in food industry
qual-ity, with a δ13c of −30 ‰) was released exclusively into
the tree canopies (15–37 m above ground) through laser-punched tubes woven around the tree branches. control of cO2 release was separated into four sectors per tree to
ensure an optimal cO2 distribution and concentration in response to wind directions: the tree tops, and three 120° sections around the remainder of the crowns (i.e. 4 sectors per tree, 20 sectors in total). each sector was separately monitored for cO2 concentrations and was individually supplied with pure cO2 to ensure a mean cO2 concentra-tion in the tree canopy of 550 ppm. each sampling line in the canopy for cO2 monitoring ended in a triplet, so that
each tree crown was sampled at 12 sampling points (60 for all 5 trees). Four extra gas-sampling lines served as a control (at the crane top, 45 m above ground, the sub-can-opy, and a calibration gas bottle). cO2 concentrations were
measured with two non-dispersive infrared gas analyzer (Irga; lI-820; li-cor, lincoln, ne, Usa). Using c4 grasses grown in the canopy, the δ13c of the cO
2 mixture
supplied was monitored (plant isometers, see below). cO2
release was suspended when temperature was below 6 °c, and when above-canopy photon flux density was below 100 μmol m−2 s−1. With this Face system, we could
reach median elevated cO2 concentrations of 500–560 ppm based on Irga readings, with a mean 20–50 ppm higher given the skewed frequency distribution.
c4 grass isometers
The values from Irga measurements could be confirmed by the isotopic compositions of canopy-grown c4 grasses (‘isometers’; Echinochloa crus-galli in 50-ml flasks filled with sand-clay soil, mounted in elevated and ambient tree crowns, and, thus, freely exposed to the same atmosphere as the tree crowns) in order to obtain the integrated δ13c
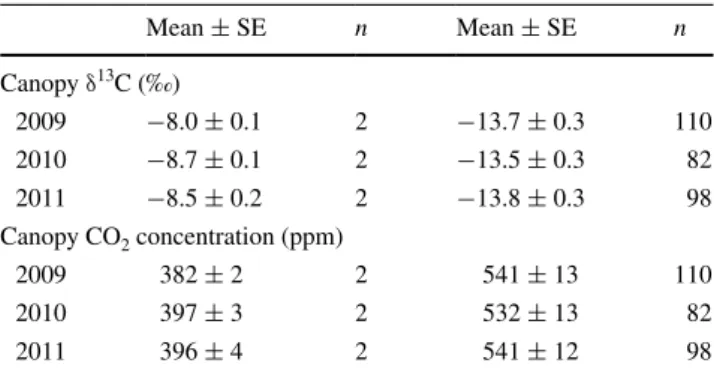
values and the corresponding cO2 concentrations (Table 1; see Pepin and Körner 2002 for calculation). since c4
grasses synthesize new biomass entirely from newly assimilated cO2 without further enzymatic fractionation, the isotopic signal in c4 grass tissue reflects the long-term δ13c within the tree crowns (ambient vs. elevated
δ13c differences in 2009, 2010, and 2011 (mean ± se): −5.7 ± 0.6, −4.8 ± 0.5, and −5.3 ± 0.3 ‰,
respec-tively,). These differences indicate 100 % new c incorpo-rated and served as a yearly reference for the new c frac-tion in the different tree tissues investigated. assuming that the isometers capture the same atmospheric cO2 mix-ture in the canopy that becomes effective for the treated
P. abies trees, the difference in the isotopic signals of isometers grown in elevated and ambient cO2 concentra-tions should also be observed between the tissues of the treated and control trees (the maximum possible new c integration into tissues). however, the scattered distribu-tion of a limited number (ca. 14) of containers with c4 grasses within the tree canopies during peak summer only (spring and autumn are too cold for c4 grasses) may cause a difference between the isometer signal and the maximum tree tissue signal captured over an entire season. although we are using isometer signals as a 100 % reference, they are still a proxy for the maximum new c integration into
Table 1 cO2 concentrations and δ13c signatures in the canopies of
trees subjected to ambient and elevated cO2 calculated from isometer (c4 grass Echinochloa crus-galli) δ13c values
ambient cO2 values were obtained from isometers installed at the
crane top. Mean ± se for the annual Face period for n isometers
Mean ± se n Mean ± se n canopy δ13c (‰) 2009 −8.0 ± 0.1 2 −13.7 ± 0.3 110 2010 −8.7 ± 0.1 2 −13.5 ± 0.3 82 2011 −8.5 ± 0.2 2 −13.8 ± 0.3 98 canopy cO2 concentration (ppm) 2009 382 ± 2 2 541 ± 13 110 2010 397 ± 3 2 532 ± 13 82 2011 396 ± 4 2 541 ± 12 98
tissues, and needles may spatially experience slightly less or more labeled tank cO2. a signal >100 % thus indicates
that isometers underestimated the signal strength at some locations. In any case, such a signal means that the new tissue was built from novel c only.
Branchlet needle and xylem sampling
During four sampling campaigns (pre-treatment: 1–16 July 2009; treatment periods: 18–27 august 2009; 29 sep-tember 2010; 29 July 2011), professional tree climbers collected three sun-exposed and three shaded branchlets from all four cardinal directions of the control trees that were not accessible via the crane gondola. The same kind of samples were collected from the remaining study trees using the crane (24 branchlets per tree, except during the pre-treatment campaign when only sun-exposed branchlets were used). From these branchlets, we investigated sun-exposed and shaded bulk needle material and sun-sun-exposed branchlet xylem tissue. In 2009, we collected needle and xylem samples from branchlet extensions initiated in the years 2008 and 2009. In the years 2010 and 2011, we sampled 2008 and 2009 branchlet parts again, along with the same kind of material from one or two more recent years. We obtained bulk xylem tissue by peeling off bark and phloem immediately after sampling. additional nee-dle tissue was collected every 2–6 days in august 2009 for 3 weeks following the Face onset, later we continued with 1- to 3-monthly sampling intervals. Three to five nee-dles of each of three sun-exposed and shaded branchlets per cardinal direction and per tree were collected. Prior to analysis, we pooled the needle and the xylem samples of the three branchlets from all four cardinal directions per treatment since we did not find azimuthal differences within either sunlit or shaded needles. Immediately after sampling, the material was heated in an on-site micro-wave oven (90 s at 600 W) to stop any metabolic processes (Popp et al. 1996). canopy cO2 enrichment could cause a
shift in photosynthetic 13c discrimination in both P. abies
trees and the c4 grasses that could add to the cO2 -enrich-ment signal caused by tank cO2. since such a biochemical adjustment is likely to be small (<1 ‰) and differ between sun and shade needles, we refrained from assuming a change and applying a uniform data adjustment, but pre-sent the data as measured.
Wood core sampling
Wood cores were collected at breast height (1.3 m) in east direction from each tree. Using a 5-mm-diameter increment corer, we took the samples in March 2010 during the trees’ winter dormancy after completion of the latewood forma-tion in 2009 (earlywood was formed before the beginning
of the cO2 enrichment on 30 July 2009). Tree rings formed in 2005–2009 were also analyzed for δ13c values. except
for latewood 2009, we expected δ13c signals in these tree
rings to reflect only pre-treatment conditions before the start of the experiment. There may, however, be a very small influence of storage reserves in older ray parenchyma in the trees receiving cO2 enrichment since midsummer 2009. Wood cores were again taken in February 2012 to assess the changes of the isotopic signal in the 2008–2011 tree rings throughout the experiment. earlywood and late-wood of each year were separated under a binocular using a razor blade. The transition zones between early and late-wood, and between the years were removed in order to obtain a clearly separated isotopic signals. The wood seg-ments were then analyzed for δ13c.
Fine root sampling
In March 2010, 9 soil cores per tree (12 cm in depth × 3.6 cm diameter) were collected in the inner part of the root disk (2 m from the stem) of each tree, add-ing up to a total of 90 root samples for treated and con-trol trees. The nine cores per tree were grouped into three ‘joint’ cores collected at 10 cm distance from one another, with the triplets separated at a 120° angle around each tree. The values of these triplicate samples were pooled after the isotope analysis in order to give a more robust signal. The resulting holes were used to install ingrowth cores of the same size (2-mm mesh cylinders), filled with sieved root-free soil from on-site molehills to assess cO2 effects
on fine root growth development (Bader et al. 2009). The bulk density of soil in the ingrowth cores was adjusted to the bulk density of the soil outside (mass to volume ratio). To capture the isotopic signal of newly formed fine roots entirely developed during Face, the use of ingrowth cores was the preferential method. In December 2011, 20 months after installation, the ingrowth cores were removed using a knife. Both soil and ingrowth cores were stored at −20 °c until processing in January 2012. Prior to fine root separation, cores were placed in cold water and defrosted for 48 h at 4 °c to keep the microbial degrada-tion of fine root biomass as slow as possible. roots were extracted by wet-sieving (1 mm mesh), and P. abies roots were identified using a reference root collection. since the five trees exposed to elevated cO2 formed a mono-specific group in the stand, the inner part of the treated area belonged almost exclusively to Picea, whereas at the periphery of the plot, roots of other species (e.g., Fagus
sylvatica, Carpinus betulus, Quercus petraea) co-occur. however, Picea roots are very distinct and can be clearly identified. Fine roots were separated into three diameter classes (<0.5, 0.5 < 1, 1–2 mm). We could not distinguish between still intact dead and live fine roots.
Fungal sporocarp sampling
During late summer and early fall 2010 and 2011, we col-lected fungal fruit bodies (sporocarps) within three distance intervals to a tree stem subjected to elevated cO2 (0–6, 6–12, 12–18 m; the last being considered as an untreated control). The sporocarps were frozen and stored at −20 °c until taxonomic and functional group classification (either saprobiotic, mycorrhizal, or parasitic) and further prepara-tion for c isotope analysis.
stem and soil air sampling
The cO2 emitted by stems was captured by four aluminum
cups per tree (Ø 8.2 cm, height 2.6 cm; using Terostat-IX; Teroson, ludwigsburg, germany) mounted in the four com-pass directions to each stem at breast height (1.3 m) after removing loose bark. given the rise in cO2 partial pressure
within the cups due to continuous cO2 release from tree stems, we assumed that small leaks would not affect the isotope signals. cups were fitted with an open-ended tube (2–3 cm long, inner Ø 3 mm) through a bottom hole. This tube permitted gas sampling with a syringe, but at the same time reduced gas exchange between the cups’ interior and surrounding air. since the cO2 concentration in the cups did not reach equilibrium (Ubierna et al. 2009a), we had to account for counter diffusion by atmospheric cO2. There-fore, the Keeling plot approach was applied to calculate the
δ13c in stem-emitted cO2 (see below). note that only the
tree canopy at 20–37 m height was receiving labeled tank cO2, with the understory remaining unaffected.
We used gas wells to collect air in equilibrium with soil air. These wells consisted of PVc tubes (inner Ø 18 mm, 12 cm long) in which small holes were drilled at each ca. 70° angle in five rows between 3 and 11 cm of the gas well height to allow air to diffuse into the tubes from the respec-tive depths (steinmann et al. 2004). The gas wells were inserted in vertical pre-punched holes in the soil in 2009. The bottom of each well was left open, and the top was covered with an air-tight rubber septum. Ten gas wells per tree were installed in two circles of 2 and 3 m radius around each tree stem (each with five gas wells per circle at ca. 70° angle).
at each sampling time, 15 ml air was extracted through the septum using a 60-ml syringe. The air was injected in a 12-ml pre-evacuated glass vial (exetainer gas testing vial; labco, high Wycombe, UK) closed with an airtight rub-ber septum. The overpressure produced in the vials elimi-nates contamination with ambient air. These vials contain-ing the gas samples were stored in a n2 atmosphere prior to analysis, which was performed no later than 7 days after sampling.
One day before Face launch on 30 July 2009, we col-lected 15 ml gas from all soil gas wells and all stem cups
to receive pre-treatment values. starting 1 day after Face onset, two soil gas wells per circle and tree and two cups per stem were randomly sampled. During the first 2 weeks, we sampled daily, thereafter biweekly until august 2009, fol-lowed by about a bimonthly sampling interval. starting in May 2010, the sampling intensity was reduced to one mixed 15-ml sample per soil circle from all five gas wells per cir-cle (each 3 ml per gas well) as well as one mixed sample of all four cups per tree stem (each 3.75 ml per cup).
We employed the Keeling plot approach (Keeling 1958) to obtain as correct as possible δ13c signals in the mixture
of two different cO2 sources, respiratory and atmospheric cO2, both diffusing in the opposite direction in the soil. We followed the approach by steinmann et al. (2004) to obtain atmospheric reference cO2 concentration data and the corresponding δ13c values from six different european/
Middle eastern weather stations (Terceira Island, azores, Portugal; storhofdi, Iceland; Tenerife, spain; Mace head, Ireland; Ocean station M, norway; WIs station, Israel) for the years 1997–2004. note that Face was applied to the canopy 15–37 m aboveground only; thus, tank cO2 did not reach the ground in the test area. For applying the Keeling plot approach, cO2 and δ13c values for free air in the years
2009–2011 were needed, which were not available when we analyzed our data. Therefore, we modeled the trend of the data with a seasonal component incorporated, using holt–Winters exponential smoothing (holt 1957).
c isotope analysis
Within 3–4 h after sampling, all tissue samples were dried at 80 °c for 48 h, followed by grinding to a fine powder using a steel ball mill (MM 2000; retch, haan, germany). aliquots of 0.6–0.8 mg were weighed into tin capsules and analyzed for c isotope ratios. The samples were combusted in an elemental analyzer (ea-1110 chn; carlo erba Ther-moquest, Milan, Italy). The ea was connected to an Iso-tope ratio Mass spectrometer (IrMs, Delta s; Thermo Finnigan, Bremen, germany) operating in continuous flow mode via a variable open-slit interface (conflo II; Thermo Finnigan). The precision for δ13c was <0.1 ‰. The isotope
values are expressed in the δ-notation as deviation from the international standard (Vienna-Pee Dee Belemnite: V-PDB): δ13c = R
sample/Rstandard − 1 (‰) where R is the
molar ratio of 13c to 12c for the sample and the standard,
respectively. The isotope analyses were performed at sta-ble Isotope Facility of the Paul scherrer Institute, Villigen, switzerland.
statistical analysis
The unit of replication was ‘tree’ (five trees under ambi-ent and five trees under elevated cO2 concentrations). all
statistical analyses (except for fungal δ13c) were performed
using linear mixed effects models fitted by restricted maxi-mum likelihood. The significance of the main effects was assessed using a backwards selection procedure based on likelihood ratio tests and the akaike information criterion. The factor ‘tree’ was included as random factor (apart from fungal δ13c). In certain cases, a second random
fac-tor nested within ‘tree’ was used (xylem δ13c: ‘year of the
start of branchlet segment growth’; fine root δ13c: ‘cardinal
direction of the position of the soil/ingrowth core’). Where appropriate, we corrected for homogeneity violations using adequate variance function structures (power, exponential, and constant variance structures, or a combination thereof). Furthermore, we accounted for independence violations where necessary by applying temporal autocorrelation structures. Diagnostic plots (i.e. residual and quantile– quantile plots) were used for model validation. all statisti-cal analyzes were performed using r, v.2-15-0 (r Develop-ment core Team 2008–2010) and the r package nlme.
Results
canopy δ13c and cO
2 concentration
assuming a δ13c signature of −8.4 ‰ and a cO
2
concen-tration of 390 ppm in the atmosphere (2009–2011 aver-age; nOaa), data from our regular measurements of tank cO2 (δ13c of −30 ‰), and canopy cO
2 data from the
Irga measurements, the expected δ13c value of the mixed
cO2 in the canopies of treated trees was −13.8 ± 0.3 ‰ (mean ± se of n = 3 years, i.e. 2009–2011). This value corresponds to an expected difference in δ13c between
ele-vated and ambient cO2 in the canopies of −5.4 ± 0.3 ‰
(mean ± se of n = 3 years, i.e. 2009–2011). The c4
grass isometer samples revealed a similar δ13c value of
−13.7 ± 0.1 ‰ (mean ± se of n = 3 years, i.e. 2009–
2011) in the canopies of the treated trees (δ13c difference
between elevated and ambient cO2: −5.3 ± 0.2 ‰), cor-responding to a canopy cO2 concentration of 538 ± 7 ppm (elevated cO2; mean ± se of n = 3 years, i.e. 2009–2011). Pre-treatment δ13c differences
Prior to the onset of Face (pre-treatment), tissues of trees later exposed to elevated cO2 concentrations
usu-ally showed slightly less negative δ13c signals compared
to control trees. needles and branchlet xylem of treated trees formed in 2008 and 2009 showed the highest devia-tions from control trees (0.8 ± 0.2 ‰ in sunlit needles, and 0.9 ± 0.2 ‰ in sunlit branchlets; Figs. 1, 2; no data for shaded needles and branchlets). These canopy signal differences attenuated downstream of the plant body. Tree
rings at breast height were first sampled in March 2010. Thus, earlier year rings might store some novel (fixed after 30 July 2009) non-structural carbon in ray tissue causing a slightly more negative bulk xylem signal. yet, earlywood formed in 2005 to earlywood formed in 2009 of trees later subjected to elevated cO2 still showed a slightly less (not significantly) depleted δ13c signal compared to control
trees (0.3 ± 0.1 ‰; Fig. 3), suggesting little if any influ-ence of novel c by March 2010. Fine roots were not sam-pled before Face. respiratory cO2 sampled before Face showed either no δ13c differences (0.1 ‰ in soil cO
2
efflux; P = 0.7; Fig. 7), or even more negative δ13c
sig-nals (0.9 ‰ in stem cO2 efflux; P = 0.03; Fig. 6) in trees later subjected to elevated cO2 concentrations versus con-trol trees, thus not matching the pre-treatment signals in branchlet tissues. given these small and inconsistent trends in pre-treatment δ13c, we did not correct δ13c signals
obtained after the onset of Face by pre-treatment signals, with the assumption that the deviations fall within the error margins. This approach is conservative, because the pre-treatment trend rather runs counter the direction of tracer signals. FACE 2009 FACE2010 FACE2011 −34 −32 −30 −28 −26 −24 Date of sampling δ 13C (‰) Needles built in 2008 FACE 2009 FACE2010 FACE2011 −34 −32 −30 −28 −26 −24 Needles built in 2009 FACE 2009 FACE2010 FACE2011 −34 −32 −30 −28 −26 −24 Needles built in 2010 FACE 2009 FACE2010 FACE2011
Jul Sep Nov Jan Mar May Jul Sep Nov Jan Mar May Jul Sep −34 −32 −30 −28 −26 −24 Needles built in 2011 ambient sun elevated sun ambient shade elevated shade
Fig. 1 seasonal variation of carbon isotope signature (δ13c) in
organic matter of sun-exposed and shaded needles of Picea abies trees exposed to ambient and elevated atmospheric cO2 [ambient cO2: n = 2 trees (except for 8 July 2009, 22 august 2009, 29 sep-tember 2010, 29 July 2011: n = 5 trees), elevated cO2: n = 5 trees,
mean ± se]. Diagrams denote needles that were built in the year (from top to bottom) 2008, 2009, 2010, and 2011, respectively. The
gray-shaded areas denote the main Face periods. During the
win-ter dormancy periods, cO2 enrichment was performed at favorable weather conditions only
δ13c in needles
generally, needles of trees subjected to elevated cO2 always showed more negative c-isotope signals com-pared to trees under ambient cO2 during the treatment
period (‘cO2 treatment signal’ effect: P < 0.004; Table 2; Fig. 1), with a significant ‘exposure × cO2 × day of
year’ interaction (P < 0.001). Furthermore, signals did not become significantly stronger with time within an age cohort and exposure class (‘exposure × day of year’ effect: P = 0.063). however, isotopic signals became more negative from one needle age class to the next (Fig. 1); the younger the needles, the more pronounced was the
δ13c difference between needles of trees under ambient
and elevated cO2. sampled during cO2 enrichment,
nee-dles of cO2-enriched trees which were formed prior to the experiment (e.g., needles formed in 2008 and 2009; Fig. 1), showed more negative δ13c values by 1.1 ± 0.1 ‰ (mean
treatment difference ± se) compared to controls, irrespec-tive of the position in the canopy, suggesting an exchange of non-structural carbohydrates (nsc) by new ones.
sampled during the Face period, shaded needles exposed to elevated cO2 showed a progressive mean
deple-tion from 1.0 ± 0.1 ‰ (needles formed in 2008 and 2009; Fig. 1), to 2.6 ± 0.2 ‰ (needles formed in 2010; Fig. 1), and to 3.8 ± 0.6 ‰ (needles formed in 2011; Fig. 1) com-pared to needles in ambient cO2. sunlit needles formed
during Face, and sampled after the onset of Face, were even more depleted under elevated cO2 by 1.2 ± 0.1 ‰ (needles formed in 2008 and 2009; Fig. 1), 4.5 ± 0.1 ‰ (needles formed in 2010; Fig. 1), and 6.2 ± 0.3 ‰ (needles formed in 2011; Fig. 1) compared to sunlit needles of con-trol trees.
In control trees, shaded needles were always more depleted compared to sunlit needles on the same trees, irrespective of the year of needle formation (1.3 ± 0.1 ‰;
P < 0.001; Table 2). The same pattern was observed for treated needles formed prior to Face initiation (i.e. formed in 2008 and 2009), and sampled during Face (1.1 ± 0 ‰;
P < 0.001; Table 2). Interestingly, this did not apply to needles grown under elevated cO2 in 2010 and 2011. here, shaded needles showed less negative δ13c values by
0.5 ± 0.1 ‰ compared to sun-exposed needles.
averaged over samples collected during the entire Face period, sunlit and shaded needles formed prior to Face (e.g., 2008 and 2009) incorporated a steady state 20 ± 0.2 % new c during the treatment years 2009–2011. Only 2 years after the Face onset, we measured 72–117 % new c in needles formed in 2011 compared to the isometer reference signal (see “Materials and methods”). Drawing on new assimilates was intensified in sunlit needles. Over-all, the amount of c incorporated did not vary at a given type of position once new needles had fully matured.
δ13c in branchlet xylem
For statistical analysis, we used only xylem δ13c of
branch-let segments of the most recent shoot expansion, thus
FACE FACE FACE
Ambient CO2 − branchlet origin: 2008 Ambient CO2 − branchlet origin: 2009 Ambient CO2 − branchlet origin: 2010 Ambient CO2 − branchlet origin: 2011 Elevated CO2 − branchlet origin: 2008 Elevated CO2 − branchlet origin: 2009 Elevated CO2 − branchlet origin: 2010 Elevated CO2 − branchlet origin: 2011
2009 2010 2011 −34 −32 −30 −28 −26 −24 Branchlet xylem δ 13C (‰) Date of sampling
Fig. 2 Time course of the δ13c of sun-exposed branchlet xylem of
P. abies exposed to ambient and elevated atmospheric cO2 (ambient
cO2: n = 5 trees, elevated cO2: n = 5 trees, mean ± se). The
gray-shaded areas denote the main Face periods. During the winter
dor-mancy periods, cO2 enrichment was performed at favorable weather
conditions only. note that the branchlet origin indicated in the dia-gram corresponds to the year when new branch segments were initi-ated. In the following years, new year rings were produced that add to branch segment thickening leading to dilution of the isotopic signal
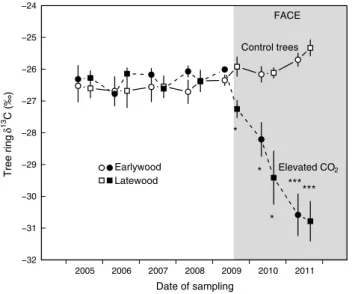
FACE 2005 2006 2007 2008 2009 2010 2011 −32 −31 −30 −29 −28 −27 −26 −25 −24 Tree ring δ 13C (‰) Date of sampling Earlywood Latewood Control trees Elevated CO2 * * * ******
Fig. 3 seven-year time course of δ13c values in earlywood and
late-wood of P. abies subjected to ambient and elevated atmospheric cO2
(n = 5 trees, mean ± se). The gray-shaded area denotes the Face period. *P < 0.05, **P < 0.01, ***P < 0.001
grown exclusively under elevated cO2 (i.e. without “con-tamination” of the underlying xylem and reserves from pre-vious years). Over the entire experimental period, branch-let xylem segments collected on control trees showed stable δ13c signals of −26.1 ± 0.1 ‰, irrespective of the
age classes and the sampling date (Fig. 2). In contrast, iso-topic signals of branchlet xylem segments formed under elevated cO2 became consistently more negative over time compared to control tree branchlets (‘cO2 × day of year’ interaction: P < 0.001; Table 2). This trend was more pronounced, the younger a branchlet segment: when sampled in July 2011, branchlet segments showed δ13c
signals of −28.4 ± 0.4, −30.3 ± 0.7, −31.6 ± 0.7, and
−32.7 ± 0.9 ‰ (initiated in 2008, 2009, 2010, and 2011,
respectively). These values correspond to δ13c differences
between elevated cO2 and ambient cO2 of 2.3, 4.3 5.5, and 6.8 ‰ for branchlet segments initiated in 2008, 2009, 2010, and 2011, respectively. hence, the isotopic signals of the branchlet segments initiated in 2010 and 2011 were even stronger than would be expected compared to the 100 % new c incorporation estimated by isometer δ13c signals
(44, 81, 103, and 127 % new c relative to the isometer signal).
δ13c in stem wood
Within just a few months after the start of cO2
enrich-ment, newly assimilated c could be detected in latewood
Table 2 linear mixed effects model results for Picea abies 13c
sig-natures of needles, branchlet xylem, year rings, fine roots (soil cores 2010 and ingrowth cores 2010-2011), fungi, and cO2 efflux from stems and soil under ambient and elevated cO2
* P < 0.05, ** P < 0.01, *** P < 0.001 Factor df F value P needle δ13c (2009–2011) exposition 1, 128 700.6 <0.001 *** cO2 1, 8 16.3 0.004 ** Day of experiment 1, 128 64.6 <0.001 *** exposition × day of experiment 1, 128 3.5 0.063 cO2 × day of experiment 1, 128 58.8 <0.001 *** exposition × cO2 × day of experiment 1, 128 34.0 <0.001 ***
Branchlet xylem δ13c (2009–2011) cO2 1, 8 0.5 0.498 Day of experiment 1, 9 43.8 <0.001 *** cO2 × day of experiment 1, 10 96.5 <0.001 *** year ring δ13c (2005–2011) latewood/earlywood 1, 124 0.1 0.716 cO2 1, 8 16.6 0.004 ** year 1, 124 0 0.891 latewood/earlywood × cO2 1, 124 8.7 0.004 ** latewood/earlywood × year 1, 124 0.9 0.336 cO2 × year 1, 124 19.1 <0.001 *** latewood/earlywood × cO2 × year 1, 124 10.0 0.002 **
Fine root δ13c (soil cores 2010)
Diameter 2, 54 12.9 <0.001 ***
Fine root δ13c (ingrowth cores 2010–2011)
cO2 1, 8 28.0 0.001 ***
Diameter 2, 40 3.8 0.032 *
soil cores 1, 40 0.1 0.709
cO2 × diameter 2, 40 0.8 0.448
cO2 × soil cores 1, 40 8.9 0.005 **
Diameter × soil cores 2, 40 1.0 0.370 cO2 × diameter × soil cores 2, 40 3.8 0.030 *
Fungal δ13c (2010 + 2011)
Distance 1 7.3 0.008 **
Fungal type 1 46.2 <0.001 ***
Distance × fungal type 1 8.8 0.004 **
stem air δ13c (2009–2011) cO2 1, 8 2.1 0.190 Day of experiment 1, 334 184.8 <0.001 *** cO2 × day of experiment 1, 334 22.0 <0.001 *** soil air δ13c (2009–2011) stem distance 1, 801 1.7 0.193 cO2 1, 8 18.0 0.003 ** Day of experiment 1, 801 0.4 0.510 stem distance × cO2 1, 801 0.8 0.385
stem distance × day of experiment 1, 801 35.2 <0.001 *** cO2 × day of experiment 1, 801 0 0.833
stem distance × cO2 × day of
experiment 1, 801 6.9 0.009 ** −32 −31 −30 −29 −28 −27 −26 −25 −24 Soil cores − March 2010 1 − 2
Total fine root
δ
13 C (‰)
Root diameter classes (mm)
Ambient CO2
Elevated CO2
Ingrowth cores March 2010 − Dec 2011
< 0.5 0.5 < 1 < 0.5 0.5 < 1 1 − 2
Fig. 4 δ13c of fine roots under P. abies trees exposed to ambient and
elevated 13c-depleted cO
2 (n = 5 trees, mean ± se). Left panel fine
roots were excavated 8 months after the Face onset on 30 July 2009 (with soil cores). Right panel δ13c of fine roots that were produced
exclusively during the Face experiment from March 2010 to Decem-ber 2011 (ingrowth core method)
of 2009 (isotopic depletion of 1.3 ‰ compared to control trees; Fig. 3). signals became more negative over time, leading to a treatment-related difference in δ13c of 5.5 ‰
in latewood of 2011, which corresponds to full (in fact, 103 % compared to isometers) newly incorporated c only 2.5 years after the onset of Face. The cO2 treatment
sig-nal was highly significant (P = 0.004; Table 2) with a clear ‘cO2 × year’ interaction (P < 0.001), reflecting the increas-ing incorporation of new 13c depleted c with time.
δ13c in tree fine roots
P. abies fine roots from soil cores, collected 8 months after the onset of Face, did not differ in δ13c between
treat-ments (not significant), but the δ13c signals in the three
fine root diameter classes were distinct from another (P = 0.001; Table 2; Fig. 4).
cO2 enrichment had a highly significant effect on
the c isotope signal in new fine roots that were formed entirely during the Face period (ingrowth cores over a period of 20 months, installed in March 2010; P = 0.001; Table 2; Fig. 4). at 28 months after Face launch, new fine roots of ingrowth cores were 2.6 ‰ (<0.5 mm), 3.0 ‰ (0.5 < 1 mm), and 2.7 ‰ (1–2 mm) more negative com-pared to roots sampled from control trees (Fig. 4). These values correspond to 49–56 % new c incorporated into fine roots under elevated cO2 (relative to isometer signals; Table 2). Further, the δ13c signals in new fine roots
belong-ing to different diameter classes also differed significantly, irrespective of the treatment (P = 0.032).
δ13c in fungal sporocarps
altogether, 65 saprobiotic, 51 mycorrhizal, but only 2 para-sitic, fungal species were collected during the years 2010 and 2011 in this mixed forest. Only four of the mycorrhizal species are known to be exclusively connected to P. abies. nevertheless, the analysis included all mycorrhizal fungal species. Fungi collected at >18 m distance to the treated trees are assumed not to be influenced by our labeling. Therefore, the isotopic values of these fungi served as a control (Keel et al., in preparation). Mycorrhizal fungi col-lected closer to the tree base of cO2 exposed trees showed more negative isotopic signatures compared to fungi col-lected at greater distance (−27.3 ± 0.5, −26.7 ± 0.3, and
−26.0 ± 0.6 ‰ in 2010, and −27.7 ± 0.3, −25.6 ± 0.2,
and −25.5 ± 0.3 ‰ in 2011 for the <6, <12, and <18 m distances, respectively; Fig. 5). however, the isotopic dif-ferences between the fungi at <6 m distance and the con-trol fungi indicate only 26 % (in 2010) and 43 % (in 2011) new c incorporation. Mean δ13c in all saprobiotic
sporo-carps was very similar regardless of the sampling distance from cO2-enriched trees, suggesting no incorporation of
new c delivered by the treated trees during that period (−24.4 ± 0.1 ‰ in each year; Table 2; Fig. 5). as a con-sequence, the isotopic difference between mycorrhizal and saprobiotic fungi increased with proximity to cO2-enriched trees across all sampled individuals (3.5, 1.9, and 1.7 ‰
−30 −29 −28 −27 −26 −25 −24 −23 −22 2010 < 6 < 12 < 18 Fungal δ 13C (‰)
Distance to trees under elevated CO2 (m)
n=22 n=9 n=19 n=6 n=19 n=6 Saprophytic fungi Mycorrhizal fungi 2011 < 6 < 12 < 18 n=19 n=17 n=10 n=12 n=9 n=9
Fig. 5 δ13c of saprobiotic (white bars) and mycorrhizal (dark bars)
fungal sporocarps (mean ± se; n = number of fungal species) col-lected in fall of the years 2010 (left panel), and 2011 (right panel). sporocarps were sampled at various distances to stems of cO2
-enriched trees, and are grouped into three distance classes
E C A F E C A F E C A F Ambient CO2 Elevated CO2
Aug Oct Dec Feb Apr Jun Aug Oct Dec Feb Apr Jun Aug −40 −38 −36 −34 −32 −30 −28 −26 −24 −22 Stem efflux δ 13C (‰) Date of sampling ****** *** * ** **** ** ** ** ** ** * * *** ** . 1 1 0 2 0 1 0 2 9 0 0 2
FACE − first 30 days
* . *** ** ** ** ** ***
31. Jul 2009 10. Aug 2009 20. Aug 2009 30. Aug 2009
−30 −29 −28 −27 −26 −25
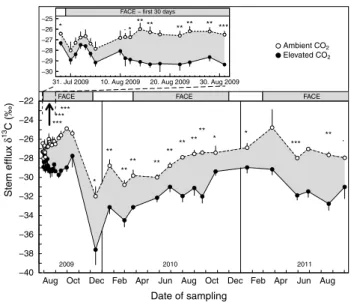
Fig. 6 seasonal variation of δ13c in stem cO
2 evolution of P. abies
trees exposed to ambient and elevated atmospheric cO2 (n = 5 trees, mean ± se). Inset enlarges the first month of the Face experiment (august 2009). The gray bars on top of the panels denote the main Face periods. During the winter dormancy periods, cO2 enrich-ment was performed at favorable weather conditions only. *P < 0.05, **P < 0.01, ***P < 0.001
in 2010, and 3.3, 1.4, and 0.8 ‰ in 2011 for the <6, <12, and <18 m distances, respectively). This is supported by a significant ‘distance × fungal type’ interaction (P = 0.004; Table 2).
δ13c in cO2 released from stems and soil
Thirteen days after Face was started, the isotopic sig-nal in stem cO2 efflux was 2 ‰ lower for trees exposed to elevated cO2 than in control trees (not corrected for the
0.9 ‰ pre-treatment difference obtained during the 3 days before the onset of Face). subsequent measurements (mid-august 2009–October 2011) showed a significantly lower δ13c value of 3.4 ± 0.2 ‰ (64 % recently fixed c) in
cO2 released from stems of treated trees, with a significant seasonal trend of the isotopic signal (P < 0.001; Table 2). a steep drop of the isotopic signal irrespective of the treat-ment occurred for no obvious reason during winter dor-mancy 2009/2010 (by 5.9 and 6.6 ‰ for both ambient cO2 and elevated cO2, respectively; Fig. 6). Thereafter, stem signals recovered during the course of the 2010 season. In the following winter, no such decline could be observed although weather conditions were similar.
There were clear c-isotope signals in cO2 released from soils (Fig. 7). First significant deviations between ambient and elevated cO2 were observed 12 days after
the start of the Face treatment in 2009. The time lap was similar to that in stem air δ13c. however, the mean
differ-ence between control and treatment was only 0.6 ‰ by that
time (Fig. 7), which accounts for ca. 10 % new c emerging from soil air at this early stage of the experiment. During the entire campaign (starting with the first significant dif-ferences 12 days after the onset of Face), cO2 enrichment significantly reduced δ13c in cO
2 released from soil under
trees exposed to elevated cO2 by 1.0 ± 0.1 ‰,
correspond-ing to ca. 15 % new c incorporated (P = 0.002; Table 2). During the winter period 2009/2010, a drop in δ13c, very
similar to that seen in stem-emitted cO2, was observed for both ambient and elevated cO2. This signal even persisted
through the early spring season until July 2010. During this period, only minor and non-significant differences in δ13c
between ambient and elevated cO2 were found. however, from June 2010 onwards, soil air δ13c under elevated cO
2
was significantly depleted compared to soil air δ13c under
ambient cO2 (august 2010–October 2011 mean reduction: 1.2 ± 0.1 ‰), which represents 22 % new c. The maxi-mum reduction was 1.8 ‰ in august 2011, which corre-sponds to ca. 34 % of recently fixed c. Furthermore, we observed stronger 13c signals in soil air collected at 2 m
distance to a tree base compared to 3 m distance, further affected by the day of the experiment (P < 0.001; Table 2).
Discussion
canopy-scale cO2 enrichment has the advantage that the added cO2 has a low δ13c value (−30 ‰), which made
it possible to quantify the fate of new photoassimilates in 37-m-tall P. abies trees in a natural mixed forest ecosystem at a high temporal and spatial resolution. This is the first whole-tree (from the needle to the soil) long-term assess-ment of the fate of c in tall trees in a natural forest. The intrinsic caveat of using continuous isotope labeling by canopy cO2 enrichment is that these signals cannot be compared to controls (trees under ambient cO2 concentra-tions but exposed to the same isotopic ratio as trees under elevated cO2). elevated cO2 might enhance some transfer
processes; hence, the dynamics of c-transfer reported here might be somewhat faster rather than slower, as compared to trees growing under a current atmospheric cO2 concen-tration of 395–400 ppm. On the other hand, the current cO2 concentration is 40 % higher than when these trees were seedlings, and the system (both treated and control trees) may be at or close to cO2 saturation, suggesting the c-transfer rates observed here may be a reasonable approx-imation of current ‘normal’ tree behavior (leuzinger and Bader 2012). Irrespective of the potential deviations this may incur, our data illustrate the spatial and temporal dis-tribution pattern of freshly assimilated c in such tall trees, and how fast new c is replacing old c.
Our data indicate different rates of integration of new assimilates into the various compartments analyzed. new
FACE FACE FACE Ambient CO2 Elevated CO2 Soil efflux δ 13C (‰) Date of sampling ** . *** ** *** ** *** ** . * *** ** 2011 2010 2009
Aug Oct Dec Feb Apr Jun Aug Oct Dec Feb Apr Jun Aug −36 −34 −32 −30 −28 −26 . * ** *** * *** .
FACE − first 30 days
31. Jul 2009 10. Aug 2009 20. Aug 2009 30. Aug 2009
−30 −29 −28 −27 −26
Fig. 7 seasonal variation of δ13c in soil cO
2 evolution at 3–11 cm
depth under trees exposed to ambient and elevated atmospheric cO2
(n = 5 trees, mean ± se). Inset enlarges the first month of the Face experiment (august 2009). The gray bars on top of the panels denote the main Face periods. During the winter dormancy periods, cO2
enrichment was performed at favorable weather conditions only. *P < 0.05, **P < 0.01, ***P < 0.001
foliage and branchlet xylem were built almost exclusively by new photoassimilates when grown in the first spring with Face. Tree rings took almost 2.5 years until the new tissue consisted entirely of new assimilates. however, late-wood of the first season already showed a strong signal a few weeks after the onset of Face. In contrast, new fine roots seem to utilize more of the old, mobile c pools, and their isotope signal was only half of what we found in the needles after 28 months (ingrowth core data), indicating a slower c turnover than in aboveground tissue. The 13c
iso-tope signal rapidly appears in respiratory cO2, revealing clear signals from stems and soil within the first 2 weeks of canopy cO2 enrichment. however, the isotopic signal never reaches the magnitude of that in fresh assimilates (as found in needles, branchlets, and tree rings); hence, it reflects the lasting influence of older stored c sources in these cO2 -releases. In the following, we will discuss in detail the iso-tope signals observed in the various compartments.
needles
sun-exposed needles always showed less negative δ13c
values than shaded needles, which is related to the sun-to-shade difference in the stomatal conductance to photo-synthesis ratio (Kaufmann 1982). In shaded plants or plant parts, the ratio of the leaf internal to atmospheric cO2
con-centration (ci/ca) is greater than in sun-exposed leaves due to a lower photosynthetic rate and/or higher stomatal con-ductance (Farquhar et al. 1982). a higher ci/ca leads to a higher discrimination of the 13c isotope (i.e. becomes more
negative), which is the case with decreasing irradiance and photosynthesis (livingston et al. 1998).
The initial δ13c signals in response to Face in needles
produced prior to cO2 enrichment (i.e. in 2008 and 2009)
must reflect the isotopic signature of nsc and other mobile components of needle tissue (Marshall and linder 2013). In
P. abies, needles contain ca. 10–27 % of nsc (hoch et al. 2003; schädel et al. 2010). This pool was most likely replaced by new c within a few weeks (Keel et al. 2007), correspond-ing to the 17–23 % of new c found in our bulk sample of old (pre-treatment) grown needles by October 2011, compared to isometer signals. The difference in δ13c between trees under
elevated and ambient cO2 was clearly bigger in old sun-exposed needles relative to old shaded needles (formed prior to Face), which is related to higher photosynthetic rates and loading with fresh assimilates (roberntz and stockfors 1998), and faster turnover of the non-structural c pools.
In contrast, needles formed during cO2 enrichment (i.e. in 2010 and 2011) showed much more negative δ13c
val-ues, due to the inclusion of new structural c compounds. Our results indicate that new sun-exposed needles were almost completely self-sustaining (all the new tissue is composed of new c), in line with the branch autonomy
theory (gordon and larson 1968). In contrast, shaded nee-dles depended more on ‘old’ c than sun-exposed neenee-dles.
all needle age classes exhibited slight seasonal variations with less negative δ13c values in spring compared to
sam-ples analyzed later in the year. We attribute this seasonality in δ13c to fluctuations in nsc concentration (Flower-ellis
1993; hoch et al. 2003; schädel et al. 2009), resulting in rel-ative shifts of tissue compounds that differ in their isotopic signals. During needle growth and maturation, the concen-tration in lignin, cutin, waxes, and lipid-related compounds increases. lignin and lipids show more negative δ13c signals
relative to bulk needles and cellulose (Bowling et al. 2008). Thus, the δ13c signal of bulk samples should decline even
without cO2 enrichment. Indeed, we found ca. 1 ‰ more
negative δ13c signals in mature, 1-year-old needles,
com-pared to immature needles, which we attribute to the utili-zation of fresh (early spring) assimilates such as sugars and starch (less negative in δ13c relative to bulk needles) for
pri-mary growth before needles reach c autonomy (Jäggi et al. 2002). a slight age-related decline in photosynthesis (Free-land 1952; Warren 2006) may contribute to that signal. Branchlet xylem
By the time Face was initiated on 30 July 2009, ear-lywood formation in branchlets and stems was already completed; therefore, we assume that only latewood and recently assimilated non-structural c compounds could be responsible for the 13c drop by 0.7–1.3 ‰ in fall 2009.
In the following years, δ13c in branchlets incorporated a
stronger signal, since secondary growth adds new xylem layers on top of older-year rings. We assume branchlets to be c autonomous, that is, largely c-supplied by the nee-dles without utilizing stored c from other parts of the tree body (Watson and casper 1984; sprugel et al. 1991; spru-gel 2002). Our results suggest that, even in mature trees, primary branchlet formation is mediated almost entirely through new photosynthates produced by new and older needles, with only marginal usage of stored c during the very first stages of branchlet formation (sprugel 2002; hoch and Keel 2006).
Tree rings
Tree ring isotope signals indicate a significant but still small contribution (23 %) of novel c to latewood formation in the first treatment season (2009). The gradual δ13c depletion in
tree ring sections of the following years suggests that it takes at least 2 years for novel c to replace all c reserves that feed into xylogenesis. We had not accounted for pre-treatment dif-ferences given that we took wood core samples 8 months after the onset of Face; thus, possible contamination of older-year rings with new assimilates through ray parenchyma cannot
be excluded, but, similar to Marshall and linder (2013), we see no significant influence of novel c on δ13c in
pre-treat-ment tree rings. Prior to Face (i.e. from 2005 until 30 July 2009), there was, however, very little variation in δ13c signals
between early- and latewood given the continuous supply of new photoassimilates due to a nearly permanent photosyn-thetic season of such evergreen conifers (similar to observa-tions by Jäggi et al. 2002). accordingly, we found δ13c of
early- and latewood of the same year strongly (1:1) correlated in 2005–2011 (R2 = 0.773; P < 0.001).
Fine roots
In control trees, the δ13c isotope signal of −27.5 ‰ in fine
roots marks the midpoint of the range reported by others (Boström et al. 2007; richter et al. 2009; andersen et al. 2010), and is 1.1 ‰ less negative than in sunlit needles. This is a general pattern within plants (hobbie et al. 2002; Badeck et al. 2005), and reflects, for instance, the known downstream post-photosynthetic fractionation processes, resulting in a cumulative enrichment during the assimi-late transport from needles to roots and/or plus a change in chemical constituents with less negative δ13c (e.g.,
dominance of starch and lignin; hobbie and Werner 2004; Badeck et al. 2005; cernusak et al. 2009). The consider-able delay in the appearance of new 13c-depleted c in the
organic matter of fine roots originating from the added cO2 suggests that photoassimilates are not directly fed into new root growth. We found no signal in March 2010, although cO2 enrichment started on 30 July 2009. a rather weak
signal compared to other tissues was found at the end of 2011 (2.6–3.0 ‰ difference between elevated and ambient cO2). This does not contradict the significance of recent photosynthetic activity for root growth, but rather suggests that new assimilates enter a pool of mobile c reserves prior to structural investment in roots (hansen and Beck 1994; hobbie et al. 2002). This dilution effect of new c by old c and, therefore, the pool of older photoassimilates can be substantial, as was already concluded for deciduous tree species at the same site (Keel et al. 2007).
The strong incorporation of old c pools (from reserves) in root formation makes it impossible to infer the root age from the fraction of new versus old c in new roots, except with the 14c radiocarbon method. In our case, however,
we found that roots could not be older than 20 months (ingrowth cores), but their mixed tissue isotope signal would suggest several years of age (while in reality, some roots may have been only a few weeks old at harvest). Fungal signals
ectomycorrhizal basidiocarp formation is believed to be entirely dependent on the provision of new photoassimilates
by trees (högberg et al. 2001, 2010). In the light of this, the c isotope signals of ectomycorrhizal basidiocarps found in the main rooting sphere (<6 m radius) indicate a surpris-ingly small fraction of only 26–43 % new c provided by our
P. abies trees in 2010 and 2011, respectively, but it matches the measured 13c content in fine roots. This also holds for
fungal species known to be host specific to P. abies (in these species, 43–50 % of c is new). since these fungi may serve several hosts (Brownlee et al. 1983), a signal dilution with c from non-cO2-enriched trees with overlapping root spheres
is likely because our Picea trees were neighbored by Fagus,
Quercus, and Carpinus trees. This is reflected in the stead-ily decreasing signal strength with increasing distance to the cO2-enriched Picea trees. Moreover, we assume that
the only partial labeling of fungi associated with our treated trees has to do with c-assimilate mixing (new assimilates mixed with old, stored carbohydrates) in the tree before export, possibly isotopically enriched by post-photosyn-thetic fractionation processes within the plant body, fol-lowed by further 13c enrichment during fungal chitin
syn-thesis (sensu gleixner et al. 1993). as in earlier assessments on this site (steinmann et al. 2004; Keel et al. 2006), we found a clear distinction between ectomycorrhizal and sap-robiotic fungi, with the latter carrying no new c label, hence entirely relying on ‘old’ c.
respiratory signals
13c signals in cO
2 released from stems were very similar to
those in soil cO2, both in terms of signal magnitude as well
as temporal variation (R2 = 0.46, P < 0.001). The close
correlation of δ13c in soil cO
2 and δ13c in stem efflux
may indicate a simultaneous appearance of cO2 respired from new assimilates in stems and their surrounding soils, despite the different path lengths of assimilate transport. cO2 diffusion in stem tissues may be slower compared to soil cO2, caused by stem–internal diffusion barriers (etzold et al. 2013). yet it is remarkable that the cO2 released from
metabolic processes appears more or less at the same time, which strongly indicates that the c supply for these pro-cesses has a high priority. We assume that the δ13c
contri-bution of cO2 transported by sapflow from the rooting zone
to the stem surface is small (Ubierna et al. 2009b), and that it would not affect the timing of the signal.
The seasonal trends in isotopic signals differed from year to year, unlike the tri-phase pattern reported for mature P.
abies by Kuptz et al. (2011b). since about half of the stem cO2 efflux results from recent photoassimilates, we assume that the other half is from older storage pools, and that the contribution of these two pools did not significantly change over the study period. We cannot explain the observed δ13c
depression in soil and stem cO2 efflux in the first but not the second winter, since we can exclude methodological
problems, and moisture or temperature regimes did not dif-fer between the two winters. What makes this phenomenon even more difficult to understand are the results of Maun-oury et al. (2007), who found δ13c values of stem efflux to
become more negative with rising temperatures, which is in contrast to the pattern that we observed in our study where values became more negative in winter, despite discontinu-ation of cO2 enrichment during the coldest 3 months.
soil air took 12 days after starting canopy cO2 enrichment to exhibit a small but clear 13c signal. This confirms a rapid
transfer of new c to the rhizosphere. The time lag between c assimilation and soil c release exhibited by our trees is larger than the 5–6 days that were reported for late summer signals in 22-m-high P. abies (ekblad et al. 2005). however, assum-ing a mean transfer velocity of 0.14 m h−1 (Jensen et al. 2012), one would expect 11- to 12-day lags for our 37-m-tall trees, which is consistent with our findings, and what was found by steinmann et al. (2004) for broad-leaved trees. Our data thus support the significance of path length for c transfer in P. abies (Mencuccini and hölttä 2010). It appears that c release via soil microbiota (including mycorrhiza) and struc-tural growth in roots, both strongly depend on c pools older than 3 years. The rapid signal appearance in soil cO2 sug-gests a strong coupling of sinks and sources, but the low frac-tion of new c in cO2 release (maximum of 34 % 2 years after Face onset) highlights the significance of a large, sustained contribution of old c pools to soil cO2 release (steinmann et al. 2004; Keel et al. 2006; Kuptz et al. 2011a).
soil cO2 in the control plots had more negative δ13c
than roots, a widely observed pattern in c3 plants (Klumpp
et al. 2005; Zhu and cheng 2011), reflecting additional 13c
fractionation (−1.2 ‰) during root metabolism, root decay, and microbial activity (Boström et al. 2007; Werth and Kuzyakov 2010; Brüggemann et al. 2011).
Conclusions
In line with our hypothesis, we conclude that new c is rap-idly (within 12 days) allocated to belowground organs and metabolized in respiratory processes. yet, the further away from the crown (source) the greater the fraction of old c that contributes to new growth and c release (sink). Our work alludes to the branch c-autonomy hypothesis, and warns at expecting a tight isotopic linking between concur-rent photosynthesis and tree ring formation (gessler et al. 2009), and root growth (and, presumably, root metabolism) depending on several years old, stored carbohydrates. a clear distinction needs to be made between the rapidity of the new c signal appearance and the quantitative contribu-tion of new c to sink activity.
Overall, tree growth and metabolic processes in stems and soils reflect a legacy signal of c pools older than
3 years. It does not seem that the delay of novel c invest-ment in stems and belowground sinks such as fine roots reflects a transport problem. We rather suggest that most novel c passes through a large non-structural c pool closely associated with the phloem conduits, rather than being invested directly, irrespective of whether or not trees are c saturated. such a large turnover of non-structural c pools from phloem to storage and back to phloem must incur a substantial metabolic cost, the tradeoff of which may be a highly buffered c provision system in the case of c limitation under stress. Our data show that the nee-dle c pool is turned over within a few late-season weeks. It has been shown for leaves in the top of a tropical for-est in Panama that it takes less than 6 days to completely replace this mobile c pool (Würth et al. 1998). Our analy-sis underlines the central role of intermediary mobile c pools in tree growth and metabolism. This strategy may be an evolutionary legacy from a predominantly low cO2
world (only 180 ppm cO2 at the end of the last glaciation), and may have lost its functional significance under current and future high cO2 concentrations. We may speculate that the extra c assimilated by trees exposed to elevated cO2
may cause an enhanced turnover (in terms of mass of c compounds) along the phloem path and associated paren-chyma in both xylem and phloem. Distributed across the entire tree, the signal of the associated metabolism (respira-tion) may be too small to be detected per unit of tissue, but it may be large enough to explain a substantial part of the ‘missing carbon’ in trees exposed to elevated cO2 that do not exhibit a growth rate, which is matching their photo-synthetic stimulation.
Acknowledgments We greatly appreciate help from M. saurer and K. lötscher at the Paul scherrer Institute for c isotope analyses, e. amstutz for crane operation and Face maintenance, georges grun for Face supervision, Olivier Bignucolo and several student help-ers for their support in data collection and sample processing (nota-bly Martin Trischler as part of his Master thesis), and rigobert Keller and members of the Mycological association Basel for fungal taxo-nomic classification. This project was funded by the swiss national science Foundation (grants 31003aB-126028 and 31003a_140753, 31-67775.02, 3100-059769.99, 3100-067775.02, and 3100aO-111914/1). The crane was sponsored by the swiss Federal Office of the environment (FOen).
References
ainsworth ea, rogers a (2007) The response of photosynthesis and stomatal conductance to rising cO2: mechanisms and environ-mental interactions. Plant cell environ 30:258–270
andersen cP, ritter W, gregg J, Matyssek r, grams Tee (2010) Below-ground carbon allocation in mature beech and spruce trees following long-term, experimentally enhanced O3 exposure in southern germany. environ Pollut 158:2604–2609
andrews Ja, harrison Kg, Matamala r, schlesinger Wh (1999) separation of root respiration from total soil respiration using 13c