HAL Id: insu-00600382
https://hal-insu.archives-ouvertes.fr/insu-00600382
Submitted on 14 Jun 2011HAL is a multi-disciplinary open access archive for the deposit and dissemination of sci-entific research documents, whether they are pub-lished or not. The documents may come from teaching and research institutions in France or abroad, or from public or private research centers.
L’archive ouverte pluridisciplinaire HAL, est destinée au dépôt et à la diffusion de documents scientifiques de niveau recherche, publiés ou non, émanant des établissements d’enseignement et de recherche français ou étrangers, des laboratoires publics ou privés.
Experimental constrains on shear-induced crystal
breakage in magmas
Mélanie Forien, Laurent Arbaret, Alain Burgisser, Rémi Champallier
To cite this version:
Mélanie Forien, Laurent Arbaret, Alain Burgisser, Rémi Champallier. Experimental constrains on shear-induced crystal breakage in magmas. Journal of Geophysical Research, American Geophysical Union, 2011, 116 (B08217), pp.1-21. �10.1029/2010JB008026�. �insu-00600382�
Experimental constrains on shear-induced crystal
breakage in magmas
Mélanie Forien
1*, Laurent Arbaret
1, Alain Burgisser
1and Rémi Champallier
11 Institut des Sciences de la Terre d’Orléans (ISTO), UMR 6113 – CNRS/Université d’Orléans/Université François Rabelais Tours, 1A rue de la Férolerie, 45071 Orléans, France.
*
Abstract
Crystal breakage occurs along margins of conduit walls and basal zones of lava flows. It is usually interpreted as flow-related textures developed at large finite strains and strains rates. We have investigated the grain size and shape distributions in an experimentally deformed crystal-melt suspension in order to constrain the temperature T, the strain γ and the strain rate γr ranges of the crystal breakage process.
The starting crystal-melt suspension is composed of a haplogranitic melt with 54 vol% alumina crystals. Torsion experiments were performed in a gas medium Paterson apparatus at 300 MPa confining pressure and subsolidus temperatures. Crystal size distribution and aspect ratio of alumina grains were measured on polished sections normal to the shear direction, i.e. from the centre to the rim of the deformed cylinders. A first minor occurrence of crystal breakage is evidenced in all experiments and low strains. It is related to intense stress localisation at some grain contacts in the initially connected solid framework. A second intense and penetrative crystal breakage process is observed for T≤ 550°C and γr > 6.2x10⁻⁴ s -1. The evolution of the size distribution as a function of finite strain and the reduced aspect ratios of preserved largest crystals in intensely strained zones support that breakage occurs by abrasion of the larger crystals. This abrasion can be attributed to the partial stress propagation over both the melt and partially isolated crystals under visco-elastic conditions.
Mechanical data show a transition from slight shear softening at low strain rates and highest temperatures to strain hardening for experiments that produced penetrative crystal breakage. The crystal-melt suspension exhibits a shear thinning behaviour with a stress exponent larger than 2.06 over the explored strain rate and temperature domain for the experiments without intensive crystal breakage.
Our results are applicable to the interpretation of the crystal breakage often observed at the base of lava flows, in domes, and near conduit walls. This experimental reproduction of a
process observed in nature is important because the controls of stress-induced breakage we quantified are also key parameters governing magma transport.
Keywords: magma rheology; experimental deformation; conduit-flow dynamics; crystal breakage, crystal size distribution
Introduction
Broken crystals are observed in a large variety of volcanic products (Best and Christiansen, 1997; Allen and McPhie, 2003; Bindeman, 2005; Tuffen and Dingwell, 2005). In lavas flows and domes, broken phenocrysts are generally less abundant than in products issued from explosive eruptions (e.g., Best and Christiansen, 1997). Typically, phenocryst fragments represent around 5% of the whole crystal population in effusive products (Allen and McPhie, 2003). This contrasts with fragments abundances (>50%, Allen and McPhie, 2003) in pyroclasts produced by low to medium energy explosive eruptions such as Vulcanian eruptions (e.g., Kennedy et al., 2005) or ash flow tuffs prior to plinian activity (e.g., Lipman, 1997). Converging observations such as in-place fragments fitting together as in a jigsaw puzzle and foamed melt inclusion remnants drove most authors to suggest that the breakage process is due to the stress induced by the foaming up of large melt inclusions during the decompression related to magma ascent. This process has been reproduced experimentally with success (Bindeman, 2005).
There is, however, a another subordinate population of small, sharply angular phenocryst having splinter-like shapes that cannot easily be explained by melt inclusion foaming (e.g., Allen and McPhie, 2003). Their distribution spans from dispersed to groups close to an intensely fractured, parent phenocryst that appears to have disintegrated in a brittle fashion. The associated breakage is thus characterised by strong grain size reduction and becomes more abundant in lavas either where crystallinity exceeds about 30 vol% or in formerly glassy domains in otherwise glassy but fractured groundmass (Allen and McPhie, 2003). Similar fragments have also been observed in crystal-rich, calc-alkaline products from the 1997 Vulcanian activity at Soufrière Hills volcano, Montserrat and from the 1991 Pinatubo eruption (grey pumice facies). If, at Soufrière Hills, parts of crystal breakage possibly originated from complex conduit implosion during the Vulcanian activity (Kennedy et al., 2005); it is more
likely related, at Pinatubo, to intense shear and viscous dissipation at the conduit wall during the climactic phase of the eruption (Polacci et al., 2001; Polacci et al., 2005). These cases of crystal breakage are different from the one recently observed during the 2004-2006 eruption of Mt St Helens (Cashman et al., 2008). At Mt St Helens, crystal breakage was related to fault gouges covering the successive spines of the dome. The host magma is often holocristalline, which suggests that the ascending magma behaves as a solid when crystal breakage occurred. These gouges did not contain viscous melt able to anneal after the occurrence of brittle breakage.
An accurate characterization of shear-induced crystal breakage in magmatic suspensions has the potential to constrain the conditions of magma ascent and final eruptive emplacement in terms of strain rate, stress and temperature. The few experimental evidences of crystal breakage in crystal-rich magmas available to date are more proofs of principle than systematic explorations of the controlling factors. Arbaret et al. (2007) noted that crystal breakage appeared in deformed magmatic suspension with >54 vol% particles at high simple shear strain, 300 MPa, and subsolidus (550 to 475 °C) temperatures. The main control on breakage seemed to be crystal content, probably because of the large range explored, from 0 to 76 vol%. Uniaxial compression (i.e. pure shear) experiments were carried out on lava samples (Cordonnier et al., 2009; Lavallée et al., 2007, 2008). The natural samples had 45 to 60 vol% crystals, with phenocrysts and microlites in roughly equal proportions. Conducted under stresses from 1 to 70 MPa and temperatures from 940 to 1010 °C, they document that at high stress and strain rates, crystal size reduction happens and is accompanied by shear thinning. This change of rheology, in turn can react to the modification of the crystal size distribution (Lavallée et al., 2007). Crystals first fragment in situ and are then disseminated by flowage (Cordonnier et al., 2009). The two most recent pure shear experiments concluded that the effect of temperature is subordinate to that of stress and strain rate, perhaps because of the
relatively narrow temperature range explored. Overall, these experimental studies highlight the separate roles that temperature and strain conditions play in controlling crystal breakage, opening the door to systematic studies aiming at quantifying and interrelating these controls. In order to determine how the parameters governing the development of crystal breakage in sheared magmas are related, we performed subsolidus (500-650 °C), high-pressure (300 MPa) torsion experiments on synthetic magmatic suspensions composed of 54 vol% of alumina crystals embedded in a hydrous melt of haplogranitic composition. The main purpose is to determine the respective influences of the temperature, the applied shear stress, and the amount of finite strain on crystal breakage. We quantify crystal breakage by analysing of the grain size distribution of the experimental runs, and document the associated changes in rheological behaviour thanks to mechanical data recorded during the experiments. Finally, we show semi-quantitatively how these controls of breakage can be combined into physical laws describing the underlying mechanism.
2. Experimental procedure
2.1 Sample synthesis and hydration technique
The starting material is composed of a hydrated synthetic glass mixed with 54% volume of alumina crystals (Figure 1). We crushed and sieved the insulating powder of alumina produced by Friatec, Germany, to obtain crystal sizes () of 45 µm < < 90 µm. This specific size interval has been chosen because grains are neither too small for digital image analysis nor too large with respect to sample size. The dry glass has been synthesised by Schott AG (Germany) and has a haplogranitic composition (SiO2 = 78.8%, Al2O3 = 12.44%, Na2O3 = 4.6% and K2O = 4.2%, as measured by microprobe analysis). This composition was selected because its rheology and water solubility at our experimental conditions is well constrained (HPG8 composition of Holtz et al., 1992; Dingwell et al., 1996). It also has the advantage that
chemical reactions between crystals and the hydrous melt are insignificant due to the limited solubility of alumina in the subaluminous melt (Holtz et al., 1992; Champallier et al., 2008). The glass powder mixed with alumina crystals was loaded in large gold capsules (20 mm in diameter and 35 mm in length) with 2.5 wt.% of demineralised water. Melt hydrations were performed at ISTO, Orléans, in a large bore furnace of an internally heated pressure vessel (IHPV) at 1000°C and 100 MPa during 1 month, then isobarically quenched (Martel et al., 2001). Such synthesis duration ensure perfect homogeneous hydration of the melt within the whole sample. The H2O content of the synthesised products was controlled by Karl-Fisher titration (KFT) and by Fourier-transform infrared (FTIR). Both procedures are detailed by Champallier et al. (2008).
Figure 1 shows the initial texture of the magmatic suspension. Crystals are characterised by irregular shapes with concave to convex borders inherited from the crushing procedure. Their spatial distribution is homogeneous. A limited amount of particles smaller than 45 µm is noted. They mainly correspond to crystals that were stuck to larger grains by electrostatic forces during the sieve procedure, although a few are fragments formed during the high pressured synthesis at contacts points between larger crystals (Figure 1, white arrows).
2.2 Deformation experiments
The experiments were performed in an internally-heated gas-medium (argon) deformation apparatus with torsion capabilities (Paterson instrument, Australian Scientific Instruments) at ISTO, Orléans. The experimental setup and techniques are described by Paterson and Olgaard (2000). Cylindrical samples from the starting product measure between 9.9 and 14.9 mm in diameter and between 4.1 and 9.6 mm in length. Opposite faces are finely polished in order to achieve parallelism within ± 3µm. The sample is placed between alumina and zirconia pistons to form a column, which is inserted in a copper jacket and placed in the Paterson apparatus so
that the sample is localised in the large isothermal zone (±1°C on 5 cm as estimated during a furnace calibration run).
All experiments were performed under a fixed confining pressure of 300 MPa and a temperature ranging from 500°C to 650°C. For each run, samples are deformed at constant angular displacement rates corresponding to strain rates varying between 8.45x10⁻⁵ and 5.43x10⁻³ s-1 at the outer radii of the cylinders (Figure 2). The angular displacement is recorded with an external RVDT, and the torque is measured with an internal load cell with a resolution of 0.1 Nm. The shear stress calculation from measured torque is presented in Paterson and Olgaard (2000) and briefly summarized below. The measured torque is corrected for the contribution of the copper jacket using the deformation laws for copper (Frost and Ashby, 1982) modified after laboratory calibrations. Analysis of mechanical data is presented in detail by Champallier et al. (2008). Experimental conditions are presented in Table 1 and Figure 2.
Experiments covered four temperatures (500, 550, 600 and 650°C). For each temperature, rheological data can be described by following flow law of form:
n
1
(1)
where is the shear stress (Pa), is the reference viscosity (Pa s), is the strain rate (s-1), and n is the non-Newtonian stress exponent. Equation 1 enables to calculate the parameters , , , and n from twist rate vs. torque data:
l r
(2)
where is the imposed angular displacement rate (rad s-1), r is the radius of the sample (m), and l is its length (m). The total torque measured by the Paterson press, M (N m), is composed of the stress contributions from the centre to the rim of the cylindrical sample. Assuming the flow law in (1), the torque is related to the shear stress, , by (Paterson and Olgaard, 2000):
3 2 ) 1 3 ( r n M (3)
It is possible to obtain the stress exponent n for a same reference viscosity without using the relationship between M and by evaluating the slope of the regression of the data in a log-log plot of vs. M. To compare samples of different dimensions, the angular speed ( ) and corresponding torque (M) need to be normalised to reference length and radius with help of following equations: s s N r l l r (4) 3 s N r r M M (5)
where indices s indicate reference quantities and indices N indicate normalized quantities. Once the stress exponent, n, is known, the stress τ (Pa) can be calculated from (3).
2.3 Digital image and textural analysis 2.3.1 Digital image analysis
Radial polished thin sections were prepared from the deformed samples. In these sections, normal to the shear direction, the shear strain evolve from zero at the sample centre (γ = 0) to a maximum (γmax = maximum finite strain) at the sample rim. SEM observations have been
performed using backscattered electron (BSE, 15 kV acceleration voltages). Digital images were acquired with a square size of 2048x2048 pixels, which represent a surface large enough to ensure statistically significant data. The resolution is 1.86 x 10⁻¹ µm.pixels-1. SEM images have been preferred to optical images since in SEM images borders of alumina grains are marked by two external dark grey and internal light grey strips that we used to facilitate grain separation (Figure 1). For each sample, an image that we call hereafter a “panorama” is produced by assembling 7 to 15 images by using the photomerge function (Photoshop® CS).
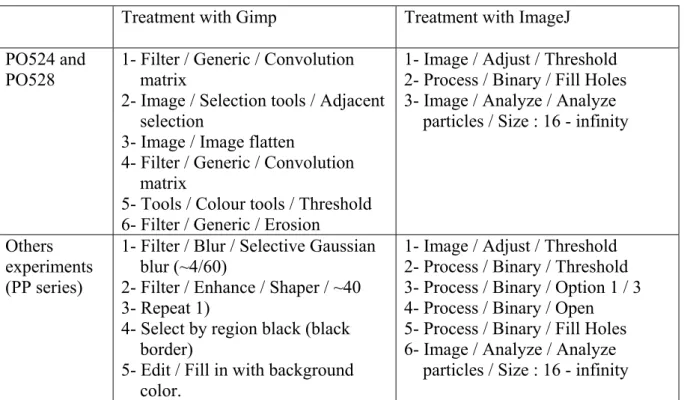
Such panorama represent a continuous view of the polished section from centre (γ = 0) to the sample rim (γmax). Image treatment is performed with GIMP (http://gimp.org) following two
different filtering processes depending on SEM images quality contrast (Figure 3, details of treatment and filtering processes in Table 2). Images of experiments PO524 and PO528, issued from Arbaret et al. (2007), are characterised by a weak contrast between the crystal phase and the surrounding (glass) matrix. The specific treatment used for theses two runs preserve the original surface area of each grain (Table 2). However, the grain separation is less efficient while grains in contact are hardly separated. Moreover, small grains are artificially created. They correspond to residual sections of the external dark grey strips produced during the segmentation process (Figure 1). For all other runs (PP- series, Table 2), the contrast has been voluntarily slightly increased during SEM acquisition to reinforce the coupled light/dark grey strips. As a result, separation is more efficient but the surface of each grain is reduced; the percentage of underestimation increases when the original surface of the analysed grain decreases.
Final image segmentation and grain size and shape analysis is performed with ImageJ (http://rsb.info.nih.gov/ij, detailed procedure in Table 2) and SPO2003 softwares (Launeau et al., 1990), respectively. Grains that exhibit a surface of less than 16 pixels have been suppressed because their shape and axial ratio are strongly controlled by the intrinsic square shape of the pixels. Examples of segmented panoramas for the four explored temperatures are presented in Figure 4. Numerical data obtained from the ImageJ and SPO2003 analyses include the surface, the axial ratio and the (X, Y) position of the inertia centre of each grain.
2.3.2 Textural analysis
Determination of the true three-dimensional grain size distribution from two-dimensional data by correcting artefacts due to serial sectioning is a classical problem of stereology. Several more or less complex methods propose corrections that include the effects of the size, shape and spatial distributions of the grain population (e.g. Higgins, 2006). To correct the artefact of sectioning we measured our initial grain population in 3D by using High Resolution X-ray Computed Tomography (HRXCT). This is a non-destructive technique that yields the separation in a volume of phases of different composition and density (Ketcham and Carlson, 2001; Ketcham, 2005; Gualda and Rivers, 2006). The microtomography measurements have been performed at the Materials Science Beamline MS of the Swiss Light Source (SLS) of the Paul Scherrer Institut (Switzerland). Characteristics of the electron source and detector of the microtomographic beamline are described by Stampanoni et al. (2002). Details of the procedure for samples preparation, image analysis and grain separation by using Blob3D software (Ketcham, 2005) are described by Arbaret et al. (2007). We choose a synthesis similar to those used herein, but composed of 16% volume fraction of grains. This low volume of solid fraction was chosen because 1) at such particle concentration, the number of fragments possibly formed by communition processes at contacts points between crystals during the high pressured synthesis is insignificant and 2) three-dimensional grain separation from tomographic images is hardly achievable at higher volume fractions. The average axial ratio of alumina grains considering an ideal, cigar-like shape (long axis a > medium axis b = short axis c) is 2.58 ± 0.83 based on 339 grains. This axial ratio and the calculated average grain size are used as a reference for the grain size distribution analysis using the method and software CSDCorrection v. 1.38 of Higgins (2000, 2002). It should be noted that this average axial ratio is close to the axial ratio of 2.35 ± 1.14 measured on sectional views of the undeformed material (Arbaret et al., 2007 and this study).
Grain size distribution of fragments that result from crystal breakage processes could fit either lognormal distribution (Kolmogorov, 1941), or Weilbull distribution (Kotov and Berendsen, 2002) or fractal distribution (Turcotte, 1992, Higgins, 2006, for a review). Many diagrams exist to display the size distribution of natural grain populations (Higgins, 2000; Higgins, 2006). The most common graphs are semi-logarithmic diagrams (“CSD diagram” of Marsh, 1988), the “CDF” diagram of Higgins (2000) and bi-logarithmic diagrams (Turcotte, 1992; so-called “fractal diagrams”, Higgins, 2000). The former is used to identify log-normal population distribution, and the latter is usually applied to characterise fractal distributions (Figure 5). Other graphs, often used for CSD determination in sediments, such as linear frequency diagrams or simple histograms, are sometimes applied to CSD in igneous systems (Higgins, 2006). Cataclase processes are susceptible to produce a fragment population that covers sizes spanning several orders of magnitude more than the size range covered by the original grains (Turcotte, 1992). After considering these different possibilities, we found a complementary expressive diagram that plots the normalised cumulative particle area against the logarithm of the grain size, which is calculated as an equivalent disk diameter. All these diagrams are used to better illustrate the evolution of the grain size distribution in our experiments.
3. Results
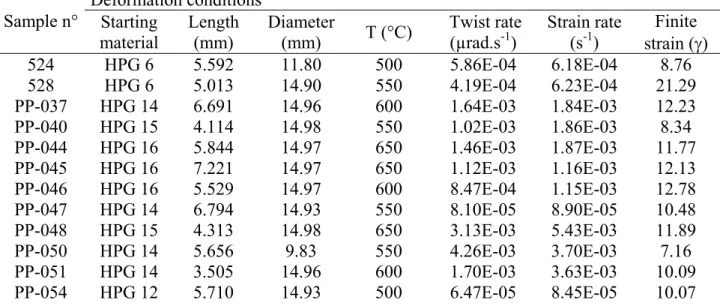
Twelve experiments were conducted at different temperatures, finite strain and strain rates (Figure 2). The experimental conditions for each experiment are detailed in Table 1. These conditions were constrained by the capabilities of the Paterson press to measure the torque needed to deform the sample in response to the applied strain rate that varied from 8.45x10⁻⁵ to 5.43x10⁻³ s-1. Another constrain was to choose the lowest temperature far enough from the ductile-to-brittle glass transition. Based on the empirical prediction of Dingwell (1998),
Arbaret et al. (2007) calculated a glass transition of 436.5°C at rest for the glass composition used and a water concentration of 2.5 wt%. The explored temperature range of 500°C to 650°C in this work is therefore clearly above this transition. In this section, we present the results of the CSD by first detailing the influence of temperature and then the influence of deformation rate.
3.1 Grain size distribution
3.1.1 Effect of temperature on crystal breakage
Because they were performed at nearly identical strain rates, from 1.84 to 1.87x10⁻³ s-1, we selected three experiments, PP044 (T = 650°C), PP037 (T = 600°C) and PP040 (T = 550°C), to illustrate the CSD evolution of the alumina population as a function of the temperature (Figure 6 and 7).
In a classical CSD diagram (Figure 5), all measured CSDs have a pronounced curvature. General trends are similar between PP044 and PP037. The experiment PP040, which was performed at the lowest temperature, however, is characterised by more abundant small particles and lower maximum size. The number of analysed particles (N) significantly increases with decreasing temperature from N = 1284 at 650°C (PP044) to N = 3248 at 550°C (PP040; Figure 5). There is thus a clear positive link between a decrease in temperature and the number of small grains created from the initial grain population. A similar conclusion can be drawn from the fractal distribution (Figure 5). This phenomenon is well illustrated by SEM observations in [X, Y] sections (Figure 6). For PP044 (Figure 6a), only few new isolated small particles are visible in the most deformed external part of the sample ( = 11.8; Figure 6b). As pointed out in the starting material description, most of these small particles are likely composed of the smaller grains inherited from imperfect sieving that are mixed during shearing with fragments formed when samples were set under high pressure (Figure 1). This
contrasts sharply with the significantly increase of small grains in the region of the [X, Y] section subjected to the maximum shear strain of = 8.3 in PP040 (Figure 6f). This large number of grains occurs despite the fact that PP040 reached a lower finite strain than the one reached in PP044. In addition, there is a clear visual evidence of grain size reduction of the whole population (rim zone, Figure 6f) compared to the undeformed part of the sample (centre zone, Figure 6e).
Further evidences of production of small grains with decreasing temperature exist in experiments performed at temperature lower than 550°C. For example, the progressive increase of the small grain population accompanied by a decrease of the number of the largest grains when scanning the sample from centre to rim is also visible in PP050 and PO524 sections (Figure 4). It is thus clear that the lower the temperature is, the more likely crystal breakage is.
3.1.2 Effect of finite strain on crystal breakage
In order to quantify the potential influence of the finite strain on the breakage process, the second part of our crystal size distribution analysis is illustrated by graphs where the cumulated fraction of area of the particles is plotted as a function of the base-2 logarithm of their sizes (Figure 7). In such a graph, the particle size doubles at each positive bin increment. Although these calculations were made on all experiments, we focus again on experiments PP044, PP037, and PP040 because they were performed at nearly identical strain rates (Figure 7). We sampled the finite strains of each experiment by segmenting and analysing individually the 9 or 10 images that compose the panoramas illustrated in Figure 6. The “local” finite shear strain affected for each image is calculated at the centre of the corresponding image (Figure 7). For each image, we also determined the particle sizes corresponding to five statistically significant particle area fractions (very small: -2 at 5%,
small: - at 16%, median: median at 50%, large: + at 84%, and very large: +2 at 95%; see Figure 7. For each experiment, these sizes were normalised by the corresponding values measured closest to =0 so as to obtain a normalised particle size (Figure 8). A normalised size of -1 for -2 thus means that the very small particles at that particular location are twice smaller than in the centre of the sample. Conversely, if the large population at a given location is twice as large as the reference population, it will display a normalised size of 1 for .
For experiment PP044, performed at the highest temperature and thus having little evidence of crystal breakage, the cumulative curves are similar, regardless of the corresponding local finite strains (Figure 7). All median values are close to 49 µm (5.6 log2 units). Both median and +2 ratios do not show any significant variation with finite strain (Figure 8), unlike the -2 ratio, which decreases significantly with strain to reach -1 at = 7 before remaining constant at higher strains. This absence of significant changes in the grain size except for the apparent increase up to = 7 of the smallest particles is characteristic of an initial grain population that does not evolve with strain. The slight increase until ≥ 7 most likely originates from the dispersion in the sheared medium of the small grains generated by sample preparation, which favoured their detection during segmentation.
Experiment PP037 was performed at an intermediate temperature, where crystal breakage is more likely (Figure 7). The median value of the grain size distribution decreases slightly with strain from 49 µm (5.6 log2 units) at = 0.7 to 39 µm (5.3 log2 units) at = 11.7. A closer look (Figure 8) shows that the median ratio is erratic from = 0.7 to = 7.0 followed by a regular but modest decrease above that value. The population of the largest particles, as expressed by the 2 ratio, display small changes uncorrelated with the local finite strain. The -2ratio decreases in the same manner as in PP044, which suggests that the smallest particles
detected at the highest strains also represent dispersed pre-existing grains formed during the synthesis. Overall, there might be an incipient although not statistically significant change in the particle size distribution with increasing finite strain at T = 600° C.
The experiment PP040 was performed at the lowest temperature, where crystal breakage is most likely. The median value of the cumulative particle area distribution evolves significantly with strain. At = 0 (centre, Figure 6e), the particle area is close to 49 µm2 (5.6 log2 units), in agreement with results of experiments performed at higher temperatures (Figure 7). A progressive decrease of the median size with strain is obvious in this experiment, with a median value approaching 26 µm (4.7 log2 units) for the highest reached finite strain = 8.0. This evolution in grain size distribution is even more obvious for the large population at –. At = 0, - is close to 24 µm (4.6 log2 units) and decreases regularly with increasing strain to reach 7 µm (2.8 log2 units) at = 8 (Figure 7). This behaviour is also apparent when looking at the -2 population, which decreases linearly with strain to a minimum of -2.6 (a factor 6 smaller) at = 8 (Figure 8). Thus, when conditions for crystal breakage are met, our data show that finite strain plays an active role in reducing grain size.
The observation that large crystals are surrounded by a cloud of much smaller fragments (Figure 6f) suggests that crystal breakage proceeds by abrasion. We analysed the axial ratio R (=a/b where a is the long axis and b is the short axis of grains) in an experiment, PP040, featuring crystal breakage at the rim. Figure 9 shows the repartition of grain shape ratio according to the crystal area (S, µm²) for the centre where = 8 and for the rim where = 8. A similar maximum area of 104.8 µm² is found in both zones. In addition, the number of grains larger than 103 µm² is closely similar. This suggests that some larger grains are spared by the crystal breakage process, which produces large numbers of small grains. In the rim zone, these preserved large grains exhibit small aspect ratios (maximum of 3.1) compared to the centre
zone (aspect ratio up to 6.5), which indicates some rounding. Both results are consistent with abrasion.
We tested further the link between abrasion and breakage by using crystal size distributions per area. Crystal abrasion forces the fraction of clasts of size x to evolve as a function of the finite deformation . Although tracking the general evolution of the full crystal size distribution, q(x,), is quite complicated (e.g., Hogg, 1999), some simple solutions exist (Ried, 1965). The main difficulty lies in the fact that the original size distribution, q(x,), is affected by the degree of abrasion, i.e. by the sizes of the detached fragments. In our experiments, however, abrasion causes large crystals to loose very small fragments, which is a propitious situation for a simple solution to apply. Assuming that the breakage rate, S(x), is independent of , every class size affected by such abrasion will have an amount of clasts decaying exponentially (Ried, 1965):
) ( ,0)exp ( ) , (x q x S x q (6)Figure 10a shows the evolution of q(x,) for one clast size in a sample having extensive crystal breakage (PO524) and in a sample unaffected by it (PP044). Fitting these data with an exponential decay yields a statistically significant correlation only for the former sample, which suggests that the simple solution described by Equ. (6) suitably replicates the abrasion process in our samples. Figure 10b indicates the R2 coefficient obtained by fitting Equation 6
to the data from two grain sizes for each sample. The first grain size is the largest bin size having some amount of clasts for every value of (i.e. q(x,)>0), and the second grain size is the bin size closest to the median size. Both sizes are represented on Figure 10b with respect to the five characteristic percentiles of the size distributions. Results (Figure 10b) suggest that most large clasts have been abraded in one sample (PP050), that only the largest clasts have been abraded in four samples (PP037, PP040, PP054, and PO524), and that the other samples were unaffected by abrasion. This mostly coincides with the observations done on the
cumulative size distributions (Figure 7) and on the characteristic percentiles of the size distributions (Figure 8). In the case of samples PP037 and PP051, both methods are in disagreement. Figure 10 shows strong crystal abrasion for PP037 that is not noticeable in Figures 7 and 8. In the same way, the crystals in the sample PP051 are not abraded (Figure 10), although we can see a small reduction of the grain size in the panorama of this experiment (Figure 4). Notwithstanding this discrepancy, our results establish that crystal breakage develops by abrasion of the largest crystals before progressively wearing off smaller and smaller grain sizes.
3.1.3 Effect of strain rate on crystal breakage
The normalised particle sizes obtained for all experiments have been split according to three population types (small, median, and large) out of the five visible on Figure 8, so as to describe the evolution of the grain size population in the complete temperature versus shear strain rate domain (Figure 11). Using the normalised particle size of the small population (-2 at 5%), three experiments show a significant increase in small particles with strain: PO524, PP040 and PP050. These experiments cover the lowest temperature and faster strain rates ranges explored by the run series (Figure 11). Strain rate thus appears also as a major control of crystal breakage.
Compared to the others experiments, which all reach a γ between 8 and 12, PO528 is not fragmented at γ<12 (Figure 11). Its rim, however, has been subjected to a much higher γ (21.29) and shows the characteristics of incipient crystal breakage. This suggests that the finite strain, γ, although influencing crystal breakage, is a control subordinate to temperature and strain rate. In other words, abrasion is active only beyond a threshold controlled by temperature and strain rate.
3.3 Mechanical data
The bulk rheology of three experiments (PO524, PP040 and PP050, Figure 12a) shows a progressive strain hardening increasing with the stress. For example, for PO524, we reach a peak of about 77 MPa at γ ≈ 8 before the experiment ended. In the same way, for experiments PP040 and PP050, the strain hardening occurs for > 6.23x10⁻⁴ s-1 with a peak stress τ
max ≈ 77 MPa at γ ≈ 5 for PP050. In the other experiments, the bulk rheology displays strain softening (Figure 12b). For example, in the experiments at 550°C (P0528 and PP047), strain softening appears for < 6.23x10⁻⁴ s-1. For each rheologic curve, the peak stress τ
max is reached when γ is comprised between 0.3 and 1.5. As a rule, for all experiments, higher the strain, higher is τmax. For example, for PP051, = 3.63x10⁻³s-1 and τmax = 25 MPa, whereas for PP045, = 1.16x10⁻³s-1 and τmax = 8 MPa.
We determined the general rheological behaviour of the HPG crystal-bearing suspension by compiling data of this work with the results obtained by Champallier et al. (2008) on the same 0.54 volume fraction of crystals and melts composition (Figure 13). In order to better compare our results, experiments with crystal breakage are not take account. The stress exponents for our experiments are 2.01±0.06, 2.36±0.14 and 1.96±0.01 for 550, 600 and 650°C respectively. All these values are above 1, which evidences a shear thinning behaviour over all the explored temperatures and strain rates in experiments without crystal breakage. No rheological law has been calculated in experiments with crystal breakage, because definite a law with two points (n=1.52) is not consistent.
3.4 Relationship between shear localisation and crystal breakage
Our experiments produce two types of crystal fragments. Crystals in the non deformed part of our experiments are often small fragments with an angular shape that fit together as in a jigsaw puzzle (Figure 14a-c). These grouping of fragments stayed in place so that the shape of
the original, unbroken crystal can generally be visually recognized. The cuspate fracture shapes suggest Hertzian fracturing (e.g., chapter 7 in Fischer-Cripps, 2007). The second type of fragments results from the deformation-driven crystal breakage documented above (e.g., Figure 7). Large crystals are surrounded by a cloud of much smaller fragments (Figure 14d). Most of these fragments were most likely abraded from that crystal, as the finite deformation necessary to concentrate them in such a way by transport only far exceeds that imposed on the sample. At a given location within the samples, crystal breakage is not uniformly distributed, so that both types of fragments coexist (Figure 14c-d).
The heterogeneous nature of crystal breakage is linked to strain localisation, which we analyzed in the [XZ] section of a representative sample (PO524, Figure 15). In first approximation, we separated the analysed area in three regions characterised by three finite strains of different intensities. The first region, representing 43% of the analysed surface, is constituted by isolated zones were almost no strain occurs (Figure 15b). This is evidenced by grains that suffered intragranular (Hertzian) fracturing before deformation. Their initial shape is still visible, which suggests that no local shear caused grain dispersion (see Figure 14c). We consider that finite strain in these regions is zero. The second region is characterised by large finite strains marked by winged porphyroclasts, the asymmetrical wings of which are composed of dispersed fragments of dislocated grains (Figure 14d). This region forms a mostly continuous anastomosed network covering 26% of the analysed area (Figure 15b). Because of the dispersion of fragments, no strains markers can be used to estimate the average finite strain within this region. The last region, representing 31% of the analysed surface, is distinguished by fragments of dislocated grains that are not dispersed, which suggests medium finite strains. The plucking of theses fragments during the polishing process form aggregates of black holes, the elliptical shape of which can be used as finite strain markers. Finite strain is derived from the equation (Ramsay, 1967):
2 2 12 ) 2 , 1 ( ( 2) 4 2 1
(7)where 1 and 2 are the quadratic extensions of the ellipses formed by each aggregates. The calculation yields an average strain of = 0.7 in the medium strain region. Taking a bulk finite strain of 8.76 for that sample and integrating no strain in the first region and the finite strain of 0.7 in the medium strain region, we found an average finite strain of = 32.9 in the highly deformed regions.
4. Discussion
We investigated experimentally the influence of temperature and shear strain rate on crystal breakage in magmas at high pressure during a non coaxial deformation. We used to this end a synthetic crystal melt suspensions made of 54 vol% of alumina grain mixed to a aluminosilicate melt hydrated with 2.5 wt% H2O. The simplicity of the setup and the limited range of temperature and strain rate offered by the Paterson press setup do not enable the reproduction of all the likely natural conditions to which magmas are subjected during an eruption. The experimental sub-solidus temperature, the simple shear flow, and the strain rates, however, match fairly with conditions expected along conduits walls and at the base of lavas flows. Our data can be used to explore two complementary aspects of crystal breakage: its underlying mechanisms, and its influence on the rheological behaviour of the crystal-melt suspension.
Our experiments produce two types of fragments. We linked the first type to Hertzian fracturing, which produces fragments with an angular shape that fit together as in a jigsaw puzzle. It occurs in the non deformed parts of our experiments (Figures 1 and 14a-b) and in zones of highly deformed samples that did not shear with the rest of the sample (Figures 14c-d and 15), which suggest it is caused by the internal stress load occurring during the high
pressure synthesis. The Hertzian fractures are due to stress propagation from crystal to crystal because they form a fully connected solid framework (Smith, 1996; Miura, 1999; Smith, 2002). In granular systems, common wisdom suggests that connectivity is guaranteed at 64 vol% because it corresponds to the random close packing of spheres. The work of Saar et al. (2001) underlines that crystal connectivity starts at only 30 vol% for a ratio of R=1 (spherical particles) and demonstrates that this threshold is reached sooner for less spherical particles (R>1). In our experiments, all samples contain roughly 54 vol% of crystals with a medium shape ratio of ~2.1, which brings the connectivity threshold down to 22 vol%. Our experiments thus had a crystalline network able to transmit stress, which supports that the Hertzian fracturing resulted from stress propagation across the crystal network during sample preparation, before any torsion occurred.
The second type of fragments is related to abrasion, which can be driven by two possible mechanisms in our experiments. Abrasion could result from interactions between clasts during flow. The wearing away of crystals could be driven by repeated contact between crystals due to their relative motion in the sheared medium (Best and Christiansen, 1997). Although relative translation velocities in our experiments are most likely vanishingly small because of the high melt viscosity, we expect relative motions due to crystal rotation. Solid body rotation in shear flow has been evidenced by Willis (1977) and Arbaret et al. (1996) among others. As a result, clast interaction is directly related to the amount of finite strain. Grain size analysis shows that although finite strain acted to reduce grain size, it is a control subordinate to temperature and strain rate (Figure 11). In other words, samples having been subjected to an equal amount of strain present various degrees of abrasion. This might be because the range of strain explored is much more restricted than that of the two others. We thus cannot exclude that crystal breakage could happen at, for instance, lower strain rates than we observed herein
if the deformation is carried out over a much larger finite strain. Notwithstanding this limitation, our data suggest that clasts interactions were not controlling crystal breakage. Abrasion could also result from stress transfer by the melt. At low strain rates, the silicate melt used in our experiments reacts as a Newtonian fluid, and the stress, Newt, is linearly
related to the strain rate (Equ. 1 with n=1: Newt
cr
). From rheology measurements on two crystal-free experiments (Champallier et al., 2008), we found that the law proposed by Hess and Dingwell (1996) reproduces well the changes in Newtonian melt viscosity with temperature in our experiments if the water content is assumed to be 3 wt% instead of 2.5 wt%. A visco-elastic response of the magma to torsion could, however, favour the propagation of stress within the liquid. Such rheological behaviour is known to exist at high strain rates (Webb and Dingwell, 1990) and at low temperature approaching the glass transition (Dingwell, 1998; Tuffen et al., 2008). Visco-elasticity arises when the melt is subjected to strain rates larger than a critical value . To first order, is given by: cr
cr kG (8)
where k is an experimental constant, and G is the bulk modulus. For rhyolitic melts, the strain rate above which visco-elastic behaviour becomes apparent is given by using k=1.78x10⁻³ and
G=25 GPa (Webb and Dingwell, 1990). In that regime, above , the elastic stress, cr elast, is
given by: elast G . Melt brittle rupture by crossing the glass transition occurs at a strain rate about an order of magnitude higher (k=10-2, Simmons et al., 1982). Figure 16 shows these values of strain rates and the strain rates achieved globally and locally in a sample featuring crystal breakage. Strain localisation at the margins of the sample (cf. Figure 15) was sufficient to cause strain rates large enough to trigger a visco-elastic response of the melt. As discussed below, strain rates of samples without crystal breakage are far below whereas strain rates cr of samples with crystal breakage reach . cr
Fracture mechanics relates the size of a crack in a clast to the stress, crack, needed to
propagate it and break the clast. The value of crack depends on the geometry of the crack and
its angle relative to the applied stress. It can be bracketed by considering either a straight crack perpendicular to an applied stress of extensive nature, or a penny-shaped crack parallel to a an applied stress of compressive nature. These two extreme cases can respectively be expressed as (e.g., Tromans and Meech, 2002):
a KC crack 2 (9a) a KC crack (9b)
where a is the crack radius, KC is the fracture toughness of alumina, and is the Poisson ratio
of alumina (KC ~ 2 MPa m-0.5, = 0.22; Tromans and Meech, 2002). The largest stresses are
given by Equ. (9a) because a straight crack perpendicular to an applied extensive stress is the most unfavourable situation. Conversely, the lowest stresses are given by Equ. (9b). Figure 17 shows these lower and higher bounds, i.e. the values of stress needed to break an alumina crystal. It also shows the Newtonian stress transmitted by the melt (Newt) and the elastic stress
transmitted by the melt in highly sheared zones (elast). Stresses related to Newtonian melt
deformation are orders of magnitude below the stresses required to cause alumina failure. Stresses related to visco-elastic melt deformation, however, are sufficient to explain crystal breakage in sample PO524. The anastomosed geometry of the localised bands (Figure 15b) suggests that localisation varied in space and time during the deformation. Only average values of the finite strain can be obtained, from which we estimated the average strain rates as a function of the distance from the sample centre that we used to build Figures 16 and 17. As a result, we expect that larger strains and strain rates could have been achieved locally during deformation. The averaging approach is a good qualitative tool to assess the relationship
We thus conclude that, after a first step of stress-induced breakage during the high pressure synthesis, the torsion in the Paterson press has caused a different type of crystal breakage that is best described by abrasion driven by viscous-elastic stress propagation. These two processes are found to act in natural samples. By far the most common process in natural volcanic rock (e.g., Best and Christiansen, 1997), stress-induced Hertzian fracturing tends to occur along pre-existing weaknesses such as crystal contacts (Horwell et al., 2001), and it is the main mechanism that develops in fault zones (Benkinsop, 1991; Heilbronner and Keulen, 2006; Keulen et al., 2007) and magmatic gouges (Cashman et al., 2008). Recently, Billi (2005) and Keulen et al (2007) have proposed abrasion to explain the round grain morphology observed in high energy conditions such as in gouge zones along fault rocks. In an earlier work, Allen and McPhie (2003) have observed, like in our experiments (Figure 14d), separation and rotation of fragments in response to shear in a laminar flow. As mentioned, this mechanism could explain the slight rounding of the large grains left at the rim of the runs having undergone crystal breakage (Figure 9).
Figure 18 shows fields corresponding to the three melt rheologies (Newtonian, visco-elastic, and brittle) for two types of rhyolitic melts. The first melt type corresponds to the hydrated melts used herein. The second type corresponds to dry rhyolitic melts and has been fitted to the rheological observations of Tuffen et al. (2008) by using 0.2 wt% H2O. Observations of the panoramic sections and the quantifications in Figures 7-11 enable us to define under which temperatures and strain rates crystal breakage occurs in hydrated melts. In Figure 18, the experiments PO524, PP050, and PP040 are considered as having undergone crystal breakage and are part of the corresponding field. The runs PP037, PP051, and PP054 define the boundary of the breakage field because the intragranular fracturing appears only at the sample very rim. The two sets of experiments also documenting crystal breakage (Lavallée et al., 2008; Cordonnier et al., 2009) were done on dry melts under pure shear and are reported
in Figure 18. The synthetic vision arising from comparing these experimental studies brings forth three observations. First, our capacity to explore different melt viscosities by varying either temperature or melt water content is essentially limited by the range of strain rates at which the various experimental apparatus operate. Higher strain rates imply a different apparatus design that is accompanied by a lost of precision on strain rate (e.g., Spieler et al., 2004), whereas lower strain rates imply experimental duration of several months to achieve any significant deformation. Second, glass transition being systematically far above the run conditions of crystal-rich experiments, it is very unlikely that the melts underwent sequences of brittle fracturing and subsequent annealing. Third, neither crystal breakage fields coincide with the onset of visco-elasticity, although they have the same curvature in the T vs. space. There are two reasons for this. First, the shear rates reported in Figure 18 are integrated over the sample height. As a result, shear localisation along preferential planes, visible in our experiments (Figure 15), is ignored. Second, the transition from Newtonian flow to visco-elastic flow is known only approximately for the different experimental sets, partly because of its progressive nature (Figure 16). This leads us to believe that the fields of crystal breakage and visco-elasticity are closer to overlap than shown in Figure 18, and to propose that crystal breakage in all these experiments was due to the propagation of stress associated with a visco-elastic response of the melt.
The second aspect of crystal breakage our experiments shed light on is the interplay between the apparent viscosity of the suspension and intragranular fracturing. When no breakage occurs, the rheological behaviour of the crystal-bearing suspension is shear softening over the whole range of temperature/strain rate explored (Figure 12). ******Shear softening like in our experiments, or constant stress with strain at lower strain rates and higher temperatures, is classically observed in sheared magmatic suspensions (Arbaret et al., 2007; Caricchi et al., 2007). This behaviour is often interpreted as the expression of the structural reorganisation of
anisotropic grains during shearing. The grains become predominantly aligned parallel to the plane of flow. The tortuosity of the streamlines in the sheared medium is reduced, reducing in turn the resistance of the suspension (Petford and Koenders, 2001). Consequently, the apparent viscosity reduces with strain, leading to shear softening. What is new in our experiments, however, is the change from shear softening to shear hardening when crystal breakage occurs. In such runs, the number of particles increases because fracturing produces a large number of small crystal fragments. As a result, the streamlines become more and more complex. When this process dominates over the natural alignment of the crystals, the overall tortuosity in the sheared medium increases and shear hardening occurs. Whereas most rheological laws of magmatic suspension take in account the effects of the amount of crystal in the suspension (e.g., Costa, 2005; Caricchi et al., 2007; Champallier et al., 2008), only one (Costa et al., 2009), in our knowledge, proposes an explicit dependence on crystal size by considering a bimodal distribution. Our results indicate that changes in crystal size distribution much subtler than switching from a uni- to a bi-modal distribution have a measurable effect on the suspension rheology (Figure 8). Further quantification of this effect could not only determine its relative importance compared to other second-order controls of rheology such as crystal shape, but could also shed light on the relationship between crystal breakage and shear localisation (Picard et al., accepted; Laumonier et al., accepted).
5. Conclusions
The objectives of the present work were to determine the main controls of shear-induced crystal breakage in bubble-free magmas and its influence on their general rheology. We deformed experimentally synthetic magmatic suspensions at subsolidus temperature between 500 and 650 °C, under strain rates from 8.45x10⁻⁵ to 5.43x10⁻³ s-1, and for finite strains
between 0 and 20. The suspensions were made of 54 vol% of alumina grain mixed to a aluminosilicate melt hydrated with 2.5 wt% H2O.
We observe two types of crystal breakage. The first type produces angular fragments that stay in place, outlining the tessellated shape of the parent crystal. Observations in the non-deformed part of the samples suggest this Hertzian fracturing is induced by stress during the high pressure synthesis. This is supported by the high crystallinity of the suspensions, which formed a network able to propagate strain. The second type of breakage occurs during the torsion in the Paterson press. The fragments are small, dispersed, and originate from the coarser part of the original size distribution. Analysis of the size distributions suggest that most large clasts have been abraded in one sample and that only the largest clasts have been abraded in four samples. Overall, our results establish that crystal breakage develops by abrasion of the largest crystals before progressively wearing off smaller and smaller grain sizes. Not all experimental conditions lead to breakage, which occurs at the lower temperatures, higher strain rates, and larger finite strains explored. These parameters are interrelated. For example, breakage is obtained at 550°C and =8 under high strain rate (1.86x10⁻³ s-1). Either raising the temperature to 600 °C, or reducing the deformation to <3, or lowering strain rate to 6.23x10⁻⁴ s-1 stops breakage. In other words, abrasion is active only beyond a threshold controlled by temperature and strain rate. Above that threshold, shear localisation creates sample parts rotating as solid bodies where only the initial, loading-related breakage is visible as Hertzian fractures. In the other parts, however, shear bands develop and torsion-driven breakage abrades clasts.
We carried out a semi-quantitative analysis of the mechanism of crystal breakage by torsion-driven abrasion. This analysis suggests that strain rates high enough were achieved locally to cause the interstitial melt to react in a visco-elastic fashion, transmitting high enough stress to break the crystals. This is supported by the fact that crystal breakage is
delimited by a curve in the T vs. space that parallels that of the onset of visco-elastic behaviour in a Newtonian melt.
Mechanical data show a transition from slight shear softening at low strain rates and highest temperatures to strain hardening for experiments that produced penetrative crystal breakage. The crystal-melt suspension exhibits a shear thinning behaviour with a stress exponent larger than 2.06 over the explored strain rate and temperature domain in experiments without crystal breakage.
We established that crystal size can be reduced when shearing a crystal-rich suspension, but several variables we maintained constant also influence breakage. Not only fewer crystals would hinder breakage, but also smaller crystals might break under different conditions. We have seen that the finite shear strain, γ, influences grain size reduction, but we explored a restricted range compared to that of temperature and strain rate. Finally, experiments on hydrated magmas at temperatures above those reached in this study and with magmatic crystals must be conducted in order to address deeper magmatic conditions. This implies working at much higher strain rates than the Paterson press can achieve.
Figure caption
Figure 1: SEM image of the starting material with crystal fraction = 0.54. Light grey is interstitial haplogranitic melt, dark grey are alumina grains. Note the white contrasted border used during the imaging segmentation process to individualise automatically each grain. Aggregates of small grains possibly formed during high pressure synthesis 1 kbar (white arrows).
Figure 2: Deformation conditions for torsion experiments on synthetic magmatic suspensions. Shear strains in parentheses represent maximum strain reached at the rim surface of the deformed cores.
Figure 3: a: SEM image of the starting material where the two analytical techniques (see Table2) are applied to separate automatically the alumina grains. b: resulting segmented image with the treatment applied for runs PO524 and PO528 characterised by a low contrast between the crystals and the melt. c: treatment used for others experiments which have a high contrast.
Figure 4: Four examples of segmented panoramas illustrating the evolution of the crystal breakage process with shear strain, strain rate and temperature. A threshold has been applied to these images are so that crystals appear black and the glass appears white. The threshold, however, is aggressive towards very small crystals, which creates visual artefacts. For example, in the experiment PO524, the image around gamma 5 presents such an artefact; many small crystals have been ignored by the threshold (i.e. incorrectly ascribed to white). As a result, the visual impression is an abrupt reduction in both grain size and crystal fraction.
The grain size analysis is not affected by such artefacts when it uses distributions based on crystal numbers.
Figure 5: Grain size distribution measured at the rims of experiments PP044, PP037 and PP040. Left: Results are reported in a bi- logarithmic, so-called ‘fractal’, diagram (Higgins, 2006). Right: The same results are reported on a semi-logarithmic ‘CSD’ diagram (after march, 1988).
Figure 6: SEM images showing the texture of the unsheared zones (centre of the core, left images) and deformed (maximum strain along the rim core, right images) for three experiments deformed at closely similar shear strain rate.
Figure 7: Cumulated percentage of particles area versus grain size from center to rim of the deformed sample.
Figure 8: Normalised particle size versus shear strain .
Figure 9: Repartition of grain shape ratio versus crystal area (in µm²). The grain aspect ratio corresponds to R=a/b where a is long axis and b is short axis of grains. The grains with a surface of less than 16µm are not measured, while their shape is mainly controlled by the intrinsic square shape of the pixels.
Figure 10: Abrasion as a mechanism for crystal breakage. a) Evolution of the volume fraction of the coarsest clast size as a function of strain rate for the 5 samples featuring crystal breakage and one sample without breakage (PP044). Two representative exponential
regression curves are shown, one for crystal breakage (PO524) and one without (PP044). The respective R2 coefficients suggest that crystal breakage causes the amount of coarsest clasts to decay exponentially as a function of strain rate, which is consistent with abrasion. b) Correlation coefficients (left axis), for each sample, of the exponential regression on the amount of largest (black bars) and median size (grey bars) clasts as a function of strain rate. High R2 values (>0.5) indicate statistically significant breakage, which is confirmed by visual observations. Sizes (right axis) of the largest (black triangles) and median (grey triangles) clasts are shown with respect to the box-plots of the size distributions per area (symbolic representation of 5 representative percentiles of the distribution). Bold numbers mark the samples displayed in a).
Figure 11: Variations of particle area for a particular cumulated percentage of versus finite strain. a) for a cumulated percentage of 95%, b) for a cumulated percentage of 84%, c) for a cumulated percentage of 50%, d) for a cumulated percentage of 16%, d) for a cumulated percentage of 5%.
Figure 12: Shear stress (MPa) versus shear strain curves obtained between 500° and 650° C. a. The experiments with a progressive strain hardening increasing with the stress. b. The experiments with a bulk rheology displaying strain softening with stress.
Figure 13: Log – log plot of twist rate (rad-1) versus torque M (Nm) for crystal-bearing magma with crystal contents 54 vol. %. Twist rate and torque were normalised to a sample of 15 mm in diameter and 7 mm in length following equations (4) and (5). For each temperature, the slope of line corresponds to the stress exponent n. The experiments with crystal breakage
have been skipped in order to compare at best with data of Arbaret et al. (2007; open symbols).
Figure 14: SEM images illustrating grain size reduction by breakage or abrasion of alumina crystals. a and b - Crystal breakage by internal stressing acted at contact between grains in the non deformed part of our experiments. The cuspate fracture shapes suggest Hertzian fracturing. c - Intragranular fractures developed in a grain. The initial grain shape is still recognizable, which suggests local low finite strain. d - Rounded porphyroclasts with asymmetrical wings composed of dispersed fragments of dislocated grains, which suggest local dextral sense of shear.
Figure 15: a: Grey-level image of [XZ] section of PO524 experiment. Sectional finite strain of 7.5. Light grey is alumina crystals, medium grey is melt (glass) and dark grey corresponds to regions were small grains were plucked during the polishing process. b : regions separated as a function of strain. Calculation of finite strain based on deformation of markers was realised on the medium grey levels regions. See text for explanation.
Figure 16: Strain rate as a function of distance from the cylinder centre for a sample featuring crystal breakage (PPO524). Two curves are shown, one assuming bulk shear (i.e. finite strain
achieved at that distance from centre divided by experiment duration), and one assuming localised shear (i.e. achieved at that distance, corrected for the shear localisation quantified in Figure 15, and divided by experiment duration). Critical strain rates, , above which cr visco-elasticity (solid line) and glass transition (solid bold line) occur are also shown. Note that the transition from Newtonian to visco-elastic flow is known only approximately because of its progressive nature. The overlap between the localised shear in the sample and the
visco-elastic limit suggests that the melt was able to transmit strain in an visco-elastic fashion in shear bands, where crystal breakage is the most intense.
Figure 17: Stress as a function of distance from the cylinder centre for a sample featuring crystal breakage (PPO524) and a sample without breakage (PP044). Because of strain localisation, two levels of stress can be achieved in PPO524, depending on whether the melt reacted as a Newtonian liquid (Newt) or a visco-elastic fashion (elast). The low shear rates in
PP044 suggests the melt reacted there only as a Newtonian liquid. A pair of curves is shown for each three cases, one assuming bulk shear (continuous line) and one assuming localised shear (dashed line). Bulk shear was obtained by dividing the achieved at that distance by experiment duration. Localised shear was obtained for PPO524 by dividing the localised achieved at that distance (Figure 15) by experiment duration. Localised shear was estimated for PP044 by correcting the bulk shear by a factor similar to that of PO524 (i.e. localised values are ~3.8 time larger than bulk values in PO524). Critical stresses, crack, above which
alumina crystals containing a straight (light grey area) or penny-shaped (dark grey area) crack break are also shown. For both crack shapes, the smallest stress value corresponds to a crack length of 20 m and the highest stress value corresponds to a crack length of 0.5 m. The layout of the curves suggest that, in general, elast>crack>Newt. As a result, the visco-elastic
behaviour of the melt, which is induced by strain localisation (Figure 16), transmits stresses high enough to cause crystal breakage.
Figure 18: Run conditions for experiments involving crystal or melt brittle fracturing. Lines delimit three rheological behaviours of the melts (Newtonian, visco-elastic, and brittle) for two types of rhyolitic melts (hydrated in black and dry in red). The gray zones delimit the conditions under crystal breakage occur for each set, respectively. Symbol shapes represent
experiments done by four different studies, and their filling color represent degrees of brittle behaviour, from no crystal breakage (white) to incipient breakage (gray) and to crystal breakage (black). The corresponding degrees for crystal-free melts are brittle, mixed, and ductile, respectively. The range of strain rates achievable with the Paterson press is also shown in blue.
Acknowledgments
The project was partly funded by the French Agence Nationale de la Recherche (ANR-EXPLANT, Contract No ANR-05-CATT-003 to C. Martel) and by the ERC grant 202844 under the European FP7. We benefited from discussions with Luca Caricchi and David Picard. Dominique Genty and Olivier Rouer helped us to use the SEM. We thank the associate editor and the two reviewers Yves Guegen and Philip M. Benson for their helpful and constructive comments.
References
Allen, S. R., McPhie, J., 2003. Phenocryst fragments in rhyolitic lavas and lava domes. J. Volcanol. Geotherm. Res. 126, 263-283.
Arbaret L., Diot H., Bouchez J.L., 1996. Shape fabrics of particles in low concentration suspensions: analogue experiments and application to tiling in magma. J. Struct Geol. 18 (7), 941-950.
Arbaret, L., Bystricky, M., Champallier, R., 2007. Microstructures and rheology of hydrous synthetic magmatic suspensions deformed in torsion at high pressure. J. Geophys. Res. 112, B10208,
Best, M.G., Christiansen, E.H., 1997. Origin of broken phenocrysts in ash-flow tuffs. Geol. Soc. Am. Bull. 109, 63-73.
Billi, A., 2005. Grain size distribution and thickness of breccia and gouge zones from thin (<1 m) strike-slip fault cores in limestone. J. Struct. Geol. 27, 1823-1837.
Bindeman, I.N., 2005. Fragmentation phenomena in population of magmatic crystals. Am. Mineral. 90, 1801-1815.
Blenkinsop, T.G., 1991. Cataclasis and processes of particles size reduction. Paleoph. 136, 60-86.
Burgisser, A., Arbaret, L., Forien, M., in prep. Mechanisms of shear-induced crystal breakage in magmas.
Caricchi, L., Burlini, L., Ulmer, P., Gerya, T., Vassalli, M., Papale, P., 2007. Non-newtonian rheology of crystal-bearing magmas and implications for magma ascent dynamics. Earth Planet. Sci. Lett. 264, 402-419.
Cashman, K.V., Thornber, C.R., Pallister, J.S., 2008. From dome to dust: shallow crystallization and fragmentation of conduit magma during the 2004-2006 dome extrusion of Mount St Helens, Washington, in: Sherrod, D.R, Scott, W.E., Stauffer,
P.H. (eds) A volcano rekindled: the renewed eruption of Mount St Helens, 2004-2006, U.S.G.S. Professional Paper 1750, p.387-413.
Champallier, R., Bystricky, M., Arbaret, L., 2008. Experimental investigation of magma rheology at 300 MPa : From pure hydrous melt to 75 vol.% of crystals. Earth Planet. Sci. Lett. 267, 571-583.
Cordonnier, B., Hess, K.-U., Lavallee, Y., Dingwell, D.B., 2009. Rheological properties of dome lavas: Case study of Unzen volcano, Earth and Planetary Science Letters. 279, 263-272.
Costa, A., 2005. Viscosity of high crystal content melts: Dependence on solid fraction. Geophys. Res. Lett. 32, L22308, doi:10.1029/2005GL024303.
Costa, A., Caricchi, L., Bagdassarov, N., 2009. A model for the rheology of particle-bearing suspensions and partially molten rocks. Geochem. Geophys. Geosyst. 10 (3)., doi:10.1029/2008GC002138.
Dingwell, D. B., 1998. The glass transition in hydrous granitic melts. Phys. Earth Planet. Int. 107, 1-8.
Dingwell, D.B., Romano, C., Hess, K.-U., 1996. The effect of water on the viscosity of haplogranitic melt under P-T-X conditions relevant to silicic volcanism. Contrib. Mineral. Petrol. 124, 19-28.
Fischer-Cripps, A.C., 2007. Introduction to contact mechanics. Mechanical Engineering Series, 2nd ed., Springer, New-York. 222 p , DOI: 10.1007/978-0-387-68188-7
Freundt, A., Schmincke, H.-U., 1992. Abrasion in pyroclastic flows. Geologische Rundschau, 81/2, 383-389.
Frost, H.J., Ashby, M.F., 1982. Deformation – mechanism Maps: The Plasticity and Creep of Metals and Ceramics. Pergamon Press, New York. 167 pp.
Gualda, G.A.R., Rivers, M., 2006. Quantitative 3D petrography using x-ray tomography: application to Bishop Tuff pumice clasts. J. Volcanol. Geoth. Res. 154 (1–2), 48-62. Heilbronner, R., Keulen, N., 2006. Grain size and shape analysis of fault rocks.
Tectonophysics 427, 199-216.
Hess, K-U., Dingwell, D.B., 1996. Viscosities of hydrous leucogranitic melts: A non-Arrhenian model. Am. Mineral. 81, 1297–1300.
Higgins, M.D., 2000. Measurement of Crystal Size Distribution. Am. Min. 85, 1105-1116. Higgins, M.D., 2002. Closure in crystal size distribution (CSD), verification of CSD
calculations, and the significance of CSD fans. Am. Min. 87, 171-175.
Higgins, M.D., 2006. Verification of ideal semi-logarithmic, lognormal or fractal crystal size distributions from 2D datasets. J. Volcanol. Geotherm. Res. 154, 8-16.
Holtz, F., Pichavant, M., Barbey, P., Johannes, W., 1992. Effects of H2O on liquidus phase relations in the haplogranite system at 2 and 5 kbar. Am. Mineral. 77, 1223-1241.
Horwell C. J., Braña, l. P., Sparks, R. S. J., Murphy, M. D., Hards, V. L., 2001. A geochemical investigation of fragmentation and physical fractionation in pyroclastic flows from the Soufrière Hills volcano, Montserrat. J. Volcanol. Geotherm. Res. 109, 247 – 262.
Kennedy, B., Spieler, O., Scheu, B., Kueppers, U., Taddeucci, J., Dingwell, D.B., 2005. Conduit implosion during vulcanian eruptions. Geology 33(7), 581-584.
Ketcham, R.A., 2005. Three-dimensional grain shape fabric measurements using high-resolution X-ray computed tomography. J. Struct. Geol. 27, 1217-1228.
Ketcham, R.A., Carlson, W.D., 2001. Acquisition, optimization and interpretation of X-ray computed tomographic imagery: application to the geosciences. Computers and Geosciences, 27, 381-400.