HAL Id: hal-02499364
https://hal.uca.fr/hal-02499364
Submitted on 5 Mar 2020
HAL is a multi-disciplinary open access
archive for the deposit and dissemination of
sci-entific research documents, whether they are
pub-lished or not. The documents may come from
teaching and research institutions in France or
abroad, or from public or private research centers.
L’archive ouverte pluridisciplinaire HAL, est
destinée au dépôt et à la diffusion de documents
scientifiques de niveau recherche, publiés ou non,
émanant des établissements d’enseignement et de
recherche français ou étrangers, des laboratoires
publics ou privés.
Basaltic dyke eruptions at Piton de La Fournaise:
characterization of the eruptive products with
implications for reservoir conditions, conduit processes
and eruptive dynamics
Simon Thivet, Lucia Gurioli, Andrea Muro
To cite this version:
Simon Thivet, Lucia Gurioli, Andrea Muro. Basaltic dyke eruptions at Piton de La Fournaise:
char-acterization of the eruptive products with implications for reservoir conditions, conduit processes
and eruptive dynamics. Contributions to Mineralogy and Petrology, Springer Verlag, 2020, 175 (3),
�10.1007/s00410-020-1664-5�. �hal-02499364�
1
Basaltic dyke eruptions at Piton de La Fournaise: characterization of the eruptive products with
1
implications for reservoir conditions, conduit processes and eruptive dynamics
2
3
Simon Thivet(1), Lucia Gurioli(1), Andrea Di Muro(2)
4
(1) Laboratoire Magmas et Volcans, Université Clermont Auvergne - CNRS - IRD, OPGC, Campus Universitaire
5
des Cézeaux, 6 Avenue Blaise Pascal, 63178 Aubière Cedex, France
6
(2) Institut de Physique du Globe (IPGP), Sorbonne Paris-Cité, CNRS UMR-7154, Université Paris Diderot,
7
Observatoire Volcanologique du Piton de la Fournaise (OVPF), Bourg Murat, France
8
Author contact: simon.thivet@uca.fr (Orcid: 0000-0003-0836-6421)
9
10
Acknowledgments
11
We thank A. J. L. Harris and G. Boudoire for the syn-eruptive sampling of the July 2015 products, J-L. Devidal
12
and J-M. Hénot for their precious support in using the electronic microprobe and the SEM, and M. Benbakkar for
13
the bulk rock analysis. We thank M.D. Higgins and L. Pioli with whom we had constructive discussions. This
14
paper was greatly improved by the critical review of the anonymous reviewer and the editor. We thank the STRAP
15
project funded by the Agence Nationale de la Recherche (ANR-14-CE03-0004-04). This research was financed
16
by the French Government Laboratory of Excellence initiative no. ANR-10-LABX-0006, the Région Auvergne
17
and the European Regional Development Fund. This is Laboratory of Excellence Clervolc contribution number
18
401.19
20
21
22
23
24
25
2
Abstract
26
Small-volume proximal-summit eruptions, sometimes with only little precursors, are common at Piton de
27
la Fournaise (La Reunion Island, France). Their eruptive style ranges from Hawaiian to Strombolian but their
28
eruptive mechanisms are still not completely understood. To gain insight, we combined syn-eruptive field work,
29
textural and geochemical measurements on the short-lived eruption of July 2015 and we compared it with the 2014
30
eruption, which opened the ongoing eruptive cycle at Piton de la Fournaise. Crystal-poor and moderately vesicular
31
components were predominant at the beginning of the eruptions, during the lava flux peak and the Hawaiian-style
32
activity. Their abundance decreased with time in favour of less vesiculated and crystal-rich components during the
33
decrease of the lava flux and the Strombolian-style activity. Physical, textural and chemical characterization of the
34
pyroclasts, as well as thermometry calculations, permit to relate the different texture and chemical features of the
35
eruptive products with the pre- and syn-eruptive processes. Geophysical precursors detected several weeks before
36
the July 2015 eruption, as well as some evidences of magmatic reheating recorded in bulk and crystal compositions
37
highlight that the July 2015 magma results from a pre-eruptive mixing between more and less differentiated
38
magmas. We finally deduced that the observed syn-eruptive textural variations are related to the same batch of
39
magma undergoing different cooling and degassing dynamics.
40
41
Key-words
42
Basalt; Degassing; Hawaiian-style activity; Piton de la Fournaise; Strombolian-style activity; Triggers.
43
44
45
46
47
48
49
50
3
1 Introduction
51
1.1 Context
52
Basaltic systems exhibit a wide range of magmatic eruption styles, from effusive eruptions generating
53
lava flows (e.g. Harris et al. 2007, 2017; Staudacher et al. 2016), Hawaiian and/or Strombolian-style activities (e.g.
54
Head and Wilson et al. 1987, 1989; Jaupart and Vergniolle 1988, 1989; Parfitt and Wilson 1995; Parfitt, 2004;
55
Stovall et al. 2011, 2012; Houghton et al. 2016), up to more violent explosions (e.g. Houghton and Gonnermann
56
2008; Morandi et al. 2016; Ort et al. 2016). Eruptive styles are controlled primarily by syn-eruptive magma ascent
57
dynamics within volcanic conduit systems (e.g. Sparks 1978; Vergniolle and Jaupart 1990; Houghton et al. 2004;
58
Gonnermann and Manga 2013; Applegarth et al. 2013; Pioli et al. 2012, 2017; Pering et al. 2017) and pre-eruptive
59
magmatic conditions of the reservoirs (e.g. Sparks and Huppert 1984; Anderson 1995; Corsaro and Pompilio 2004;
60
Roeder et al. 2006; Gurioli et al. 2018). These dynamics are strongly dependent on the physicochemical properties
61
of the magma, like its temperature, pressure, volatiles content and chemical composition (e.g. Tait et al. 1989; Di
62
Muro et al. 2014, 2015, 2016; La Spina et al. 2015; Mollo et al. 2015; Rae et al. 2016).
63
Petrographic and textural measurements on basaltic products can provide critical information regarding
64
the pre-eruptive storage and magma ascent conditions (e.g. Kuo and Kirkpatrick 1982; Polacci et al. 2006, 2012;
65
Di Muro et al. 2014, 2015 ; Pioli et al. 2014; Gurioli et al. 2015, 2018). However, post-fragmentation effects can
66
obliterate the primary signature of the magma, especially during high intensity lava fountain activities (e.g.
67
Mangan and Cashman 1996; Stovall et al. 2011, 2012; Parcheta et al. 2013; Moitra et al. 2013, 2018; Kawabata et
68
al. 2015; Lindoo et al. 2016, 2017). Piton de la Fournaise (PdF) is one of the most active volcanoes in the world
69
in term of eruption frequency but it frequently exhibits low intensity Hawaiian to Strombolian-style activities,
70
allowing efficient and fast natural quenching of the eruptive products that are not significantly modified by
post-71
fragmentation expansion phenomena. Recently, Gurioli et al. (2018) have shown that the textural features of the
72
pyroclast products from the mild recent activity of PdF are representative of the fragmentation conditions and thus
73
can provide information related to (i) the shallow reservoirs which feed the eruptions and (ii) track the degassing
74
history of the ascending magmas. These latter authors also provided a complete dataset of the June 2014 eruption
75
that marked the beginning of a new and still ongoing eruptive cycle at PdF after a long quiescence period.
76
1.2 Objectives
4
Based on the specific case of the 2014-2015 eruptive period at PdF, the main objectives of this work are
78
focused on (i) the eruption triggering and the general processes driving a magmatic system reactivation as well as
79
on (ii) the mechanisms controlling the eruptive styles. More specifically, we wanted to check if the processes
80
operating at the origin of the magmatic overpressures triggering such eruptions were different on the entire period
81
of June 2014-July 2015, and if the textural signature of the emitted products reveal similar or different ascent
82
dynamics and degassing histories in the eruptive dyke.
83
In this work, we combine macroscopic analysis (componentry), bulk texture measurements (density,
84
porosity and vesicle connectivity), microscopic texture measurements (Vesicle Size Distribution, VSD and Crystal
85
Size Distribution, CSD), and petro-chemical analysis (bulk rock, glass and crystal compositions) on lava and
86
tephra, of the July 2015 eruption at PdF. We also completed the textural dataset of Gurioli et al. (2018), adding
87
the CSD of the June 2014 eruptive products. In parallel, these data are integrated with componentry measurements
88
acquired on the June 2014, February and May 2015 eruptions of PdF, also with already published bulk rock
89
analyses, experimental data (cooling experiments) and geophysical insights acquired on the June 2014-July 2015
90
period (ground deformations, magma output rates and seismic spectrograms). All these types of data are also
91
important to characterize as they can be eventually compared to the output of physics-based models in order to
92
better constrain physical parameters related to magma storage and conduit processes.
93
94
2 Geological background
95
2.1 The shallow magma storage system of PdF
96
With the exception of three eruptions that occurred during the twentieth century, the recent volcanic
97
activity of PdF is confined within the Enclos Fouqué caldera which corresponds to the most recent big caldera of
98
the volcano (Bachèlery 1981). This caldera is a poly-lobed depression, 100 to 250 m depth, in the centre of which
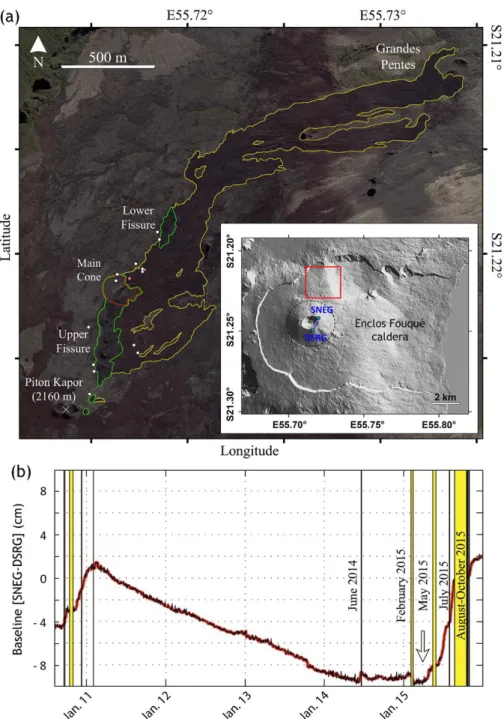
99
the cone of PdF is built (Fig. 1a). According to the seismic data acquired by the Observatoire Volcanologique du
100
Piton de La Fournaise (OVPF) monitored by the Institut de Physique du Globe de Paris (IPGP), the magmatic
101
system feeding the central activity at PdF, extends vertically in the crust between the volcano top (2.6 km above
102
the sea level) and 7 km below the sea level (Battaglia et al. 2005; Peltier et al. 2015; Lengliné et al. 2016).
103
Geophysical data suggest that the main shallow magmatic storage system is located close to the sea level below
104
the central cone (Peltier et al. 2008; Prôno et al. 2009). Based on surface deformations, Peltier et al. (2008)
5
interpreted the summit or proximal eruptions (located close to the central cone of PdF), with low volume and short
106
time lag between initiation of the dyke propagation and the beginning of the eruption, as the drain of small and
107
shallow (above sea level) volumes located beneath the volcano summit. Geochemical and barometric data (Di
108
Muro et al. 2014, 2015) as well as geodetic data (Peltier et al. 2016) support the existence of a multitude of shallow
109
crustal reservoirs, which represent an active storage unit below the central cone.
110
2.2 The 2014-2015 eruptions: the beginning of a new eruptive cycle
111
Recent activity at PdF produces on average one eruption every nine months (Roult et al. 2012) but cycles
112
of frequent eruptive activity alternate with phases of quiescence lasting up to six years (Peltier et al. 2008). The
113
April 2007 major caldera-forming eruption represents one of the most intense and voluminous events of the
114
historical activity of PdF (Staudacher et al. 2009). This large eruption was followed by a set of small-volume
115
eruptions and shallow intrusions between 2008 and 2011, followed by a 41 months long resting phase, between
116
2011 and 2014 (Fig. 1b; Peltier et al. 2016). Sudden and quite weak precursors of new unrest were detected in June
117
2014: after 11 days of weak inflation, a new short-lived eruption started the 20 June 2014 (Gurioli et al. 2018).
118
This event marked the beginning of a new, and still ongoing, cycle of activity at PdF that produced five eruptions
119
in the 2014-2015 period.
120
With the remarkable exception of the complex, long lasting and large August-October 2015 event (emitted
121
volume of 45.2 106 m3; Coppola et al. 2017), the eruptions of the 2014-2015 period had relatively simple patterns
122
of rapid exponential decay in magma output rates or TADR (time-averaged lava discharge rates; Harris et al. 2007)
123
and emplaced relatively small volumes of lava (all < 10 106 m3 and often < 2 106 m3). Indeed, the first four eruptions
124
of the 2014-2015 period, share relatively similar characteristics in terms of duration, eruption pattern and total
125
extruded volume (0.3 106 ± 0.1 for June 2014, 0.8 106 ± 0.3 for February 2015, 6.5 106 ± 2.3 for May 2015 and 1.6
126
106 ± 0.6 m3 for July 2015; Coppola et al. 2017).
127
Bulk rock composition changed during the 2014-2015 eruptions, suggesting initial differentiation
128
followed by a progressive mixing of the resident, evolved magma with a primitive magma batch, whose volumetric
129
contribution further increased during the large August 2015 eruption (Coppola et al. 2017). The 2014-2015 set of
130
eruptions has thus been interpreted as the result of a major phase of refilling and rejuvenation of the shallow PdF
131
plumbing system, which had been substantially drained away in the caldera forming 2007 eruption (Di Muro et al.
132
2014; Peltier et al. 2016). The June 2014 (evolved magma) and the July 2015 (hybrid magma) events are the focus
133
of this research.
6
2.3 Chronology and field sampling of the July 2015 eruption
135
Since mid-April 2015, several precursors were observed (Peltier et al. 2016): deep seismicity was detected
136
below the central cone, associated with a change in the composition of the intra-caldera gas emissions (CO2 and
137
H2S enrichment in the summit fumaroles) and an increase of the summit ground inflation (4 cm along the summit
138
GNSS baseline, three months before the eruption; Fig. 1b). According to the OVPF activity bulletin of July 2015
139
(ISSN 2610-5101; http://www.ipgp.fr/fr/ovpf/bulletin-dactivite-mois-de-juillet-2015), the July 2015 eruption
140
started on the 31 July at 5:20 a.m. (all time cited in this paper are in UTC) after an intensification in the shallow
141
volcano-tectonic (VT) seismicity located below the volcano central cone (seismicity peaks on the 7, 13, 28 and 31
142
of July). This eruption was thus preceded by a set of unambiguous precursors and a longer lasting phase of
pre-143
eruptive inflation with respect to the smaller and sudden inflation recorded only 11 days before the June 2014
144
eruption (Gurioli et al. 2018) as well as relatively weak inflation preceding the February and May 2015 eruptions
145
(Peltier et al. 2016; Fig. 1b).
146
Following the OVPF activity bulletins and field observations, the July 2015 eruption occurred along two
147
en-echelon eruptive fissures (upper and lower fissures), corresponding to the same dyke, which extended from the
148
NE of the 1998 Piton Kapor cone towards the NNE (Fig. 1a). This eruption was located in the N10 rift zone defined
149
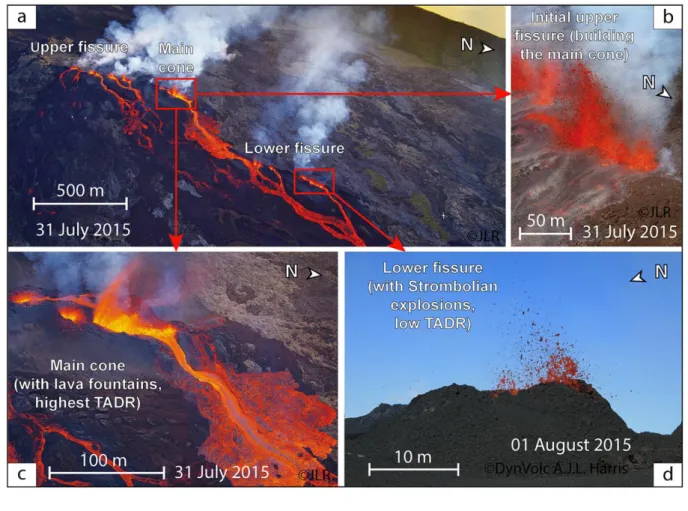
by Bachèlery (1981). Lava fountains at the beginning of the eruption were followed by mild Strombolian
150
explosions towards the end of the eruption, which formed a set of aligned pyroclastic cones and fed several lava
151
flows (Fig. 2), some of them spreading out to the North of the Grandes Pentes area (Fig. 1a). On the basis of the
152
thermal emission measured by the MODIS sensor (Moderate Resolution Imaging Spectroradiometer, MIROVA
153
monitoring system, Coppola et al. 2016), the maximum TADR was estimated at 22 ± 8 m3 s-1 during the first hours
154
of the eruption and then declined exponentially towards the end of the eruptive activity. In comparison, the TADR
155
of the June 2014 eruption followed a comparable temporal trend but its maximum output rate was three times
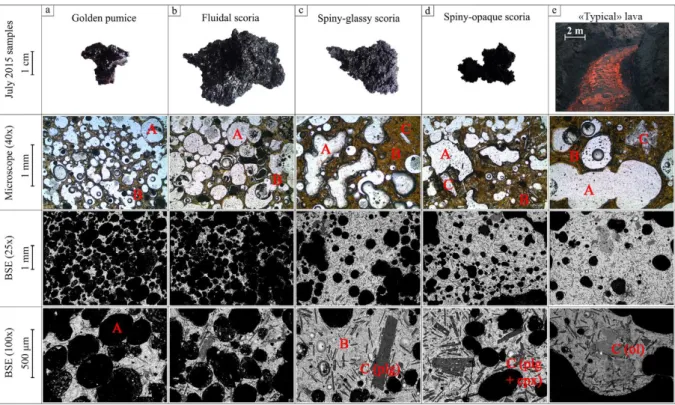
156
lower than that of July 2015. From the night between the 31 July and 1 August, the tremor intensity and TADR
157
started to decrease, mirroring a rapid decline in the magmatic activity and the closure of some eruptive vents. After
158
several hours of intensity seismic fluctuation, corresponding to gas piston events, the tremor disappeared the 2
159
August at around 7:30 am after 50 hours of activity.
160
The two eruptive fissures did not produce the same activity during the eruption. (i) The upper fissure was
161
active all along the eruption and the main part of the activity was concentrated in this area, especially in the
162
northernmost cone (which grew progressively during the eruption and is described as the main cone of the eruption,
7
Figs. 1a and 2) of this eruptive fissure. (ii) The lower fissure (towards the NNE; Figs. 1a, 2a and 2d) began to form
164
few hours after the upper one, during the maximum TADR and its activity stopped about one or two hours before
165
that of the upper fissure. Nevertheless, the transition between Hawaiian and Strombolian-style activity observed
166
during the eruption was widespread and happened quite suddenly at the same time along both fissures (Fig. 2).
167
Thanks to the rapid scientific response of the OVPF and the DynVolc teams (Harris et al. 2017), as well
168
as relatively good weather conditions, detailed syn-eruptive sampling and characterisation of eruptive dynamics
169
were performed. The juvenile samples were collected close to different active zones and at different times to
170
constrain the eruptive dynamics both in space and time (Fig. 1b and Table S1). The first sampling site was the
171
main cone of the eruption, at the NNE extremity of the upper fissure (Figs. 1b and 2). The sampling of this site
172
was done a few hours after the beginning of the eruption, when Hawaiian fountaining was still intense and during
173
the maximum TADR phase. The second sampling site was the other part of the upper fissure, which was active
174
throughout the entire eruption. Sampling was done during the second part of the eruption and the mild
Strombolian-175
style activity, when TADR was declining. Finally, the third and last sampling site was the lower fissure, which
176
opened just after the upper one and its sampling was performed during the second part of the eruption as well.
177
These three sampling sites permitted to document the change in eruptive style and the decline in eruption intensity
178
(from Hawaiian to Strombolian-styles). Lava samples were directly taken from the active lava flows (mainly the
179
one emitted from the main cone) and gently quenched in water. It is important to note that most of the lava samples
180
were sampled in the same way and near their point of emission (Harris et al. 2017). Hereafter these lava samples
181
will be called typical lava sample.
182
183
3 Laboratory Methods
184
After the eruption, all the samples were brought to the Laboratoire Magmas et Volcans (LMV) at
185
Clermont-Ferrand, France, to be analysed and then stored at the OVPF and LMV repositories. A full description
186
of the routine measurements reported below, as well as the raw data presented in this paper, are available in the
187
DynVolc database (2017) and the supplementary material of this paper.
188
3.1 Componentry
189
Considering that each sampling was done randomly (with no clasts selection), the samples are
190
representative of the type of the activity at that moment, without any sample biasing. Specimen selection can be
8
done afterwards in the laboratory. Following the nomenclature of White and Houghton (2006) clasts were
192
subdivided into three broad components: juvenile, non-juvenile and composite fragments. Based on the Gurioli et
193
al. (2018) nomenclature, juvenile fragments are then classified based on their macroscopic characteristics (surface
194
typology, shape and colour).
195
3.2 Bulk texture
196
Density and Helium (He) vesicle connectivity measurements were performed on 208 samples (lapilli,
197
bombs and lava fragments). Two different methods were used for these density measurements (Table S2). (i) First,
198
the density was measured using the water-immersion technique based on the Archimedes principle described by
199
Houghton and Wilson (1989) and Shea et al. (2010). This technique is the most used, and allows us to compare a
200
wide range of data with a good reproducibility of ± 40 kg m-3 (1σ) on five repeated measurements. (ii) Another
201
method was performed using a density analyser (Micromeritics Geopyc 1360, Fig S1). As already briefly presented
202
by Kawabata et al. (2015), the instrument measures object volume and density of particles with different sizes and
203
shapes. These density measurements lead to reproducible data with a maximum standard deviation of ± 30 kg m-3
204
(1σ) on five repeated measurements. For the sake of accuracy, several samples were analysed using the two
205
methods described above and the data correlate relatively well (Table S2). Moreover, the errors of these
206
measurements are insignificant in comparison with the variability of natural porosity in the samples (Gurioli et al.
207
2015). The porosity of the samples was then calculated based on Houghton and Wilson (1989) using a vesicle-free
208
rock density of 2884 ± 35 kg m-3 (1σ). This parameter was determined by powdering four samples and by
209
measuring their masses and volumes using the Micromeritics Accupyc 1340 Helium pycnometer (maximum
210
standard deviation of ± 3.10-8 m3, 1σ, on five repeated measurements for the volume measurements). The Accupyc
211
pycnometer was also used to determine the skeletal volumes of the samples in order to calculate the He vesicle
212
connectivity for each clast (Table S2), using the Formenti and Druitt (2003) and Colombier et al. (2017) methods.
213
3.3 Microscopic texture
214
Based on the density distribution and the variability of the clasts, seven pyroclasts and four lava samples,
215
covering the texture evolution in time and space of the July 2015 eruption, have been selected (Table S3). In order
216
to perform a detailed comparison with the products of the June 2014 eruption, we extended the original dataset of
217
Gurioli et al. (2018) by adding the CSD data of eight samples (seven pyroclasts and one lava fragment) of that
218
eruption. Multiple magnification images were taken in order to quantify all the petrographic characteristics of both
219
pyroclasts and lava samples from the micron (25x and 100x magnifications realized with the JEOL JSM-5910 LV
9
Scanning Electron Microscope (SEM) and using Back-Scattered Electron (BSE) images with an acceleration
221
voltage of 15 kV) to the centimetre scales (thin section scans both under natural and polarized light).
222
All these images were then transformed and binarized in grayscale to allow Matlab program FOAMS
223
(version 1.0.5; Shea et al. 2010) to acquire 2D raw data of all the selected objects (vesicles and crystals) and
224
calculate 3D textural characteristics of the samples, based on the whole sets of images. Both for vesicles and
225
crystals, the minimum object measured was five pixels (equivalent to 6 µm at the maximum magnification 100x
226
we used with the SEM). VSD and vesicle number density (NV) were measured with FOAMS (Shea et al. 2010)
227
counting a total of 48528 vesicles measured for both the July 2015 and June 2014 eruptions. Vesicle to melt ratio
228
(VG/VL) was calculated following Gardner et al. (1996). This ratio represent the vesicle volume divided by the
229
matrix volume. NV and VG/VL parameters are corrected for the phenocryst content.
230
Based on 2D measurements of several thousands of crystals, 3D crystal habits (x:y:z) were determined
231
using CSDslice database (version 4; Morgan and Jerram, 2006): the best fit dimensions are 1:4:10 (tabular shape)
232
for plagioclase crystals and 1:1.5:2.4 (rectangular prism shape) for clinopyroxene crystals. Then CSDcorrections
233
software (version 1.6; Higgins 2000) was used to calculate the CSD, crystal content and crystal number density
234
(NC) of the samples. Based on SEM image observations, the circularity of the crystals is fixed at 0.1 and 0.3 for
235
plagioclase and clinopyroxene, respectively (on a scale of 0 to 1). Olivines and oxides are too rare in the eruptive
236
products of 2014 and 2015 to be statistically measured. As the raw data of crystals from FOAMS are obtained
237
from several nested image magnifications, normalized size frequency data from FOAMS is the most appropriate
238
input to use within the CSDcorrections software. This frequency data calculated from FOAMS (NA, number per
239
unit of area) were used in the frequency data input section of the CSDcorrections software. Calculations are
240
corrected for the vesicle content. Moreover, FOAMS size frequency raw data are based on the crystal equivalent
241
diameters, whereas CSDcorrections input does not use this shape parameter. Thus, the best input measurement to
242
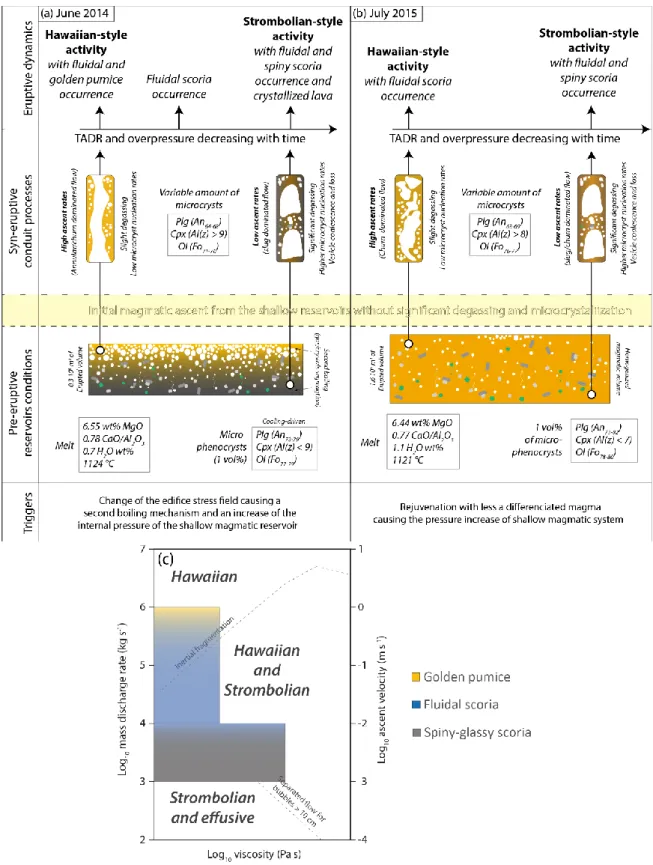
use is the major axis of the crystal ellipse combined with the phase abundance correction measured with FOAMS
243
and corrected for the porosity. This procedure is a requirement to correct stereological conversion of 2D crystal
244
size measurement to 3D CSDs by combining the FOAMS program output with the CSDcorrections software.
245
Based on the work of Cashman (1988), Marsh (1988) and Higgins (2006), one CSD slope theoretically defines a
246
specific crystal population, which form during a single step of nucleation and growth. Slope changes permit to
247
identify different crystal populations (the steeper the slope, the lower the residence time assuming a constant
248
growth, or inversely the steeper the slope, the lower the growth rate assuming a constant residence time). In our
249
dataset, the slope change was defined by the intercept of the best fitting lines of the different crystal populations.
10
All the textural parameters described in this section, as well as the crystal nucleation density (N0), which is the
251
CSD value at x (crystal length) = 0, are reported in the Table S3.
252
3.4 Chemical analysis
253
Bulk rock analyses (ICP-AES) discussed in this study have been already published (Coppola et al. 2017;
254
Gurioli et al. 2018) and were performed on several quenched pyroclasts and lavas (Table S4). We compare these
255
data with our new micro-analyses of July 2015 glasses and crystals (Table S4). They were carried out for major
256
elements by using the Cameca SX100 Electron Probe Micro-Analyser (EPMA). EPMA analysis of June 2014
257
products have been already published in Gurioli et al. (2018). Counting times were 10 seconds for each element,
258
with an acceleration voltage of 15 kV and a current intensity of 8 nA. A 10 µm beam and a focused beam were
259
used for the glass and crystal analysis respectively. Maximum errors (2σ; wt%) for each oxides are ± 0.87 for SiO2,
260
± 0.15 for TiO2, ± 0.36 for Al2O3, ± 0.67 for FeO, ± 0.17 for MnO, ± 0.37 for MgO, ± 0.32 for CaO, ± 0.31 for
261
Na2O, ± 0.04 for K2O and ± 0.16 for P2O5.
262
We also estimated the equilibrium of each mineral phase with bulk rock and glass compositions (Table
263
S4). For the plagioclase (plg), we used the plagioclase/liquid equilibrium constant of Putirka (2008) calibrated for
264
melts whose temperature exceeds 1050 °C: KD(An − Ab) = (XAb plg
XAlO
1.5
liq
XCaOliq )/(XAnplgXNaOliq 0.5XSiOliq2) = 0.27 ±
265
0.11, where X is the molar fraction of the corresponding oxides or albite/anorthite content within plg and melt.
266
For the clinopyroxene (cpx), we used the Mg-Fe coefficient distribution KD(Mg − Fe) = (XFeO cpx
XMgOliq )/
267
(XFeOliq XMgOcpx) = 0.28 ± 0.05 at equilibrium (Putirka 2008; Brugier 2016). Similarly for the olivines, we used the
268
Mg-Fe distribution coefficient KD(Mg − Fe) = (XFeOol XMgO liq
)/(XFeOliq XMgOol ) from Roeder and Emslie (1970; KD =
269
0.30 at equilibrium), Fisk et al. (1988; KD = 0.306 at equilibrium) and Putirka (2008; KD = 0.30 ± 0.03 at
270
equilibrium). An average Fe3+/Fe
total ratio of 0.18, calibrated for La Réunion Island basaltic melts (Pichavant et al.
271
2016), was used to calculate FeO content of the liquid phase.
272
3.5 Geothermometry setup and H2O content estimations
273
Recently, Brugier (2016) studied experimentally the evolution of phase equilibria and phase compositions
274
during the cooling of November 2009 mafic magma in the temperature range 1200-1100 °C. Two sets of
275
experiments were performed (i) at 50 MPa with 0.5 to 1.6 dissolved H2O content in the melt, that is at the H2
O-276
CO2 saturation pressure typically recorded by olivine hosted melt inclusions at PdF (Di Muro et al. 2014, 2016),
11
and (ii) at atmospheric and dry conditions. (i) Hydrous experimental data of Brugier (2016) acquired at 50 MPa
278
and controlled redox conditions (between NNO and NNO-1.7) are fitted to define a first hydrous
MgO-279
thermometer (black line in Fig. S2): 𝑇 (°𝐶) = 943.7 + 27.5 𝑀𝑔𝑂𝑙𝑖𝑞 (R² = 0.83). (ii) Experimental data of
280
Brugier (2016) acquired at atmospheric and controlled redox conditions (NNO and NNO-0.5) are fitted to define
281
a second MgO-thermometer for sub-surface dry magmatic conditions (blue line in Fig. S2): 𝑇 (°𝐶) = 1041.7 +
282
17.7 𝑀𝑔𝑂𝑙𝑖𝑞 (R² = 0.75). Then we are able to compare these newly calibrated thermometers with already published
283
ones (Fig. S2).
284
H2O content within the natural melts of July 2015 eruption are also estimated using the plagioclase-melt
285
hygrometer of Lange et al. (2009).
286
287
4 Results288
4.1 Componentry289
The July 2015 products consist of juvenile fractions which represent the primary magma involved in these
290
eruptions (lavas and pyroclasts). Based on the classification of Gurioli et al. (2018), the July 2015 tephra samples
291
were divided into four types of juvenile pyroclasts: (i) golden pumice, (ii) fluidal scoria, (iii) spiny-glassy scoria
292
and (iv) spiny-opaque scoria. As described by these latter authors, golden pumice are characterized by very smooth,
293
shiny and brown/yellow surfaces. Fluidal scoria are characterized by smooth and shiny dark surfaces. Spiny-glassy
294
scoria show shiny but rough and spiny surfaces. Spiny-opaque clasts are characterized by dark matt and spiny
295
surfaces.
296
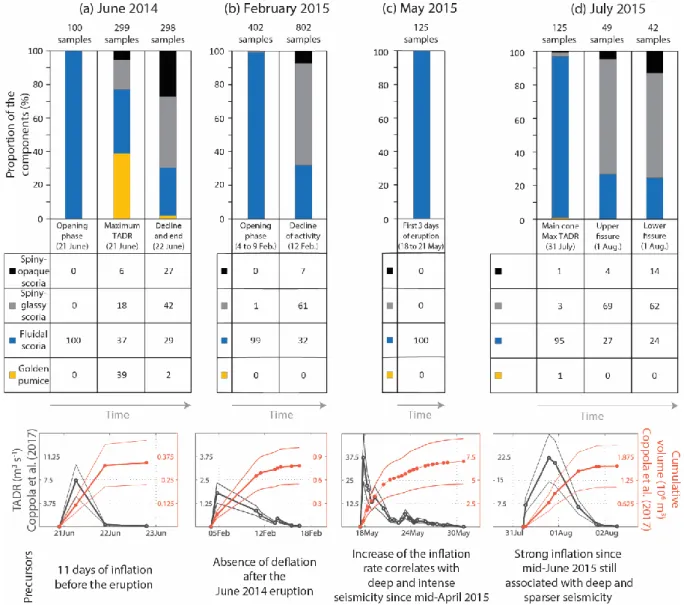
Figure 3 represents the componentry measurements performed on the first four eruptions of the
2014-297
2015 period, as well as their associated TADR (Coppola et al. 2017). The time distribution of the different eruptive
298
components is not constant in time and evolved in parallel with changes in TADR. Samples of the initial phase of
299
these four eruptions show that the pyroclasts emitted during this initial intense phase were mostly fluidal clasts.
300
Only one golden pumice was collected during the initial intense phase of the July 2015 eruption. The scarcity in
301
golden pumice during the three eruptions occurring in 2015 contrasts with the June 2014 eruption, which emitted
302
a significant amount of golden pumice during the maximum TADR (Fig. 3a). Additionally, samples collected in
303
the declining phases of these four eruptions (with relatively low TADR and mild Strombolian-style activity) mostly
304
consist of spiny scoria (both spiny-glassy and spiny-opaque).
12
4.2 Bulk texture
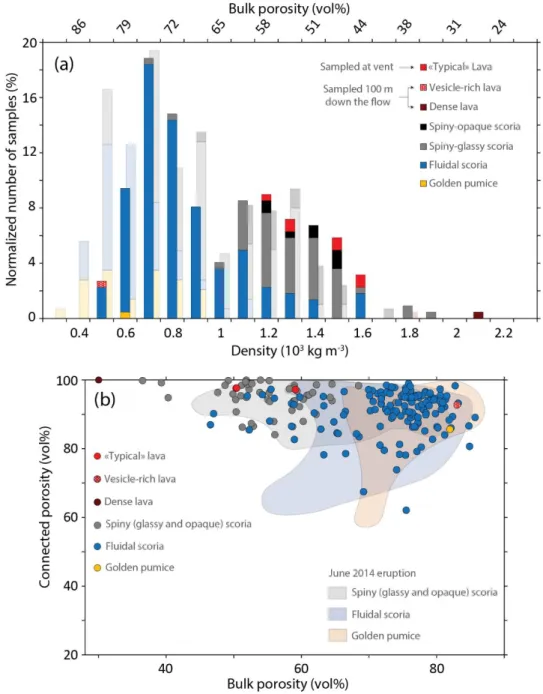
306
The textural components are marked by distinct porosity distributions and textures (Fig. 4a). Focusing on
307
the July 2015 dataset, the porosities of the spiny clasts (both glassy and opaque) vary from 34 to 75 vol% with an
308
average of 54 vol%, while the porosities of the fluidal clasts vary from 44 to 82 vol% with an average of 72 vol%.
309
Only one golden pumice sample has a porosity of 79 vol%. The magma emitted during the maximum TADR is
310
quite porous, while the magma erupted during the decrease in TADR is denser. Typical lava fragments sampled
311
close to the main vent have a density range between 44 and 58 vol% close to that of spiny clasts. However, two
312
lava fragments sampled within the channel, around 100 m from the emission point record extreme density values
313
(82 vol% for the vesicle-rich lava sample and 27 vol% for the dense one). The dense fragment was collected from
314
the channel margin, while the vesicle-rich one was collected within the channel plug, therefore not representative
315
any more of the vent conditions (Harris et al. 2019).
316
Vesicle He connectivity measurements (Fig. 4b) show that the content in isolated vesicles increases in
317
porous clasts with bulk porosity > 60 vol%. The July 2015 fluidal clasts and golden pumice have variable content
318
of isolated vesicles up to 40 vol%. In contrast, spiny clasts and lavas have less or no isolated vesicles (from 0 to
319
15 vol%).
320
4.3 Micro texture
321
Figure 5 represents an overview of the textures of the different pyroclasts and lavas from July 2015
322
eruption. General and qualitative information are provided here, being quantitatively detailed in the sections
323
hereafter. (i) Golden pumice clasts (Fig. 5a) are highly porous and crystal-poor. Thin sections and SEM images
324
show a very low micro-crystallinity, and micro-phenocrysts (called mesocrysts by Gurioli et al. 2018) are very
325
scarce in these samples. Vesicles are rounded. (ii) Fluidal scoria samples (Fig. 5b) have variable but still high
326
porosities and contain slightly more microlites than the golden clasts, and scarce micro-phenocrysts. Vesicles are
327
rounded. (iii) Spiny-glassy scoria (Fig. 5c) have lower porosities than the two previous components and a few big
328
irregular coalesced vesicles occur. Microlites are more abundant and larger, and micro-phenocrysts are still scarce.
329
(iv) Spiny-opaque scoria (Fig. 5d) porosities are quite similar or even lower than in the spiny-glassy scoria with
330
several big coalesced vesicles. Their crystal contents are clearly higher than in the other types of pyroclasts, but
331
still with low micro-phenocryst contents. (v) Typical lavas (Fig. 5e) are dense with intermediate crystal content
332
and show a similar micro-phenocrysts content as in the pyroclasts. The lavas sampled down the flow (not shown
333
in Fig. 5), namely the dense one from the lava flow edges (shear-zone) and the vesicle-rich one from the lava flow
13
center (plug), have extreme values of porosities and the dense lava contains a larger amount of microlites than the
335
vesicle-rich lava (Harris et al. 2019).
336
4.3.1 Vesicle characteristics and size distributions
337
Figure 6a shows the VSD as a function of the total volume that the vesicles represent in the measured
338
samples. The 2015 golden pumice VSD shows a single population of vesicles, ranging from 20 µm to 2.5 mm in
339
diameter, with vesicles of 0.4 mm representing the main mode. A similar distribution is found in the four fluidal
340
scoria pyroclasts that contain also a few big rounded vesicles, up to 4 mm in diameter. Both VSDs of spiny-glassy
341
and spiny-opaque scoria show a bimodal distribution. The main population of this latter distribution corresponds
342
to small vesicles whose main size mode coincides approximately with that of the previous clast types (0.4 and 0.2
343
mm for the spiny-glassy and spiny-opaque samples respectively). However, the volume of this population is about
344
half than the one found in the fluidal and golden clasts. The second population corresponds to large vesicles with
345
irregular contours whose size ranges between 1.5 and 6 mm in diameter. The VSDs of lavas have asymmetric
346
distribution with a main mode of large vesicles at 1 mm in diameter and isolated peaks of large vesicles up to 6
347
mm. The VSD of the dense lava sample has an asymmetric distribution skewed toward large vesicles and a very
348
low total vesicle volume fraction. In contrast, the VSD of the vesicle-rich lava sample is characterized by a
349
unimodal population of small vesicles with a mode at 0.6 mm.
350
Both vesicle number density and vesicle to melt ratios progressively decrease from the golden and fluidal
351
clasts to the spiny clasts and lavas, except the vesicle-rich lava (Fig. 6b). VG/VL of the 2015 dataset decrease from
352
the golden pumice (4.6), to the fluidal scoria (between 1.5 and 4.4) and to the spiny scoria (1.2). The VG/VL ratio
353
of typical lavas are closed to 1, with the exception of the vesicle-rich (4.9) and dense (0.4) fragments. July 2015
354
NV values decrease from golden pumice and fluidal scoria (between 2.6 102 and 1.5 103 mm-3) to spiny scoria
355
(between 1.7 102 and 4.1 102 mm-3). N
V for lava samples are lower than 2.2 102 mm-3.
356
4.3.2 Mineral assemblage and Crystal Size Distributions
357
The July 2015 pyroclasts and lavas contain plagioclase (plg), clinopyroxene (cpx) and scarce olivine (ol)
358
in order of decreasing abundance and size (Fig. 5). Micro-phenocrysts occur as isolated or clusters of several
359
euhedral crystals of plg, cpx and scarce ol. Little resorption/dissolution textures are observed within the 2015
360
micro-phenocrysts of ol (cf. 100x BSE image of the typical lava sample on Fig. 5e). Evidences of crystal resorption
361
have not been found in the other phases (plg and cpx) of the July 2015 magma. Microlite texture is similar for both
14
eruptions, with both isolated and aggregated crystals. Aggregates consists of plg microlites crosscuting cpx grains.
363
Ol is scarce and isolated.
364
The limit between the microlite and micro-phenocryst populations on plg and cpx (Fig. 7a) is mostly
365
dependent on the maximum length of the microlite population that evolves from a component to another. Ol
366
crystals, smaller in size than plg and cpx, were too scarce for statistical analysis. The maximum length of the 2015
367
plg microlites (equivalent to the 3D crystal length) increases from golden pumice (0.5 mm) to fluidal and
spiny-368
glassy scoria (0.9 mm) to lava (1.1 mm) and spiny-opaque scoria (1.2 mm); the maximum length of the cpx
369
microlites increase from golden pumice (0.1 mm) to spiny-glassy scoria (0.4 mm) to lava (0.6 mm) and fluidal and
370
spiny-opaque (0.7 mm). We also performed CSD analysis on some June 2014 eruptive products, that was not
371
presented in Gurioli et al. (2018) and the maximum length evolution of the June 2014 microlites also show the
372
same trend.
373
July 2015 crystal content varies significantly in the different components (Fig. 7b), while their CSDs
374
change only little (Fig. 7a). (i) In the golden pumice, few microlites formed mostly by plg (10 vol%) and scarce
375
cpx (1 vol%) were observed (plg/cpx microlites volume ratio of 10). Total crystal content of golden pumice is the
376
lowest of all the components with only 11 vol% of microlites with very scarce micro-phenocrysts (< 1 vol%). (ii)
377
Fluidal scoria contain a slightly higher content of microlites (13 to 18 vol% with an average plg/cpx of 5) and their
378
content in micro-phenocrysts remain very low (around 1 vol%). (iii) Spiny-glassy and spiny-opaque have higher
379
content in microlites (25 and 43 vol% respectively with an average plg/cpx of 3) and micro-phenocrysts are slightly
380
more abundant (4 and 5 vol% respectively). (iv) Microlite content from typical lava fragments (excluding the
381
vesicle-rich and dense one) range from 28 to 34 vol% (average plg/cpx of 3) with 1 to 3 vol% of micro-phenocrysts.
382
Maximum size of micro-phenocrysts is the same for all the components (no more than 4 mm), except for the golden
383
pumice in which big crystals are not incorporated. CSD of the June 2014 products show that these products
384
incorporated bigger micro-phenocrysts of plg and cpx (up to 8 mm) than the July 2015 magma.
385
4.4 Bulk rock, glass, crystals and experimental analyses
386
4.4.1 Crystal compositions
387
We identified three different groups of crystals with distinct compositions and sizes: (i) the phenocrysts,
388
(ii) the micro-phenocrysts and (iii) the microlites. Phenocrysts (larger than 1 cm and interpreted as antecrysts in
389
June 2014; Gurioli et al. 2018) have not been observed in July 2015.
15
In July 2015 products, micro-phenocrysts of plagioclase (An73-85) are more calcic than the microlites
391
(An63-69). A compositional gap is observed between the two populations (Fig. 8a). Some of the July 2015
micro-392
phenocrysts of plg are reversely zoned (from An75 in the cores to An80 in the rims, see c1-r1 and c2-r2 couples in
393
Fig. 8a and Table S4). This reverse zoning has been only observed on plg micro-phenocrysts.
394
Cpx crystals of July 2015 (both microlites and micro-phenocrysts) straddle between augite and diopside
395
compositions within a narrow range of composition (En48-40Fs9-14Wo42-46; Table S4). The populations of cpx
396
microlite and micro-phenocryst can be distinguished for their TiO2 content and the percentage of the tetrahedral
397
sites occupied by Al (Fig. 8b), called Al(z). Micro-phenocrysts have low TiO2 content and Al(z) (between 0.7 and
398
1.5 of TiO2 wt%; between 3 and 7% for Al(z)), while microlites exhibit the highest values (between 1.5 and 4 of
399
TiO2 wt%; between 7 and 17% for Al(z)). A change in the slope of the increasing trend of Al(z) and TiO2 content
400
is observed. This trend was already observed in the other PdF products and attributed to the effect of enhanced plg
401
crystallization (Al-rich) on the melt composition (Boivin and Bachèlery 2009; Di Muro et al. 2015).
402
Ol crystals of July 2015 are unzoned and homogeneous in composition, which correspond to Fo78-80 for
403
micro-phenocrysts and Fo76-77 for microlites (Fig. 8c and Table S4).
404
4.4.2 Bulk rock, glass analyses
405
Magmas emitted by PdF between June 2014 and July 2015 are aphyric transitional basalts (MgO: 6.1-7.1
406
wt%; K2O: 0.7-0.8 wt%; CaO/Al2O3: 0.7-0.8; red box in Fig. 9a; Table S4). In the frame of the 2014-2015 sequence
407
of eruptions, the products of June 2014, February and May 2015 events were evolved basalts (Coppola et al. 2017)
408
from an initial magma input that occurred in November 2009. Hydrous experimental compositions performed by
409
Brugier (2016) show a marked decrease in CaO/Al2O3 at T < 1150°C (ol crystallization above this temperature,
410
with the occurrence of ol, cpx then plg below this temperature) and reproduce relatively well the natural bulk rock
411
compositions from December 2009 to May 2015 by decreasing temperature from 1200 to 1100 °C (Fig. 9b). A
412
reverse trend is then observed since the July 2015 eruption with a progressive increase of the CaO/Al2O3 and
413
MgO content until the August-Ocotber 2015 magmas (Fig. 9a; Coppola et al. 2017).
414
Focusing on the July 2015 products, the golden pumice glass has an average CaO/Al2O3 ratio of 0.76
415
(close to that of the bulk rock) and an average MgO content of 5.8 wt% (slightly lower than the bulk rock). This
416
difference can be explained by the occurrence of a small amount of micro-phenocrysts of ol (ca. 2 wt%) within
417
the bulk rock. MgO content (controlled by the micro-crystallization of ol) and CaO/Al2O3 ratio (controlled by the
16
micro-crystallization of plg and cpx) of interstitial glasses decrease from the golden, to the fluidal, to the spiny
419
clasts (Fig. 9c; Table S4). Microlite-rich spiny opaque clasts have the most evolved interstitial glasses (from 4.2
420
to 5.3 wt% in MgO and from 0.71 to 0.78 for CaO/Al2O3). Matrix in lavas have similar compositions to the fluidal
421
scoria. The July 2015 tephra glass compositions mimic those found in the June 2014 eruption (Gurioli et al. 2018).
422
4.4.3 Phase equilibria
423
Plg microlites observed in the July 2015 products are in equilibrium with their matrix (KD = 0.29 on
424
average), and most of the plg micro-phenocrysts (included the reversely zoned plg) are in equilibrium with the
425
hybrid bulk rock (average KD = 0.22). Plg micro-phenocryst of July 2015 with relatively high anorthite (> An82)
426
might be considered as antecrysts because they do not fulfil the equilibrium conditions with the bulk rock (like the
427
high Fo olivine in the June 2014 magma). The cpx micro-phenocrysts are in equilibrium (KD = 0.24 in average)
428
with the bulk rock as well as the microlites with their matrix (KD = 0.28 in average). Both ol microlites and
micro-429
phenocrysts are in equilibrium with their surrounding glass (KD = 0.28 in average) and bulk rock (KD = 0.28 in
430
average), respectively.
431
4.6 Temperature and H2O content
432
Microlites content of the different eruptive component increase progressively from the golden pumice to
433
the fluidal scoria to finally the spiny scoria. Moreover, the K2O (incompatible element) content decrease from the
434
bulk rock (0.74 wt% in average), to the golden pumice (0.89 wt% in average), to fluidal scoria and lava (0.96 wt%
435
in average), to finally the spiny scoria (1.07 wt% in average). We thus suggest that (i) the bulk-rock represent the
436
microlite-free and pre-eruptive conditions end-member, (ii) whereas the fluidal, lava and spiny components
437
represent the microlite-rich and syn-eruptive conditions end-member, with golden pumice representing the
438
beginning of the crystallization of the melt during the ascent of the magma and the transition between the pre and
439
syn-eruptive conditions. Using the newly calibrated hydrous thermometer to constrain pre-eruptive conditions
440
(Fig. S2), we calculated temperatures from 1171 °C for the November 2009 most mafic bulk magma composition
441
to 1114 °C for the February and May 2015 bulk magma compositions. Calculated June 2014 and July 2015 bulk
442
magma temperatures are 1124 and 1121 °C respectively. The average temperature of the golden pumice magma
443
component, which is thought to also correspond to pre-eruptive melt conditions, is 1103 ± 4 °C (Fig. 10). These
444
bulk magma and golden pumice temperatures are fully consistent with the temperature of crystallization of ol and
445
cpx in equilibrium within the hydrous experiments of Brugier (2016). Temperatures of the other component
446
(fluidal scoria, spiny scoria and lavas), which we considered as mainly degassed, are calculated using the newly
17
calibrated dry thermometer (Fig. S2). Average temperature range from 1137 ± 6 °C for fluidal scoria and typical
448
lavas to 1128 ± 6 and 1127 ± 9 °C for spiny-glassy and spiny-opaque respectively (July 2015 eruption). Calculated
449
temperatures of the vesicle-rich lava (plug of the lava flow) and dense lava (margin of the lava flow) are
450
respectively 1138 ± 3 °C and 1126 ± 2 °C.
451
H2O calculations were performed on plg crystals and melts on equilibrium (Table S4). (i) Equilibrium
452
between plg micro-phenocrysts and bulk rock compositions lead to relatively high H2O content of 1.1 ± 0.3 wt%
453
(using pre-eruptive parameters of 1121 °C and 50 MPa) which are consistent with the dissolved H2O content in
454
Brugier (2016) 50 MPa experiments (0.5 to 1.6 wt%) and with PdF pre-eruptive conditions (Di Muro et al. 2014,
455
2016). (ii) Golden pumice water content can be estimated using the equilibrium between plg microlites and
456
surrounding glass compositions. With this assumption, H2O content values between 0.8 ± 0.3 wt% have been found
457
using pre-eruptive parameters (1103 °C and 50 MPa). The H2O contents of the other eruptive components (fluidal
458
scoria, spiny scoria and lavas) are estimated using the equilibrium between plg microlites and surrounding glass
459
compositions, with syn-eruptive and atmospheric conditions. It leads to an average H2O of 0.4 ± 0.3 wt%.
460
461
5 Discussion
462
5.1 Componentry evolution with magma output rates and eruptive dynamics
463
Textural and chemical features of the juvenile samples collected during the different eruptions, are
464
representative of the magma at fragmentation. The exception is represented by the spiny-opaque fragments which
465
are interpreted as recycled, composite juvenile products (Gurioli et al. 2018). We also assume that the sampling
466
procedure is statistically representative of the on-going eruptive activity at the time of the sampling. Therefore we
467
can infer some important conclusions.
468
The chronological evolution of the componentry of the material emitted during the first four eruptions of
469
the 2014-2015 period, mirrors the progressive TADR decrease (Fig. 3) and the eruptive dynamics evolution (Fig.
470
2). (i) Vesicular fluidal scoria (800 kg m-3; Fig. 4a) is preferentially emitted at the beginning of the eruptions,
471
correlated with the TADR peaks and with mild lava fountains (Hawaiian-style activity; Fig. 2a, 2b and 2c). (ii)
472
Denser spiny scoria (1300 kg m-3; Fig. 4a) emissions preferentially occur afterwards and at the end of these
473
eruptions, correlated with the TADR decrease and a Strombolian-style activity; Fig. 2d). Thus, the vesicle content
474
within the eruptive products decreases with the decreasing of TADR, eruptive intensity and time.
18
The four components (Fig. 5) are not systematically ubiquitous in the studied eruption products (Fig. 3).
476
The vesicular golden pumice (800 kg m-3)are in fact only present in the June 2014 eruption and just one single
477
fragment has been found in the July 2015 deposits. These golden pumice occurred during the TADR peak at the
478
beginning of the eruptions. During the June 2014 eruption, a 100% crystallized and dense (1800 kg m-3) lava was
479
extruded as well. Gurioli et al. (2018) interpreted these features as derived from a second boiling mechanism which
480
segregated the exsolved gas (golden pumice) and the crystals (lava) within the shallow reservoir and triggered the
481
eruption. Therefore, the highly vesicular golden pumice occurrence is not necessarily linked with the eruptive
482
intensity, as the June 2014 eruption was relatively low in terms of TADR and emitted volume compared to the
483
other eruptions (Fig. 3). On the other side, the fact that these end-member products (vesicular and crystal-free
484
golden pumice vs. dense and crystal-full lava) are no longer observed in the following eruptions of February, May
485
and July 2015 eruptions, evidence the occurrence of different trigger mechanisms than the June 2014 eruption as
486
well as different cooling conditions of the shallow reservoirs.
487
5.2. Pre-eruptive shallow magmatic reservoir conditions
488
Natural and experimental melt compositions (Figs. 9a and 9b) coupled with micro-phenocrysts sizes (Fig.
489
7a), contents (Fig. 7b) and compositions (Fig. 8) of juvenile fragments are the main direct measurements to gain
490
information on the pre-eruptive conditions of the eruptions. First, experimental melt composition evolution from
491
Brugier (2016) support the idea of Coppola et al. (2017) and Gurioli et al. (2018) that the June 2014 magma, as
492
well as the February and May 2015 magmas, are chronologically inherited from the differentiation of the
493
November 2009 parental magma (Fig. 9b). However, Coppola et al. (2017) highlight the fact that the MgO content
494
and CaO/Al2O3 ratio of the July 2015 bulk rock composition (6.44 wt% and 0.77 respectively) is slightly higher,
495
than those of the May 2015 one (6.18 wt% and 0.74; Fig. 9a). Therefore, these authors interpret the July 2015 bulk
496
rock composition as representative of a hybrid magma resulting from a process of magmatic rejuvenation of the
497
shallow system of PdF. Again, these observations suggest that the June 2014 and the July 2015 eruptions were
498
triggered by different pre-eruptive processes.
499
Two crystal populations are clearly visible on the CSD performed on the eruptive products of both June
500
2014 and July 2015 eruptions (Fig. 7a). The first crystal population of relatively small size (< 1.2 mm) and high
501
slope represents the microlite population and will be discussed in the section hereafter. The second crystal
502
population represents the micro-phenocrysts, with lower CSD slopes and larger sizes, and may give us some
503
indications of the pre-eruptive processes. The following observations suggest that the July 2015 magma exhibited
19
a partial pre-eruptive rejuvenation. (i) Some of the July 2015 plg micro-phenocrysts record reverse zoning (Fig.
505
8a) and (ii) rare plg micro-phenocrysts has been measured with a very high anorthite content (An85; Fig. 8a) that
506
may be inherited from a new relatively low differentiated magmatic input. (iii) The incapability of the hydrous
507
experiments to reproduce calcic plg composition may also suggest that they result from a magma hybridisation
508
process, which was not experienced by the experiments. (iv) Slightly higher forsterite contents of the July 2015 ol
509
micro-phenocrysts are observed compared to those of June 2014 (Fig. 8c) and (v) rare resorbed features are
510
observed on the July 2015 ol micro-phenocrysts (Fig. 5e), which is consistent with the input of a relatively hot
511
(1144 °C) mafic magma into a dominantly cold (1114 °C) differentiated magma. Finally, (vi) we suggest that the
512
surprisingly high temperature range measured in the July 2015 lava matrix actually records the pre-eruptive
513
hybridisation processes. Again, all these results are coherent with the idea of Coppola et al. (2017) that suggest
514
that the July 2015 magma is the result of a mixing between 65-75 % of a differentiated magma and 25-35 % of
515
less differentiated magma. Moreover, the cooling hydrous experiments of Brugier (2016) confirm that the natural
516
evolved basalts emitted between December 2009 and May 2015 are formed by progressive cooling and
517
crystallization of a former magma recharge occurred in November 2009 (Fig. 9b). CSDs also suggest that the June
518
2014 micro-phenocrysts are larger (up to 8 mm in length) than the July 2015 one (4 mm in length), which is in
519
agreement with a more mature and relatively crystal-richer shallow reservoir for the June 2014 eruption.
520
On the other hand, the new hydrous MgO-thermometer, calibrated for pre-eruptive magmatic conditions
521
(50 MPa and dissolved H2O from 0.5 to 1.6 wt% within experimental samples; black line in Fig. S2) leads to
522
relatively low pre-eruptive temperatures of 1103 (golden pumice) to 1121 °C (bulk rock) for July 2015, mostly
523
because the H2O content dissolved in the pre-eruptive magmas tends to decrease the magma temperature.
524
Moreover, H2O calculations with the plg micro-phenocrysts/bulk rock equilibrium lead to relatively high H2O
525
content in the natural samples (0.8 to 1.5 wt% ± 0.3, 1.1 wt% in average) that show that the micro-phenocrysts
526
form under undegassed (saturated) and pressurized conditions, by cooling-driven crystallization.
527
5.3 Syn-eruptive conduit processes
528
Micro-texture as VSD (Fig. 6a), microlite sizes (Fig. 7a), contents (Fig. 7b) and compositions (Fig. 8), as
529
well as glass compositions (Fig. 9c) are the most relevant parameters that we can measure from the eruptive
530
products to track the syn-eruptive conduit processes.
531
First, VSDs show an initial unimodal vesicle population within the golden pumice and fluidal scoria (Fig.
532
6a), which represent vesicle nucleation and growth mostly within the eruptive dyke during the initial phases of
20
both June 2014 and July 2015 eruptions, when the TADR were still relatively high and coupled with
Hawaiian-534
style activity. In the June 2014 golden pumice, vesicle nucleation also occur before the eruption as Gurioli et al.
535
(2018) interpreted this highly vesiculated component as the product of a pre-eruptive second boiling mechanism.
536
Then, the VSDs within the spiny-scoria and typical lavas are characterized by two different modes. These latter
537
modes represent an episode of vesicle nucleation and growth (for the small size vesicles, occurring in the golden
538
pumice and fluidal scoria as well) followed in time by the formation of large vesicles (up to 1 cm in diameter) by
539
coalescence. This coalescence phase is probably enhanced by slow ascent of the magma in the conduit, coinciding
540
with low TADR and Strombolian-style dominantly effusive activity. Moreover, we observe within the pyroclasts
541
two positive correlation trends between NV and VG/VL, with distinct slopes (Fig. 6b). These two trends are mostly
542
explained by bubble coalescence associated with gas loss. Vesicle coalescence within the collected samples is also
543
highlighted by the He vesicle connectivity measurements (Fig. 4b) where vesicles of the spiny scoria and lavas are
544
more connected (0 to 15 vol% of isolated vesicles) than in the golden pumice and fluidal scoria (0 to 40 vol% of
545
isolated vesicles). All these observations explain the transition between an initial closed degassing system
546
dominated by relatively high TADR and high magma ascent rates (producing golden pumice and fluidal scoria)
547
with an open system degassing dominated by relatively low TADR and low magma ascent rates (producing spiny
548
scoria). This interpretation is also coherent with the decrease of Nv from golden to spiny fragments that should
549
reflect a decrease of the decompression rate (Toramaru 2006; Table S3): considering all the vesicles of each
550
erupted component and assuming that they form in the conduit (which may not be accurate for the June 2014
551
golden pumice), the model permits to calculate maximum decompression rates at the beginning of the eruptions
552
during Hawaiian-style activities (0.08 MPa.s-1 for the July 2015 golden pumice), whereas lower decompression
553
rates are calculated for latter Strombolian-style activities (between of 0.03 and 0.05 MPa.s-1 for spiny-glassy scoria
554
of the July 2015 and June 2014 eruptions respectively). These decompression rates are typically similar than those
555
estimated in basaltic eruptions with dyke radius around 1 m (Shea 2017).
556
The presence of isolated vesicles in golden pumice and fluidal scoria suggest also that these erupted
557
products are naturally quenched in a relatively hot surface environment (lava fountaining thermal environment)
558
whereas the spiny scoria are quenched in a colder environment (colder Strombolian explosions environment)
559
where brittle mechanisms may occur (rock cracking that connect the vesicles).
560
Similarly to decompression rate meter of Toramaru (2006), we applied the NC water exsolution rate meter
561
of Toramaru et al. (2008; Table S3). Calculated water exsolution rates are decreasing from the golden pumice (2.1
562
and 2.2 10-4 wt% s-1 for the July 2014 and June 2015 eruptions respectively) to spiny-glassy scoria (2.8 and 5.8